Agricultural water quality is a critical aspect of crop production. It is especially important to ensure compliance with regulations such as the Produce Safety Rule (PSR) established by the Food and Drug Administration (FDA). This article describes the PSR guidelines to manage microbial contamination risks and on-farm water management options to minimize risks. It delineates various parameters of water quality, including physical, chemical, and biological factors, and emphasizes the significance of generic Escherichia coli (E. coli) as an indicator organism.
This article also provides insights into water treatment options for both preharvest and postharvest applications. Each treatment method is discussed in terms of its principles, effectiveness, operational considerations, and potential limitations. To help informed decision making about water treatment strategies on farms, this article addresses aspects like treatment monitoring, effective use, and regulatory compliance.
Introduction
Agricultural water is an essential resource in farms for preharvest and postharvest activities. However, growers must acknowledge that agricultural water can be a potential source of contamination for produce. Therefore, managing the quality of water used in agricultural practices plays a pivotal role in minimizing contamination risks to ensure food safety and compliance with regulatory standards.
The Produce Safety Rule (PSR) issued under the Food Safety Modernization Act (FSMA) by the Food and Drug Administration (FDA) mandates guidelines to manage risks associated with microbial contamination of produce. While there are chemical and physical risks, the PSR only focuses on microbial risks. Identifying and minimizing risks related to agricultural water management is central to PSR compliance.
Monitoring for generic Escherichia coli (E. coli), which serves as a key indicator of fecal contamination, can help growers assess and manage risks related to agricultural water quality. For preharvest water uses, growers must conduct a system-based assessment to identify and manage contamination risks. Testing for generic E. coli can be part of the preharvest water assessment but is not required under the PSR. Growers must demonstrate that water used in postharvest activities has no detectable generic E. coli.
Water quality parameters
Water quality assessment encompasses various parameters, including physical (e.g., suspended solids, turbidity), chemical (e.g., mineral content, specific compounds), and biological factors (e.g., parasites, bacterial counts, E. coli). Physical and chemical parameters provide insights into water clarity, composition, and odor. Biological indicators are crucial for assessing microbial contamination levels, especially generic E. coli, as indicated by the PSR.
The terms “good” or “bad” water quality are specific to the intended use of the water. For example, how much do we care about the taste of water used to irrigate lawns versus drinking water? The intended use of the water will dictate which parameters to evaluate and the tolerable levels. This article focuses on the water quality needed to meet the guidelines set by the PSR.
The PSR states that all agricultural water must be safe and of adequate sanitary quality for its intended use. The PSR defines agricultural water as water that is intended or likely to contact covered produce or food contact surfaces during preharvest (e.g., irrigation, sprays, etc.) and postharvest (e.g., washing produce, hand washing, cleaning, sanitizing, etc.).
PSR water quality guidelines
The PSR stipulates specific water quality criteria for preharvest and postharvest applications. An assessment of risks and documentation of mitigation practices is required for preharvest water. Postharvest water focuses on generic E. coli levels as indicative of microbial contamination.
Preharvest water
Prior to 2024, the PSR required growers to build a water quality profile based on records for preharvest water showing a specific geometric mean and statistical threshold value for generic E. coli counts per 100mL of water. As of 2024, the E. coli water quality profile was replaced by a systems-based assessment, which requires growers to identify and document risks related to preharvest water management on their farms and action plans to mitigate those risks. Testing for E. coli is not required for preharvest water, but it is a tool that can help farmers create their system-based assessment plan. Farmers are exempt from assessment if they provide evidence that their preharvest water meets the postharvest water guidelines ensuring that the quality will not likely change prior to use.
Post-harvest water
Postharvest water tests should exhibit no detectable levels of generic E. coli per 100mL. It is not allowed to use untreated surface water for postharvest activities. It is required for growers to test generic E. coli to provide evidence that the agricultural water is safe for postharvest activities.
Risk assessment of preharvest water
Thorough risk assessments are needed when using preharvest water due to its inherent risks of contamination. To assess the risks, the grower must evaluate the water source, the water distribution system, the method of application, and the timing of application. This article provides an overview of the assessment but detailed instructions can be found on the FDA’s website and also in an article from the Missouri Produce Growers Bulletin.
Water source
Farmers can choose between municipal, groundwater, and surface water sources; each has different risks. Municipal water has the lowest contamination risk, surface water has the highest risk, and groundwater sits in between. Municipal water has low risk because the suppliers are required to make water safe for drinking purposes. Groundwater has low risk, but it can become contaminated from poorly maintained/installed wellheads and events happening in the vicinity of the wellhead (runoffs, flooding, broken septic tanks, etc.). Surface water has a high risk because it is subject to contamination from wildlife and/or surrounding land activities.
Even when using municipal water, growers must be aware that their management practices can increase the risk of contamination. For example, municipal water that is stored in an open water tank becomes surface water since it is exposed to potential contamination from the surrounding environment. The grower needs to acknowledge such contamination risks and have a management plan to minimize them.
Irrigation method
Different irrigation methods, such as overhead (sprinkler), flood (surface, furrow), and drip (trickle, subsurface), entail varying degrees of risk regarding direct contact with produce and potential exposure to contaminants. It is less likely for contaminated water to touch the tomato fruits when using drip irrigation, as opposed to using sprinklers. However, accidents can happen, and the grower must inspect the water distribution system, document findings, and have a plan in place to minimize risks in case of an accident.
Timing of application
The more time between the application of water and harvest reduces microbiological produce safety risks. Pathogens can die over time when exposed to harsh environmental conditions such as water evaporating, sunlight, and temperature. However, pathogens can survive for extended periods of time, they can form biofilms, and they can regrow on a surface so preventing contamination should be a priority. The timing of application is not allowed as a corrective measure or alternative measure to fixing other issues with water management on the farm. This means that growers cannot use the timing of application as a fix instead of addressing the root causes of poor water quality in their farm.
Water treatment options for microbial control
Growers have the option to use water treatment technologies that minimize risks of contamination. Water treatment technologies can also help with the control of waterborne plant pathogens. The use of water treatment technologies is not required by the PSR, but growers using water treatment must document that the treatment is used correctly. Growers should use water treatment when washing produce. Keep in mind that the treatment is not intended to sanitize contaminated produce; it is there to prevent cross-contamination of uncontaminated produce in case there is contaminated produce. Also, growers may use treatment to meet the no detectable generic E.coli requirement for postharvest water.
Proper water treatment depends on using the correct dose, contact time, and adequate water quality. Dissolved organic matter and suspended organic or inorganic particles can negatively affect treatment effectiveness. Filtration can improve water quality to ensure proper disinfection.
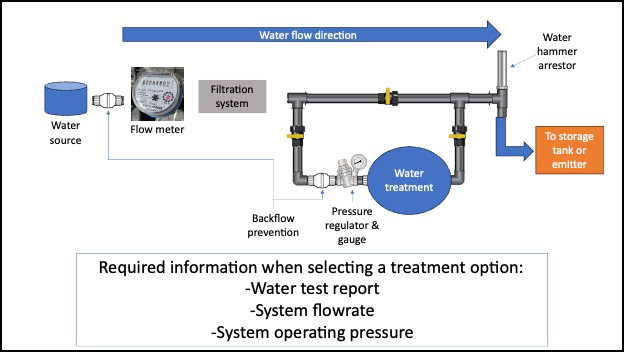
When shopping for water treatment technologies, water treatment suppliers will ask the growers to give information about their system. This includes the operating pressure, the flow rate, water testing report, and a map of their water distribution system. The supplier uses this information to match the size of the water treatment to the grower’s irrigation system. It is recommended to install the treatment option in a bypass system with a backflow prevention device to prevent any backflow to the water source (Figure 1). Depending on the water quality and water treatment technology, a pre-filtration system may be necessary to ensure proper disinfection of the water. With chemical water treatment options, always verify that the label indicates that the product is approved to treat water for preharvest and/or postharvest activities.
Physical treatment methods
Physical treatment methods focus on the removal of contaminants through filtration or inactivating them through ultraviolet (UV) radiation. The presence of organic and inorganic particles in the water can negatively impact the biocidal efficacy of treatment systems and increase wear of the irrigation system. Therefore, filtration is usually combined with other treatment systems to ensure biocidal effectiveness.
Filtration
Filters are sold according to the particle size they can filter reported as either “mesh” or “micron” (short for micrometer - μm). For example, 200 mesh will remove particles above 74μm in diameter, 300 mesh will remove particles above 50μm, and 400 mesh will remove particles above 37μm. Filter screen sizes over 400 mesh (under 37μm) do not exist because it is not possible to fabricate a screen with such small spacing.
For context, E. coli cells have a diameter of around 1μm and there are no filter screens to remove it. Filtration has no residual effect, meaning that the water quality can be compromised after treatment. Table 1 summarizes the several types of filters and some of their properties.
Table 1. Types of filters used to remove particles from water.
| Filter type | Particle size | Operating principle | Additional notes |
|---|---|---|---|
| Centrifugal separators | Effective at removing large particles such as sand or organic debris. Ineffective removal of pathogens and dissolved organic matter. | Water swirls around a cylinder creating a centrifugal force that separates particles. | They are commonly used to treat large volumes of water. They need scheduled maintenance to check for clogging and worn parts. |
| Screen filters | Good for large particles and debris between 300-500 mesh. Ineffective removal of pathogens and dissolved organic matter. | Exclusion of particles using paper, plastic, or metallic screens. | They need scheduled cleaning and maintenance. |
| Disk filters | Good for removing particles and organic matter between 40-650 mesh. | Exclusion of particles using dented disc rings. The space between the rings and the dents trap particles and organic matter. | They need scheduled cleaning and maintenance. |
| Media filters | Good for removing particles, organic matter, and some pathogens between 5-50µm. | Forces water through a packed solid phase media. The media can be made of crushed sand, fiberglass, plastic beads, paper, or fabric. | Commonly used to treat large volumes of water. It needs scheduled cleaning, maintenance, or replacement of the media. |
| Membrane filtration (reverse osmosis) | Effective at removing pathogens, chemical compounds, and dissolved salts. Particle size removal ranges from 0.1-0.0005µm. | Forces water through semi-permeable membranes, applying pressure greater than the osmotic pressure on the side that has the water source. | Easily clogged by large particles and organic matter. Needs prefiltered water to prevent clogging. It uses 4 gallons of water to generate 1 gallon of treated water. The amount of wastewater increases as the membranes age. |
UV radiation
UV radiation damages the DNA of microorganisms, leading to disruptions in their genetic material. This damage prevents the microorganisms from replicating and functioning properly, effectively inactivating pathogens and thus reducing the microbial risks.
The effective UV wavelength ranges between 240-280 nm at an intensity of 250-500mJ/cm2. The efficacy of UV treatment depends on the ability of the water to transmit light, so the turbidity of water is a critical factor that impacts the effectiveness of the UV treatment. It is typically combined with other water treatment systems for waters with low transmittance or high turbidity. UV disinfection has no residual effect, and the grower should manage the water to prevent contamination after treatment. Table 2 summarizes the recommended water quality needed for UV treatment.
Table 2. Recommended water quality for effective UV treatment.
| Turbidity | Total Suspended Solids | Ferric Iron | Permanganate | pH | Recommended pre-filtration |
|---|---|---|---|---|---|
| < 5 NTU | Less than 10ppm | Less than 0.05ppm | Less than 0.9ppm | 6.5-9.5 | 5-10μm |
Chemical treatment methods
Most chemical sanitizers used to treat water form strong oxidizers, free radicals, and reactive oxygen species which inactivate microorganisms. Growers must shop for injectors that can withstand the use of strong oxidizers and that are resistant to oxidation. A novel treatment technology, cold plasma discharge, uses electromagnetism principles instead of chemical reactions to generate reactive species.
Chemical treatment options, such as chlorination, chlorine dioxide, ozone, hydrogen peroxide and peracetic acid, offer potent disinfection capabilities against a broad spectrum of pathogens. Growers must select product formulations that are labeled to treat water for preharvest and/or postharvest use (updated database available from Cornell University’s Produce Safety Alliance website). If you use a chemical sanitizer, you must keep records of its concentration and other water quality parameters that may impact its efficacy. Testing for generic E. coli will help you determine if the sanitizer helps your water quality meet the PSR guidelines.
Always read the label to make sure that you are using the product as intended and at recommended doses. Some treatment options are registered as restricted use pesticides, so you might want to consider taking a private pesticide applicator training to get a license. The label will also provide additional information related to personal protective equipment, disposal, and if the produce will need to be rinsed with potable water or not after being exposed to the sanitizer. When used to treat preharvest water, some crops may be sensitive to the sanitizers. Test the product at the recommended doses on some plants before using them to see if your plants develop phytotoxic symptoms.
Chemical injection systems such as proportioners, venturi, positive displacement pumps, or tablet systems are used to dose chemical sanitizer to the water. Calculations are provided in this guide to show you how to estimate the amount of product needed depending on the type of injector used. This guide will focus on the most widely used options such as chlorine, chlorine dioxide, hydrogen peroxide and peracetic acid.
Chlorine
Chlorination is widely utilized for its efficacy, cost-effectiveness, and ease of implementation. Common sources of chlorine include sodium hypochlorite (bleach), calcium hypochlorite (chorine tablets) and chlorine gas. Once dissolved in water, chlorine exists as hypochlorous acid (HOCl – acts within seconds) and hypochlorite ions (OCl- – takes up to 30 minutes to act). The fast-acting form (hypochlorous acid) will kill suspended microorganisms, and the slow-acting form (hypochlorite ions) is preferred for biofilm control.
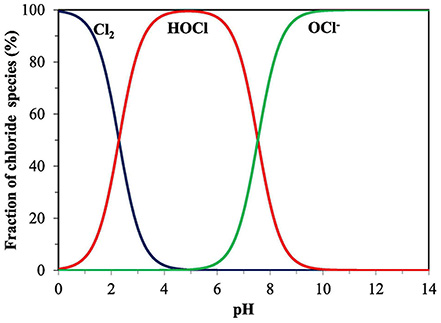
Careful consideration of water quality factors such as water pH, organic matter content, and ammonium concentration is essential to ensure optimal disinfection outcomes. The water pH will determine which chlorine form is more prevalent (Figure 2). For immediate water treatment keep the water pH between 6.5 and 7 since most of the chlorine will be the fast-acting form (hypochlorous acid). If the pH is above 7.5 you need to make sure that the water sits at least 30 minutes before use, since the slow acting form is the more prevalent. Organic matter and dissolved ferrous iron will need to be filtered out of the water prior to chlorination because they will immediately react with the chlorine before it has the chance to kill microorganisms.
Chlorine’s reaction with organic matter and nitrogen can create harmful disinfection byproducts. The disinfection byproducts can be avoided by using a filtration step prior to chlorination or using alternatives such as hydrogen peroxide and peracetic acid.
The amount of chlorine that is not bound to organic matter and that is available for disinfection is known as “free chlorine” or “available chlorine.” When monitoring for chlorine levels, measure the concentration of free chlorine instead of total chlorine. For produce washing, the Clorox® label indicates submerging produce for 2 minutes in a solution of 25ppm of available chorine, followed by a rinse with potable water.1 Always consult the product label to determine proper dose and use of the chlorine sanitizer. Chlorine can be measured using test strips, color wheels or digital colorimeters. Make sure to use devices that can measure free (available) and total chlorine. Also, the monitoring devices will test for different chlorine ranges so make sure you pick a monitoring device that will measure chlorine at a range listed on the product label. It’s important to follow the directions listed on the label.
Chlorine dioxide
Chlorine dioxide is different from chlorine, despite its similar name. Chlorine dioxide is highly corrosive and has a short shelf life of 7-10 days. It treats water effectively from pH 4-10. Chlorine dioxide is used to remove and prevent biofilm buildup in irrigation systems. Using shock treatment at 20-50ppm chlorine dioxide removes biofilms from the irrigation system. For more on control of waterborne microbes in irrigation, see DOI: 10.1016/j.agwat.2014.06.007. Be aware that the shock treatment concentration will harm plants. Residual concentrations of 0.25ppm can be used continuously to help prevent biofilm buildup. If continuous treatment of preharvest water is performed, test the concentration on some plants to see if chlorine dioxide is harmful to them at the recommended concentrations. Different plants will have different tolerance levels to varying chlorine dioxide concentrations.
Chlorine dioxide can be used as an antimicrobial in water used to wash produce as long as it’s below 3ppm (21 CFR 173.300(b)(2)). After treatment, the produce must be rinsed with potable water, blanched, cooked, or canned (21 CFR 173.300(b)(2)). Sensors (amperometric method), color wheels (titration) and photometers can monitor chlorine dioxide concentrations.
Hydrogen peroxide and peracetic acid
Hydrogen peroxide sanitizers are available for growers. Peracetic acid is created by combining hydrogen peroxide with acetic acid. Both hydrogen peroxide and peracetic acid are chlorine alternatives because they do not generate chlorinated disinfection byproducts. The presence of organic matter in the water decreases the sanitizing efficacy of hydrogen peroxide and peracetic acid. These products are corrosive, so you may need to buy specific injectors that these products won’t damage.
Read the product label to see the proper doses to select the proper range of the monitoring tools and specific information about the product. Some product formulations are approved by the OMRI for use in organic agriculture. Some formulations are registered as restricted use pesticides. Make sure to consult with your local Extension service about pesticide applicator licenses.
Both products are approved by the FDA to be used in water used to wash produce. Hydrogen peroxide concentrations should not exceed 59ppm (21 CFR 173.315(a)(5)). Peracetic acid concentrations should not exceed 80ppm (21 CFR 173.315(a)(5)).
Chemical injection calculations
How do you know how much sanitizer or product to add to the water to reach the desired concentration? In this section, we give examples on how to calculate how much sanitizer to use with or without injectors.
Making these calculations is easy and you only need to know the following equation and how to use it:
For the examples below, we will assume that we need a final concentration of chlorine dioxide (ClO2) of 2ppm and that the original concentration of the product is 2%.
Tip: The units for the concentration and volume must be same on both sides of the equation.
Batch solutions with no injector
Assume you need to make 10 liters of water with a concentration of 2ppm Chlorine Dioxide (ClO2). Usually, ClO2 comes in tablets and the manufacturer will provide instructions on how much water to dissolve the tablets in to reach a desired concentration. Assume that the ClO2 product gives a 2% product concentration when dissolved, according to the instructions. To convert to ppm from % we use the conversion ratio of 1%=10,000ppm. Also, remember that 1ppm is the same as saying 1mg dissolved in 1 liter of water (1mg/L). We can start listing our known variables from the previous equation.
- Ci: 20,000mg/L ClO2
- Cf: 2mg/L ClO2
- Vi: ?
- Vf: 10L
- Equation: 20,000mg/L x Vi = 2mg/L x 10L
In this case we do not know how much of the sanitizing product to add to water to reach the final concentration. We need to solve the equation for Vi, which is the right side of the equation divided by Ci.
Vi = (2mg/L x 10L) ÷ 20,000mg/L
Tip: always do the calculations inside the parenthesis first
Vi = 0.001L or 1mL
Add 1mL of the product to 9,999mL of water.
Proportioner injector set at 1:100
Proportioner injectors take solution from a concentrated stock tank and inject it into the irrigation system. In this example the proportioner is set to 1:100, meaning that a final solution made of 100 parts of which 1 part comes from the concentrated stock solution. This tells us that, in the equation, the final volume is 100 and the initial volume is 1. In this case we need to figure out two things:
- What is the concentration in the stock tank?
- How much product to dissolve to make the concentrated solution in the stock tank?
We make the calculations in two steps:
Step 1: Stock tank concentration
Input the variables in the equation:
- Ci: ?
- Cf: 2mg/L
- Vi: 1L
- Vf: 100L
- Equation: Ci x 1L = (2mg/L x 100L) ➞ Ci = (2mg/L x 100L) ÷ 1L ➞ Ci = 200mg/L
We know that the stock tank that will feed the injector needs a concentration of 200mg/L. The next step will tell us how to make the stock tank solution.
Step 2: Product to add to make the stock tank solution (assume that the stock tank has 10L)
Input the variables into the equation. Notice that this one is similar to the batch solution example discussed previously.
The size of your stock tank is your final solution, and you need to know how much of the product to add:
- Ci: 20,000mg/L
- Cf: 200mg/L (result from previous step)
- Vi: ?
- Vf: 10L (the stock tank volume)
- Equation: 20,000mg/L x Vi = (200mg/L x 10 L)➞ Vi = (200mg/L x 10 L) ÷ 20,000mg/L ➞ Vi = 0.1L or 100mL in 9.9L of water
Peristaltic or positive displacement pump
These types of injectors operate using a different principle than mechanical proportioners or venturi injectors. The peristaltic pump pushes concentrated stock solution into a pressurized system. The volume added in each injection stroke will vary depending on the pressure inside the pipes. Peristaltic pumps also have a rated limit on how many injection strokes they can do per minute, and some allow you to change this value. The manufacturer must provide documentation showing how much volume the pump injects per minute at different pressures. Also, it is recommended that you test and calibrate this value on your farm. To do so, have a known volume of stock solution, run the system and injector for 10 minutes, measure how much stock solution is used, and divide the used volume by 10 minutes. This will give you the injection rate per minute.
For this example, assume that your irrigation system has a flow rate of 10L per minute and 29psi. The pump’s documentation shows that the pump can deliver 0.56 to 7.92mL per minute (depending on the system’s pressure) and that it can do 120 injection strokes per minute. The pump injects water to a pressurized system and the higher the pressure the lower the volume it delivers. For this example, we will use the manufacturer charts (Figure 3).
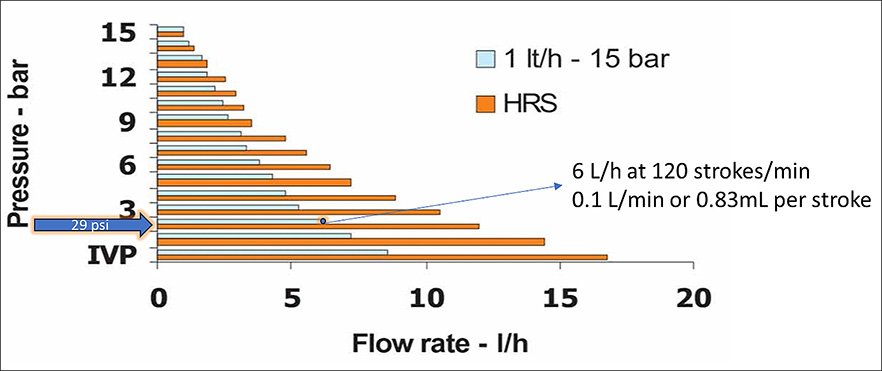
For this specific pump, at 29psi it delivers 6L per hour or 0.1L per minute. Now that we have collected information, we can make the calculations the same way we did with the proportioner injection.
Step 1: Stock tank concentration (assume a one minute run time)
Input the variables in the equation:
- Ci: ?
- Cf: 2mg/L
- Vi: 0.1L (from the pump manufacturer or the calibration step)
- Vf: 10L (from the system’s flow rate, the system’s flow rate is assumed to be 10L per minute)
- Equation: Ci x 0.1L = (2mg/L x 10L) ➞ Ci = (2mg/L x 10L) ÷ 0.1L ➞ Ci = 200mg/L
Step 2: Product to add to make the stock tank solution (assume a 10L stock tank volume)
- Ci: 20,000mg/L
- Cf: 200mg/L (result from previous step)
- Vi: ?
- Vf: 10L (the stock tank volume)
- Equation: 20,000mg/L x Vi = (200mg/L x 10L) ➞ Vi = (200mg/L x 10L) ÷ 20,000mg/L ➞ Vi = 0.1L or 100mL in 9.9L of water
Practical considerations and implementation strategies
Implementing effective water treatment strategies requires meticulous planning, regular monitoring, and adhering to regulatory requirements. Factors such as system maintenance, monitoring protocols, and safety considerations should be integral components of on-farm water management practices. Managing agricultural water may seem like a daunting task; please feel free to contact your local Extension educator if you need assistance.
Growers bear a huge responsibility in ensuring a safe food supply. Agricultural water management is just one aspect of preventing contamination of produce. Resources are available through university extension programs and the Produce Safety Alliance. For Missouri and Kansas check the Produce Safety Toolkit website for resources and updates.
1The use of brand names and/or any mention or listing of specific commercial products or services herein is solely for educational purposes and does not imply endorsement by University of Missouri or our partners, nor discrimination against similar brands, products or services not mentioned.
Funding for this publication was made possible by the U.S. Department of Agriculture’s (USDA) Agricultural Marketing Service through grant AM22SCBPMO1152. Its contents are solely the responsibility of the authors and do not necessarily represent the official views of USDA.