Editor's note
This publication has been updated with the 2024 survey results.
The U.S. Department of Agriculture (USDA) reports that 9.7 million acres of Missouri agricultural land was rented to farmers in 2022. To help both landowners and farmers make informed decisions about rental arrangements, the University of Missouri Extension periodically surveys landowners and farmers to explore trends in rental rates. The latest Missouri Cash Rental Rate Survey was conducted in June and July 2024.
Table 1 presents a summary of cropland and pastureland survey responses across the state by crop comparable to previous studies. There were an insufficient number of responses on organic-certified or transitioning ground to report values.
Table 1. Cash rent paid for Missouri crop and pastureland in 2023 and 2024.
| Land | Average rent paid in 2023 | Average rent paid in 2024 | 2024 1st to 3rd quartile | Expected 2024 yield/acre or carrying capacity | Number of responses |
|---|---|---|---|---|---|
| Cropland | |||||
| Dryland corn and soybean | 160 | 163 | 125 to 200 | 178 bushels corn 54 bushels soybean |
230 |
| Dryland wheat | 103 | 105 | 90 to 146 | 68 bushels | 8 |
| Dryland grain sorghum | 95 | 115 | 75 to 190 | 106 bushels | 3 |
| Mixed hay | 50 | 50 | 30 to 70 | 3 tons | 7 |
| Irrigated row crops | 212 | 218 | 201 to 244 | 222 bushels corn 1,300 pounds cotton |
7 |
| Pasture and grazing land | |||||
| Intensively managed pasture | 40 | 48 | 35 to 64 | Less than 2.5 acres per cow-calf pair per year | 32 |
| Good pasture | 36 | 40 | 30 to 58 | Less than 4 acres per cow-calf pair per year | 92 |
| Fair/poor pasture | 32 | 40 | 30 to 50 | 4 to 7 acres per cow-calf pair per year | 23 |
| Timber pasture | 30 | 30 | 8 to 45 | More than 7 acres per cow-calf pair per year | 4 |
Just over 600 Missouri landowners and tenants responded to an online and paper survey, with a majority of responses provided online. Just over half of responses (52%) came from landowners. Across rental categories for cropland, pastureland, hunting ground and farm facilities, there were 477 usable responses; Table 1 outlines the number of responses by category. The average consecutive lease tenure was 11 years, and 70% of leases were five years or longer. Nearly one-third of respondents indicated they renegotiate their lease annually.
The number and variability of responses prevents hard conclusions about rental rates in Missouri. Averaging rental rates across the state also discards local factors that impact rental rates. For 2024, enough valid responses to cropland markets made it possible to provide regional analysis; it is assumed that higher land productivity (yield or production) correlates with higher rental rates, therefore, a comparison to crop yield is provided. However, other factors outside productivity affect rental rates, making a hard rule regarding fair market value impossible to establish. These factors include the acres available for rent in a location, the number of farmers seeking to rent land for cash, productivity of the land, size of the parcel, production costs and market prices.
This guide should be used as one piece of information and should not be the sole basis for determining rental rates.
Missouri cash rental rates for land
Cash lease agreements are common for Missouri cropland and pastureland. This summary can be used as a reference point for determining appropriate cash rental rates for a particular field. The following may justify higher or lower than average rent in specific cases: small size or unusual shape of fields, terraces or creeks that impact planting, restricted field access, high or low fertility levels, USDA program variables (such as crop base acres and assigned yields) and land certifications.
The 2024 Missouri Cash Rental Rate Survey asked respondents to report the cash rent paid or received in 2023 and 2024, along with crops grown and experienced/expected yields for both years. Although Missouri has a diverse mixture of crops, most responses were for a rotation of corn and soybeans. The rental rate for dryland corn and soybeans was $163 per acre in 2024, up nearly 2% from the same fields in 2023 and up 11% since the 2021 Missouri Cash Rental Rate Survey was conducted. Respondents reported an average cash rental rate for dryland wheat at $115 per acre, dryland grain sorghum at $115 per acre and mixed hay at $50 per acre; mixed hay might have been adversely impacted by drought conditions experienced across Missouri in 2023. Crops like cotton, rice and peanuts are specific to southeast Missouri due to their unique growing conditions. Responses from this region were for irrigated row crops—the rental rate for these crops was reported at $218 per acre, $55 per acre higher than dryland corn and soybeans.
The 2024 Missouri Cash Rental Rate Survey also asked about rental rates for pasture and grazing lands used in livestock production. Respondents answered questions that corresponded to the expected carrying capacity. Intensively managed pasture, which is estimated to support a cow-calf pair on less than 2.5 acres, had a rental rate of $48 per acre. Good pasture, which is estimated to support a cow-calf pair on less than four acres, had a rental rate of $40 per acre. Fair and poor pasture, which uses four to seven acres per cow-calf pair had a rental rate $40 per acre. Timber pasture, which requires more than seven acres per cow-calf pair is estimated at $30 per acre.
Table 2 reports the results of previous Missouri Cash Rental Rate Surveys. Earlier surveys asked questions specifically for corn ground and soybean ground. This year, the two were recognized as growing on the same ground and have been reported together on the last three surveys conducted by MU Extension. Across all field crops, rental rates rose in 2023 and 2024, partially explained by relatively high crop prices and government payments. Conversely, rental rates for pastureland showed very little growth the last five years, possibly due to relatively high feed costs and intense drought throughout Missouri in 2022 and 2023.
Table 2. Multiyear comparison of Missouri cash rental rates.
| Type of land | Average rates per acre per year | |||||||||
|---|---|---|---|---|---|---|---|---|---|---|
| 2010 | 2011 | 2014 | 2015 | 2017 | 2018 | 2020 | 2021 | 2023 | 2024 | |
| Cropland | ||||||||||
| Dryland corn and soybean | 141 | 147 | 144 | 147 | 160 | 163 | ||||
| Corn | 112 | 122 | 147 | 146 | ||||||
| Soybean | 106 | 114 | 144 | 149 | ||||||
| Wheat | 83 | 69 | 95 | 92 | 127 | 123 | 106 | 114 | 103 | 115 |
| Grain sorghum | 95 | 115 | ||||||||
| Irrigated row-crops | 200 | 196 | 196 | 212 | 218 | |||||
| Cotton | 177 | 193 | ||||||||
| Rice | 179 | 180 | 204 | 204 | ||||||
| Hay | 31 | 33 | 31 | 32 | 37 | 37 | 50 | 50 | ||
| Pastureland and grazing land | ||||||||||
| Intensively managed pasture | 40 | 48 | ||||||||
| Good pasture | 30 | 31 | 36 | 38 | 41 | 41 | 40 | 40 | 36 | 40 |
| Fair/poor pasture | 24 | 24 | 30 | 31 | 31 | 32 | 35 | 34 | 32 | 40 |
| Timber pasture | 16 | 17 | 18 | 18 | 28 | 28 | 30 | 30 | ||
Cash rental rates tend to follow land values on a one- or two-year lag. The USDA National Agricultural Statistics Service (NASS) reported in August 2024 that Missouri agricultural land values had increased 28% since 2021. Rental rates have increased in Missouri, but not at the same pace as land values, which 2024 USDA and MU Extension data indicate based upon recent surveys. Based on trends observed, this may lead to higher land rental rates in 2025. For this reason, historical land rental rates published in this guide might underestimate rental rates likely to prevail in 2024 and beyond. Additionally, declining crop prices and the probability of negative cash flows in 2024 and 2025 offset upward pressure to cash rental rates due to higher land prices.
Generally, higher yield land is expected to demand a higher rental rate than lower yield land. Table 8 summarizes corn and soybean historical crop insurance yield averages reported by the USDA Risk Management Agency (RMA) and 2023 rental rates provided by USDA NASS.
Regional cash rental rates
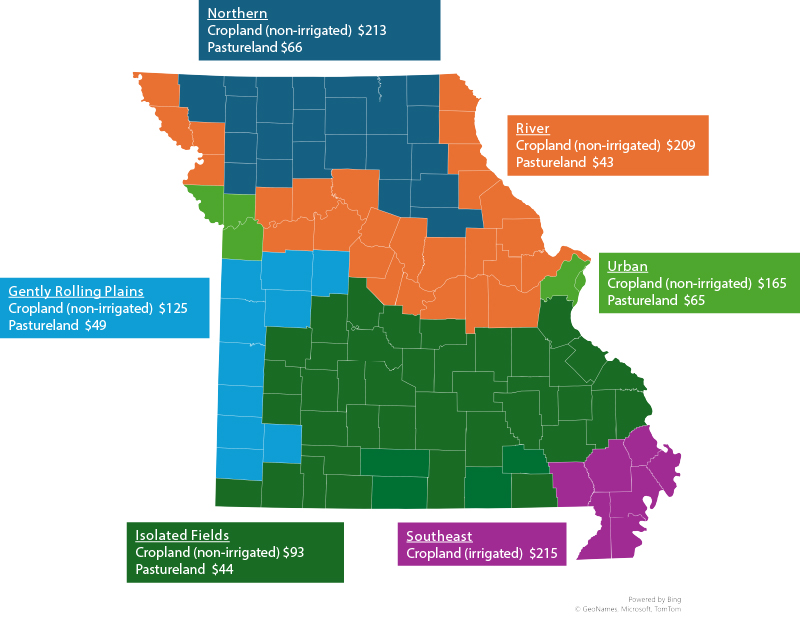
Missouri topography, mix of crop and livestock enterprises, urban development opportunities and access to either the Missouri or Mississippi Rivers are assumed to affect cash rental rates. There were not enough responses to the 2024 survey to break out an impact factor for each characteristic. However, using economic relationships and topographical maps from the Missouri Department of Natural Resources, a breakdown of Missouri rental rates is calculated by region. These regions include Northern, River, Urban, Gently Rolling Plains, Isolated Plains and Southeast as illustrated in Figure 1. Irrigated cropland rates are provided for only the Southeast region, although there is known irrigation in other regions.
Going versus average rental rates
The rates provided by USDA NASS and MU Extension are considered average rental rates. One limitation of average rental rates is that they include lease agreements of all tenures. Historically, there has been a gradual increase in average rental rates (see Table 2), indicating that leases negotiated more recently have a higher relative value than leases with more longevity. Rental rates negotiated at a particular point in time are considered the “going” rental rate. The 2024 Missouri Cash Rental Rate Survey does not differentiate between going and average rates but did ask respondents when the lease was last renegotiated. Determining the current lease tenure can indicate the relationship between average and going rental rates. Unfortunately, there were not enough responses to the negotiation question in the 2024 survey to provide estimates.
Table 3. The relationship between average crop yield and annual rental rate in 2024.
|
Missouri rental rate |
Expected corn yield (bushels per acre) |
Expected soybean yield (bushels per acre) |
||
|---|---|---|---|---|
|
Average |
Range |
Average |
Range |
|
|
Less than 100 |
157 |
125 to 200 |
48 |
35 to 60 |
|
101 to 125 |
157 |
120 to 175 |
49 |
40 to 60 |
|
126 to 150 |
172 |
125 to 225 |
53 |
40 to 70 |
|
151 to 175 |
175 |
150 to 200 |
57 |
45 to 60 |
|
176 to 200 |
194 |
175 to 230 |
58 |
45 to 70 |
|
Greater than 200 |
203 |
165 to 285 |
58 |
50 to 75 |
|
Dollars per bushel by Missouri region |
||||
|
Gently Rolling Plains |
1.06 |
0.83 to 1.40 |
2.40 |
1.43 to 3.47 |
|
Isolated Fields |
0.79 |
0.60 to 1.20 |
3.24 |
0.56 to 4.90 |
|
Northern |
0.96 |
0.46 to 1.20 |
2.90 |
1.43 to 3.75 |
|
River |
0.98 |
0.46 to 1.05 |
3.97 |
1.00 to 4.40 |
|
Southeast (irrigated crops only) |
1.04 |
0.97 to 1.13 |
2.88 |
2.40 to 3.47 |
|
Urban |
0.80 |
0.62 to 0.93 |
3.35 |
3.08 to 3.70 |
Missouri livestock leases
Most Missouri livestock producers rent pastureland under a cash rent agreement by paying a set dollar amount per acre; however, there are leases in Missouri where tenants will pay landowners on a dollar per livestock unit per month arrangement. These leasing arrangements are primarily found in northern Missouri. The 2024 Missouri Cash Rental Rate Survey asked questions regarding cash rental rates per livestock unit—see Table 4 for a summary of these values. Livestock units rented on share agreements are summarized in MU Extension publication G424 Crop-Share Leases in Missouri.
Table 4. Missouri cash rental rates per livestock unit.
|
Enterprise |
Unit |
Average rent paid in 2023 per month |
Average rent paid in 2024 per month |
2024 |
Average stocking rate (acres per unit) |
Number of responses |
|---|---|---|---|---|---|---|
|
Replacement heifers |
head |
28 |
31 |
25 to 40 |
5 acres |
8 |
|
Yearling |
head |
35 |
42 |
25 to 75 |
4 acres |
12 |
|
Cow-calf |
pair |
29 |
31 |
7 to 55 |
4 acres |
17 |
Missouri hunting rental rates
Because of its lakes, streams and woodlands, Missouri is nationally known for hunting. In 2024, there were 38 valid responses regarding hunting leases across 29 Missouri counties, primarily in northern and western counties. Table 5 summarizes hunting lease rates on a per acre and per hunter basis. There are many factors that go into determining a hunting rental rate, including the types of animals approved to hunt, share of woodland to clearing, available food source, migration paths and number of approved hunters. Of the reported leases, more than 90% included provisions for more than one hunter, and four to five hunters were the most common to be in a leasing arrangement. For a more detailed description of hunting leases, see MU Extension publication G9420 Landowners’ Guide to Lease Hunting in Missouri.
Across all responses, hunting rental rates increased 6% from 2023, corresponding with historical growth rates found in previous surveys. All responses indicated flat or increased rental rates year over year, with a range of 0% to 40%.
Table 5. Missouri rental rates for hunting.
|
Type of lease |
Average rent paid in 2023 |
Average rent paid in 2024 |
2024 |
Average acres per lease |
Number of responses |
|---|---|---|---|---|---|
| Dollars per year per acre | |||||
|
Any wildlife |
19.70 |
21.45 |
15 to 30 |
527 |
11 |
|
Deer and turkey |
20.00 |
23.33 |
20 to 25 |
346 |
3 |
|
Deer only |
23.33 |
23.33 |
15 to 40 |
589 |
3 |
| Dollars per year per hunter | |||||
|
Any wildlife |
1,593 |
1,667 |
900 to 2,850 |
400 |
6 |
|
Deer and turkey |
1,428 |
1,480 |
556 to 1,498 |
318 |
10 |
|
Deer only |
1,163 |
1,181 |
431 to 2,187 |
312 |
4 |
|
Fowl |
2,500 |
2,500 |
NA |
20 |
1 |
Farm building and facility rental rates
Farm buildings and facilities often outlast the builder’s needs, but can still provide a usable service; on the other hand, farm operators and livestock producers may have need for facilities but are unable to invest in new infrastructure. In this situation, both parties can benefit from a leasing arrangement for the facilities. Information about rental rates for farm buildings is sparse and often has a range of attributes like age, condition, size, location and material used for the facility. The 2024 Missouri Cash Rental Rate Survey asked landowners and tenants information about leases of farm buildings and facilities; results are summarized in Table 6. The survey assumed that building tenants would provide labor and management and cover the cost of utilities, while the owner is assumed to be responsible for upkeep of the facilities, major repairs and insurance coverage.
For more information about determining rental rates and terms for buildings and facilities, see publication NCFMEC-04 Rental Agreements for Farm Buildings and Livestock Facilities. A sample lease form is available in publication NCFMEC-04A Farm Building or Livestock Facility Lease. Both are available for free at Ag Lease 101.
Table 6. Farm building and facilities rental rates.
|
Type of facility |
Unit on which rent is paid |
Average rent paid in 2023 |
Average rent paid in 2024 |
2024 |
Average building capacity |
Number of responses |
|---|---|---|---|---|---|---|
|
Rural housing |
||||||
|
House on farm |
Dollars per month |
475 |
483 |
-------- |
1,500 square feet |
1 |
|
Grain storage |
||||||
|
Grain bin, all |
Dollars per bushel per month |
0.06 |
0.06 |
0.02 to 0.10 |
42,900 bushels |
10 |
|
Under 10,000 bushels |
Dollars per bushel per month |
0.02 |
0.02 |
0.01 to 0.03 |
7,500 bushels |
4 |
|
Over 10,000 bushels |
Dollars per bushel per month |
0.09 |
0.09 |
0.04 to 0.14 |
66,500 bushels |
6 |
|
Other facility |
||||||
|
Livestock barn |
Dollars per square foot per year |
0.38 |
0.45 |
0.38 to 0.50 |
2,675 square feet |
4 |
|
Machine storage |
Dollars per square foot per year |
0.57 |
0.57 |
0.18 to 0.96 |
4,400 square feet |
8 |
Cash rental agreement considerations
Multiple types of rental agreements exist for tenants and landowners. In a fixed cash rental agreement for crop production, a tenant pays a landowner a fixed amount of money per acre, and no share of production or nonmonetary payment is exchanged; see the sidebar for advantages and disadvantages of cash rental agreements. Conversely, crop-share leases compensate the landowner for the use of their land by sharing the output; more information regarding crop share agreements is reported in MU Extension guide G424 Crop-Share Leases in Missouri. Flexible cash lease agreements are another type of rental arrangement, where the tenant typically pays for all costs with raising crops and livestock on leased land, while the landowner pays for improvements expected to endure beyond the period of the lease and all expenses related to property ownership; this rental agreement is unique in that it accounts for changes in prices and yields. More information on flexible cash lease arrangements is available in MU Extension guide G422 Flexible Cash Leases in Missouri.
Cash rental agreements increase the risk to the tenant. A variable or flexible cash rental agreement based on yield, prices or both can help distribute risk and income between both tenant and landowner. If a variable or flexible cash rental agreement is used, it is suggested that the proposed agreement be reviewed by the USDA Farm Service Agency office for clarification of its impact on program participation and payments.
When asked about rental payments, roughly half of respondents reported they paid the full amount due in a single month; the most frequent single-month payments were in March and December. The remaining respondents indicated they split payment into two or three tranches. March with November, followed by March with October were the two most frequent combinations. Only 5% of producers indicated they make rental payments three or more times per year.
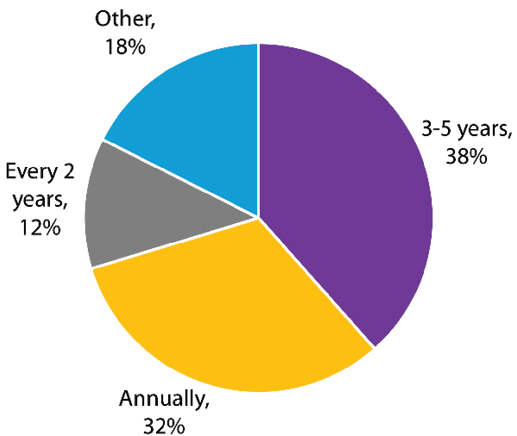
Nearly one-third of respondents indicated that they renegotiate their lease annually, while 12% renegotiate every two years and 38% renegotiate every three to five years. Notably, 18% of respondents reported that their lease has not been renegotiated or is done ad hoc at the request of one party; the breakdown in frequency of leasing negotiations can be found in Figure 2.
Regardless of leasing arrangement and repayment timing, it is recommended that leases be written with clear terms and restrictions (see examples on the Ag Lease 101). All cash leases should specify the amount of rent due, the time and method of payment and the duration of the lease. It is common for cash lease agreements to contain restrictions on use, such as crops grown, required fertility and maintenance of roadways or fence, while pasture or livestock leases may specify a maximum stocking rate. Storage facilities may specify the type of crop to be stored and payment of utilities.
In the 2024 Missouri Cash Rental Rate Survey, 174 respondents shared characteristics of their leasing arrangements (see Table 7). Of this group, 78% indicated that they were not required to share yield data with the landowner under a cash rental lease. Of those same respondents, 70% reported they were not required to maintain minimum fertilizer levels. For the 30% of respondents required to maintain minimum levels of fertilizer, it was most common to have minimums set for pH levels, phosphorus and potassium.
Table 7. Missouri cash rental rate survey lease characteristics in 2024.
| Response |
Tenant is required to share yield data with the landowner |
Tenant is required to maintain minimum fertilizer levels |
|---|---|---|
|
Yes |
22% |
30% |
|
No |
78% |
70% |
|
Total responses |
174 |
174 |
Advantages (+) and disadvantages (–) of cash rental agreements
The tenant
+ Is relatively free to make management decisions.
+ Receives all profit resulting from higher yields or higher commodity prices.
+ May enroll in government safety net programs and receive the entire payment.
– Has increased risk, because rent is fixed regardless of production or profit.
– Can have large capital requirements for production expenses.
– Can have rent raised for doing a good job as the landowner sees profit being obtained with his or her property.
The landowner
+ Is assured of a specific level of income.
+ Is not required to commit cash in the production process.
+ Has no worries about storing or marketing crops.
– Does not receive as much money as in a crop share arrangement during good years.
– May worry that the tenant will not maintain the property.
– Has small chance to do income tax management.
Additional resources
For information on other types of rental arrangements and lease forms, contact your regional agricultural business specialist (PDF) find your local specialist here. Additional information and forms are also available at Ag Lease 101, a website created by the North Central Farm Management Extension Committee.