The number of days available to complete fieldwork influences decisions about inputs, such as variety or hybrid planted, pesticide used and machinery choices. The limited fieldwork days available for completing crucial tasks — such as tillage, planting, spraying and harvest — require careful management.
Large farm machinery will complete fieldwork quickly but can increase ownership costs. Smaller machinery may have lower ownership costs but may also delay some key activities that affect productivity. The size of machinery needed to efficiently complete the necessary activities depends on how many days the machinery can actually be used in the field.
The United States Department of Agriculture (USDA) National Agricultural Statistics Service (NASS) reports the number of days each week that soil and moisture conditions are suitable for fieldwork, beginning in early April. This start date leaves a gap in fieldwork days data when important field operations such as fertilizer application and some early planting occur.
Average number of days suitable for fieldwork
Figure 1 shows the distribution of fieldwork days for the periods of April 1 through June 10 and Sept. 1 through Oct. 31. To use the graph, select the number of days that you would like to have available for fieldwork and draw a straight line up. From where your line intersects either the April 1–June 10 or Sept. 1–Oct. 31 plot, draw a straight line left to the probability axis. The result is the percentage of time that you could expect the desired number of fieldwork days to be available. For example, 35 fieldwork days or more occur about 60% during the April 1–June 10 period, which means that 40% of the time less than 35 fieldwork days are available.
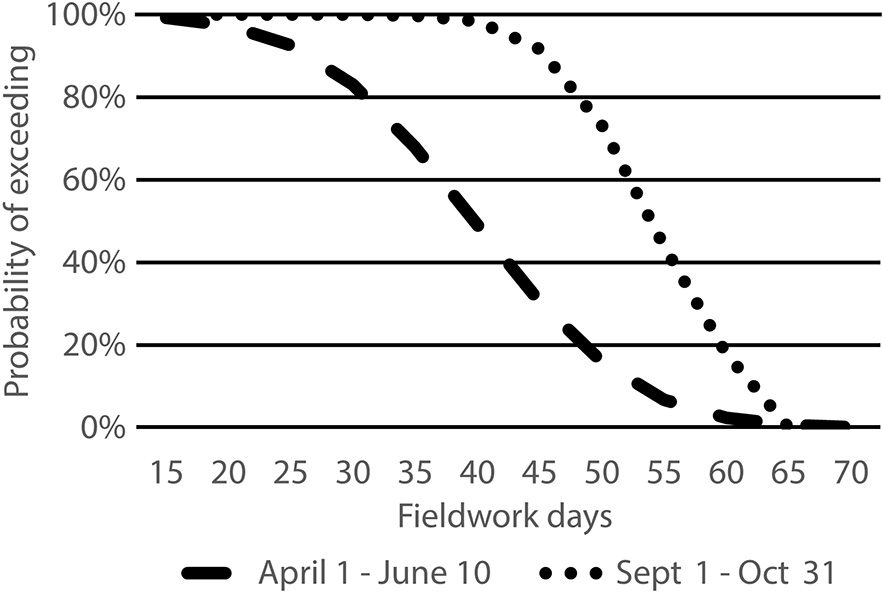
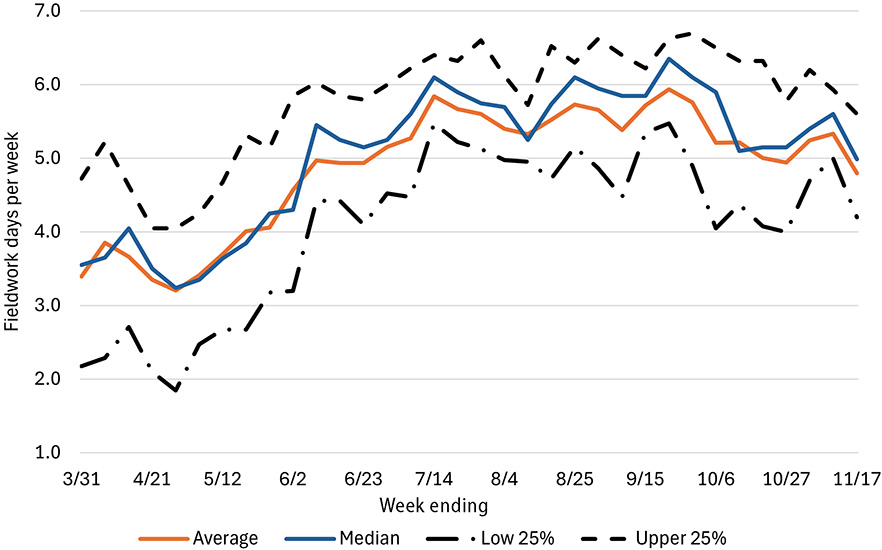
Table 1 summarizes the average number of weekly fieldwork days from 2005 to 2024, and Figure 2 shows this data graphically. The actual number of suitable fieldwork days varies considerably from year to year. Estimates are for seven-day workweeks. If fieldwork will not be done every day of the week, adjust the data by multiplying by the fraction of the week that will be worked, such as 6⁄7 or 0.857 for a six-day workweek.
Table 1. Number of days per week for fieldwork in Missouri.
| Week ending | Low quartile1 | Upper quartile2 | Median3 | Average |
|---|---|---|---|---|
| March 31 | 1.9 | 4.1 | 3.0 | 3.0 |
| April 7 | 2.2 | 4.7 | 3.6 | 3.4 |
| April 14 | 2.3 | 5.2 | 3.7 | 3.9 |
| April 21 | 2.7 | 4.6 | 4.1 | 3.7 |
| April 28 | 2.1 | 4.1 | 3.5 | 3.4 |
| May 5 | 1.9 | 4.1 | 3.2 | 3.2 |
| May 12 | 2.5 | 4.3 | 3.4 | 3.4 |
| May 19 | 2.7 | 4.7 | 3.6 | 3.7 |
| May 26 | 2.7 | 5.3 | 3.9 | 4.0 |
| June 2 | 3.2 | 5.1 | 4.3 | 4.1 |
| June 9 | 3.2 | 5.9 | 4.3 | 4.6 |
| June 16 | 4.4 | 6.0 | 5.5 | 5.0 |
| June 23 | 4.4 | 5.9 | 5.3 | 4.9 |
| June 30 | 4.1 | 5.8 | 5.2 | 4.9 |
| July 7 | 4.5 | 6.0 | 5.3 | 5.2 |
| July 14 | 4.5 | 6.2 | 5.6 | 5.3 |
| July 21 | 5.5 | 6.4 | 6.1 | 5.8 |
| July 28 | 5.2 | 6.3 | 5.9 | 5.7 |
| Aug. 4 | 5.1 | 6.3 | 5.8 | 5.6 |
| Aug. 11 | 5.0 | 6.1 | 5.7 | 5.4 |
| Aug. 18 | 5.0 | 5.7 | 5.3 | 5.3 |
| Aug. 25 | 4.7 | 6.5 | 5.7 | 5.5 |
| Sept. 1 | 5.2 | 6.3 | 6.1 | 5.7 |
| Sept. 8 | 4.9 | 6.6 | 6.0 | 5.7 |
| Sept. 15 | 4.5 | 6.4 | 5.9 | 5.4 |
| Sept. 22 | 5.4 | 6.2 | 5.9 | 5.7 |
| Sept. 29 | 5.5 | 6.6 | 6.4 | 5.9 |
| Oct. 6 | 4.9 | 6.7 | 6.1 | 5.8 |
| Oct. 13 | 4.1 | 6.5 | 5.9 | 5.2 |
| Oct. 20 | 4.4 | 6.3 | 5.1 | 5.2 |
| Oct. 27 | 4.1 | 6.3 | 5.2 | 5.0 |
| Nov. 3 | 4.0 | 5.8 | 5.2 | 4.9 |
| Nov. 10 | 4.7 | 6.2 | 5.4 | 5.2 |
| Nov. 17 | 5.0 | 5.9 | 5.6 | 5.3 |
| Nov. 24 | 4.2 | 5.6 | 5.0 | 4.8 |
|
Note: Data is based on the average number of weekly fieldwork days in the years 2005 to 2024.
|
||||
Calculating machinery needs
After finding the average number of fieldwork days available, compute the minimum necessary daily machinery capacity using these formulas:
- acres worked per day = acres ÷ days suitable for fieldwork
- acres worked per hour = acres per day ÷ working hours per day
For example, during the three-week period from April 8 to April 28, you can expect 11 days suitable for fieldwork: 3.9 + 3.7 + 3.4 days (from Table 1) If you have 2,000 acres of corn and soybeans to plant, to finish within three weeks under average circumstances you need to be able to plant 182 acres per day: 2,000 acres ÷ 11 days. If the planter operates 12 hours per day, it needs to be large enough to plant an average of 15.2 acres an hour: 182 acres ÷ 12 hours. Be sure to consider the additional time required to refill, adjust, reposition or maintain machinery when calculating the time needed to complete field activities.
Because this data represents annual averages, the above example assumes a completion rate of about 50%. This means that in about half the years, less than 2,000 acres will be planted in the three-week period when planting at 15.2 acres an hour. This level of risk may not be acceptable to all operators.
To better estimate the equipment needed, consider the low and high quartiles in Table 1. The low quartile represents the fieldwork days for a given week that will be exceeded in three out of four years, on average. In that scenario, you would only have 7.1 days to plant 2,000 acres of corn and soybeans. With the planter operating 12 hours a day, it must cover 23.5 acres per hour to finish. Alternatively, there is an equal likelihood of having more than 13.9 days to complete fieldwork, which would require only 12 acres to be covered every hour.
Calculating field capacity of farm machinery
To determine the acreage you can cover in a hour, otherwise known as field capacity, three pieces of information are needed: the implement working width in feet, operating speed in miles per hour, and field efficiency as a percentage of time spent with the implement engaged in its designated purpose. Calculate field capacity using this formula:
- operating speed × 5,280 (feet per mile) = distance (feet) traveled per hour
- distance traveled per hour × working width = square feet covered per hour
- square feet covered per hour ÷ by 43,560 (square feet per acre) = theoretical acres covered per hour
- theoretical acres covered per hour × field efficiency = field capacity
For example, field capacity for the same 40-foot-wide planter as in the previous example, traveling at 6 miles per hour with a field efficiency of 80% would be calculated as follows:
- 6 miles per hour × 5,280 feet per mile = 31,680 feet traveled per hour
- 31,680 feet traveled × 40-foot working width = 1.27 million square feet covered per hour
- 1.27 million square feet ÷ 43,560 square feet per acre = 29.1 acres covered per hour, theoretically
- 29.1 acres per hour × 80% field efficiency = 23.3 acres per hour field capacity
Machinery cost implications
The main way to reduce the amount of time required to complete field operations is to invest in larger or more efficient machinery. Larger machinery reduces the risk of losses due to lack of timeliness, but it also requires more capital investment and can result in higher machinery ownership costs — including depreciation, storage costs, some portion of repair costs (batteries, hoses and other components that degrade over time) and overhead costs. The equipment spreadsheet in the Missouri Crop Budget Tool (XLSX) can provide more information about the ownership cost implications of increasing equipment size.
Split-applied nitrogen tool
An online interactive tool called Corn Split Nitrogen is accessible from the Decision Dashboard section of the Useful to Usable (U2U) project’s website. This tool combines the fieldwork days data with a corn growth model and weather information to estimate the probability of successfully implementing a post-planting nitrogen application for corn production.
For more information
Edwards, William. 2017. Farm Machinery Selection. Ag Decision Maker File A3-28. Iowa State University.
Hanna, Mark. 2016. Estimating Field Capacity of Farm Machines. Ag Decision Maker File A3-24. Iowa State University.