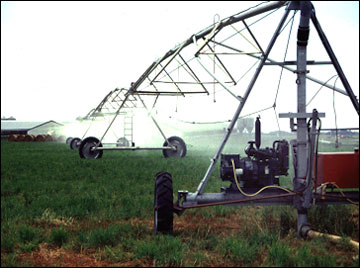
 Center-pivot irrigation system for applying liquid manure.
Manure typically is used as a fertilizer for crop production. This guide details the calculations needed to determine the fertilizer nitrogen value of manure, termed "plant-available nitrogen" (PAN). The guide also details "residual nitrogen fertilizer value" (RNFV), which is a method used to determine the amount of nitrogen released by manure in the year after application. There are also examples of incorporating an estimate of plant-available nitrogen and residual nitrogen value into a manure application recommendation for a crop.
These calculations can be complicated when done by hand. A companion Web page to this guide provides tools to make these calculations. The software package Manure Management Planner (MMP) from Purdue University also calculates manure application rates based on Missouri plant-available nitrogen recommendations. Links to both the PAN Web page and the MMP software can be found online at nmplanner.missouri.edu.
Manure versus other nitrogen sources
Most commercial nitrogen fertilizers are 100 percent plant available when applied to the soil. Fertilizers such as ammonium nitrate, anhydrous ammonia, urea and ammonium sulfate are in a form that is completely available to a plant or convert rapidly to a form usable by the plant when soils have sufficient warmth and moisture for crop growth.
Manure contains both organic nitrogen and mineral forms of nitrogen. The organic nitrogen is an integral component of cells in organic material in the manure. Plants cannot directly use organic nitrogen. Instead, plants rely on microbes in the soil to break down the organic nitrogen and release it into the soil in a mineral form plants can use. This process is called mineralization. One challenge of using manure as a fertilizer is predicting the amount of organic nitrogen that will be released to soil as mineral nitrogen and the rate it will be released.
The mineral nitrogen in manure also poses unique challenges. Mineral nitrogen in most manure sources is in the ammonium form at the time of land application. Most manure sources also have a relatively high pH. This combination of high pH coupled with an ammonium nitrogen source can lead to significant ammonia volatilization when manure is surface-applied to soil. These losses of nitrogen can significantly reduce the fertilizer value of surface-applied manure.
Nitrogen losses occur from any source of nitrogen fertilizer. For detailed information on best management practices for minimizing nitrogen losses from any nitrogen application see the MU publications G9218, Managing Nitrogen to Protect Water Quality, and IPM1027, Best Management Practices for Nitrogen Fertilizer in Missouri.
This guide focuses on the unique challenges of managing manure as a nitrogen source and calculating the nitrogen fertilizer value of manure.
Background on factors affecting nitrogen availability in manure
Table 1
Organic nitrogen availability factors (k1).
| Year | Liquid storages, except poultry | Dry storages, no bedding, except poultry | Dry storages, with bedding, except poultry | All poultry |
|---|---|---|---|---|
| Year 1 (k1(Y1)) | 0.39 | 0.39 | 0.29 | 0.62 |
| Year 2 (k1(Y2)) | 0.23 | 0.23 | 0.16 | 0.13 |
| Total (k1(T)) | 0.62 | 0.62 | 0.45 | 0.75 |
Nitrogen availability from organic nitrogen
Mineralization is the conversion of organic nitrogen into mineral forms that are available to crops. Long-term research has shown that nitrogen release from the organic nitrogen in manure takes place over years and some of the organic nitrogen is never released to plants. Most of the organic nitrogen is released in the growing season following application and the amount of nitrogen released beyond two years after application is relatively small. In Missouri, the residual fertilizer value of organic nitrogen requires tracking manure fertilizer contributions for two years.
Table 1 summarizes estimates of nitrogen availability for organic nitrogen in manure.
- Year-one availability (k1(Y1)) predicts the fraction of organic nitrogen available as fertilizer in the first growing season after application. This factor is used in calculating the fertilizer nitrogen value of manure in the PAN equation.
- Year-two availability (k1(Y2)) predicts the fraction of organic nitrogen available as fertilizer in the second growing season after application. This factor is used in calculations adjusting nitrogen recommendations in the year after manure application to account for residual nitrogen generated from organic nitrogen in the manure.
- Total availability (k1(T)) is the sum of year-one and year-two availability and represents the fraction of the organic nitrogen that is accessible to growing plants. In all manure types the fraction of total available organic nitrogen is less than 1.
Mineralization is a biological process so it is affected by environmental conditions in the soil. Cold, excessively wet, or excessively dry soils all inhibit microbial activity, delaying availability of organic nitrogen in manure. Organic nitrogen availability factors estimate expected release of nitrogen but the timing and quantity released in a given year will vary based on local conditions. Not all organic nitrogen is equally available to plants. This can be seen in the differences in Table 1 based on manure type and storage method. Manure treatment processes that change the characteristics of manure organic matter may increase or reduce the availability of organic nitrogen. We are currently unable to predict year-to-year variation or all the impacts of storage and handling on organic nitrogen availability.
Nitrogen availability from ammonium nitrogen
Manure in storage facilities typically lacks free oxygen. High rates of biological activity in liquid storages, dry manure stacks, and compost piles exceed the rate of oxygen supply creating anaerobic conditions. Under these conditions all mineral nitrogen in the storage is converted to the ammonium form (NH4+). Nitrate nitrogen (NO3-) is unable to persist and is driven down to negligible levels.
Ammonium nitrogen in the manure is susceptible to losses by ammonia volatilization when manure is surface-applied. Timely incorporation of manure into the soil reduces ammonia volatilization.
Volatilization losses from surface-applied manure are highly variable. A review of 15 field experiments documented ammonia losses from surface-applied, unincorporated manure ranging from 10 to 99 percent of applied ammonium. The mean loss was 47 percent of the applied ammonium nitrogen. Losses tended to be more variable at low application rates.
Predicting nitrogen losses from ammonia volatilization is difficult. Many factors affect the rate of nitrogen loss and the total ammonia loss after surface application of manure.
- Conditions that promote water evaporation are similar to conditions that promote ammonia volatilization. Consequently surface manure applications during warm, windy conditions increase the rate of ammonia volatilization.
- Applications under cool conditions reduce the rate of volatilization but with time losses under cool conditions can match losses in hot, dry conditions.
- Application strategies that promote contact of manure with the soil reduce volatilization losses.
- Low rates of manure that coat plants and plant residues with a thin layer of manure increase ammonia losses.
- Higher application rates can lower losses by forcing more manure into contact with the soil and creating a thicker layer of manure inhibiting ammonia loss.
- Ammonia losses are most rapid at the time of application dropping rapidly with time. In dry conditions, another flush of ammonia loss can be initiated by rewetting the manure.
Ammonia losses from surface applications are chemically mediated reactions. The driving force in ammonia loss is high pH. Most manure has a near- or above-neutral pH, promoting ammonia loss. Initially, the chemistry of the manure controls rates of ammonia loss from manure. With time the loss of ammonia and the reaction of manure with soil drives down pH to a level that prevents further ammonia loss.
When manure is injected into the soil or immediately incorporated after application, ammonium in the manure reacts with the soil and is not prone to ammonia losses. Under these conditions, ammonium nitrogen from manure is equivalent to any other mineral nitrogen source. To avoid uncertainty in the availability of ammonium nitrogen in manure, inject manure into soil or incorporate manure immediately after application.
Nitrate is rarely a significant component of manure from conventional manure handling systems. Consequently, there typically is no reason to test for nitrate in manure. If a unique manure storage system sustains significant amounts of nitrate it will be 100 percent plant available with surface application, injection, or incorporation.
Table 2
Inorganic nitrogen availability factors (k2).
| Form of inorganic N | Injection | Partial (~40 percent) injection | Surface application Days to incorporation |
|||
|---|---|---|---|---|---|---|
| <0.2 | 0.2 to 1.0 | >1.0 to 3.0 | >3* | |||
| Ammonium N (k2(NH4)) | 0.95 | 0.70 | 0.90 | 0.75 | 0.60 | 0.50 |
| Nitrate N (k2(NO3)) | 1.0 | 1.0 | 1.0 | 1.0 | 1.0 | 1.0 |
*More than 3 days or no incorporation
Table 2 summarizes estimates of nitrogen availability for mineral nitrogen in manure.
- Ammonium availability (k2(NH4)) predicts the fraction of ammonium nitrogen available as fertilizer in the year of application. This factor is used in calculating the fertilizer nitrogen value of manure in the PAN equation.
- Nitrate availability (k2(NO3)) predicts the fraction of nitrate nitrogen available as fertilizer in the year of application. Typically, nitrate concentrations in manure can be assumed to be zero and this factor is not needed when using the PAN equation.
In many software packages and web-based applications placement of the manure is established through the selection of manure application equipment. Table 3 associates the choices for manure application equipment used in MMP and the PAN website with placement of manure.
There is no expectation of residual effects with inorganic nitrogen sources in the years after application, so there is no residual availability factor as there is with organic nitrogen.
Calculating plant-available nitrogen (PAN) in manure
There are four steps to estimating nitrogen availability in manure:
- Obtain a relevant estimate of organic and ammonium nitrogen in the manure.
- Convert the manure test results into the desired units.
- Calculate the plant-available nitrogen (PAN) released by the manure in the growing season associated with manure application.
- Calculate the residual nitrogen fertilizer value (RNFV) released in the second growing season after manure application.
1. Obtaining a relevant estimate of nutrient concentrations in manure
Manure testing is the most accepted way to estimate nutrient concentrations in manure. The following analyses are needed to estimate plant-available nitrogen:
- Total or total Kjeldahl nitrogen (TKN)
- Ammonium or ammonia nitrogen
- Percemt of dry matter, percent of solids or percent of moisture (only needed if results are not on an "as-is" basis).
Manure samples should also be analyzed for total phosphorus and total potassium. If you are concerned about salt content of your manure request an electrical conductivity analysis.
In almost all manure storage systems, no analysis for nitrate nitrogen is needed. Manure storage systems like anaerobic lagoons, slurry pits, litter packs and manure piles have essentially no free oxygen in them resulting in nearly all mineral nitrogen being in the ammonium form. It is appropriate in all conventional manure handling systems to assume nitrate nitrogen concentration is zero.
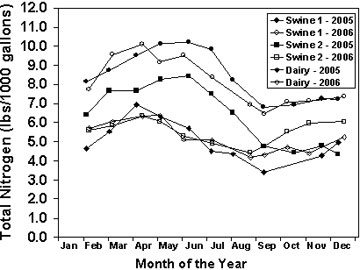 Figure 1
Impact of date of sampling on total nitrogen concentration in unagitated lagoon effluent.
Permitted animal feeding operations are required to sample their manure at least once per year. Many operations will benefit from testing more frequently or combining information from more than one manure test to estimate nutrient concentrations in manure. Figure 1 shows the variation in total nitrogen concentration in three lagoons over two years. In these lagoons it would be prudent to sample in both spring and fall because nitrogen concentration decreased approximately 30 percent between spring and fall.
The best time for sampling manure varies among types of manure storages. Ideally, samples should be taken before manure application, leaving time for lab analysis of the manure so the results can be used in determining manure application rates. This approach works well for unagitated lagoon systems, solids piles and composting systems where there is no limitation on access to the manure. In other systems it is difficult to get a representative manure sample until the time of manure application. Agitated lagoons and pit slurry storages are examples of systems where it is difficult to obtain a representative sample of manure until the time of manure application. In these systems, sample the manure during manure agitation and application activities. The samples taken during application can confirm that the applied rates were correct and the results can be added to the historic data used to calculate rates applied the next time.
In some cases a manure test cannot be obtained (e.g., planning a new operation). In this situation you have the following options listed in order of preference.
- Manure tests from a similarly managed facility are particularly useful for poultry operations and hog slurry operations.
- Feed-based estimates of manure production (see ASAE publication D384, Manure Production and Characteristics (2005)) coupled with a measured or estimated volume of manure can be useful for slurry storages on hog operations.
- Book values are the least desirable source of manure nutrient estimates because they do not account for operation specific characteristics such as animal genetics, feed management practices and water additions to the storage.
See "For further information" for more references on sampling manure storages.
2. Converting manure test results to desired units
Manure test results come in a range of units and not all are equally useful or understood by the person using the manure. Table 4 defines the preferred basis and units for manure test results for solid and liquid manure. If your manure sample results differ from the preferred reporting standard in Table 4 follow the three-step sequence below to convert your results to the preferred reporting standard.
Table 4
Preferred manure test reporting standard for liquid and solid manure.
| Manure form | Preferred moisture basis | Preferred nutrient basis | Preferred units |
|---|---|---|---|
| Liquid | "As-is" | N, P2O5, K2O | Pounds per 1000 gallons (lb/1000 gal) |
| Solid | "As-is" | N, P2O5, K2O | Pounds per ton (lb/ton) |
Step 1
Confirm that manure test results are reported on an "as-is" basis (also referred to as "wet" basis). If they are instead reported on a dry matter basis use the appropriate equation in Table 5 to convert nutrient concentrations from your manure test results to an as-is basis.
Table 5
Conversion table from dry matter basis to as-is basis.
Manure solids reported as and conversion equation
- Percent dry matter (%DM)
Nutrient concentration, wet basis = Nutrient concentration, dry basis x %DM/100 - Percent solids (%Solids)
Nutrient concentration, wet basis = Nutrient concentration, dry basis x %Solids/100 - Percent moisture (%MC)
Nutrient concentration, wet basis = Nutrient concentration, dry basis x (100 - %MC)/100
Step 2
Confirm that phosphorus (P) is reported as P2O5 or phosphate and that potassium (K) is reported as K2O or potash. If they are instead reported as P, phosphorus, or elemental P, and K, potassium, or elemental K, use Table 6 to convert them to a P2O5 and K2O basis. Note that this conversion equation does not affect the units used to report manure test results (e.g., ppm, %, lb/ton, lb/acre-inch, or lb/ton).
Table 6
Conversion table from elemental phosphorus to a P2O5 (phosphate) basis and elemental potassium to a K2O (potash) basis.
Manure test report and conversion equation
- Elemental P or P
P2O5 = Elemental P x 2.27 - Elemental K or K
K2O = Elemental K x 1.22
Step 3
Confirm that test results are in the preferred units of "pounds per 1000 gallons" for liquid samples or "pounds per ton" for solid samples. If they are not, use Table 7 to convert them to the preferred units.
Table 7
Conversion table for converting liquid samples to "pounds per 1000 gallons" and solid samples to "pounds per ton."
| Manure form | Reported units | Conversion equation |
|---|---|---|
| Liquid | percent (%) | lb/1000 gallons = % x 84.3 |
| Liquid | parts per million (ppm) | lb/1000 gallons = ppm x 0.00834 |
| Liquid | mg/L or mg/kg | lb/1000 gallons = mg/L x 0.00834 |
| Liquid | pounds per acre-inch | lb/1000 gallons = lb/acre-inch / 27.15 |
| Solid | percent (%) | lb/ton = % x 20 |
| Solid | parts per million (ppm) | lb/ton = ppm x 0.002 |
| Solid | mg/L or mg/kg | lb/ton = mg/L x 0.002 |
Example 1
A manure test for poultry litter (solid manure) has the following results
- Moisture content (%)
26.3 - Total nitrogen (%)
3.41 - Organic nitrogen (%)
2.97 - Elemental P (%)
2.04 - Elemental K (%)
2.10
All results were reported on a dry matter basis.
Step 1
Convert all nutrient values to "as-is" basis (use Table 5).
- Total N (%, as-is basis) = 3.41 x (100-26.3)/100 = 2.51
- Organic N (%, as-is basis) = 2.97 x (100-26.3)/100 = 2.19
- Elemental P (%, as-is basis) = 2.04 x (100-26.3)/100 = 1.50
- Elemental K (%, as-is basis) = 2.10 x (100-26.3)/100 = 1.55
Step 2
Convert P to P2O5 and K to K2O (use Table 6).
- P2O5 (%, as-is basis) = 1.50 x 2.27 = 3.41
- K2O (%, as-is basis) = 1.55 x 1.22 = 1.89
Step 3
Convert to the preferred units (pounds per ton for solid manure, use Table 7).
- Total N (lb/ton) = 2.51 (%, as-is basis) x 20 = 50
Organic N (lb/ton) = 2.19 (%, as-is basis) x 20 = 44
P2O5 (lb/ton) = 3.41 (%, as-is basis) x 20 = 68
K2O (lb/ton) = 1.89 (%, as-is basis) x 20 = 38
Example 2
A manure sample for hog lagoon effluent (liquid manure) has the following results:
- Dry matter (%)
0.5 - Total N (lb/acre-inches)
175 - Organic N (lb/acre-inches)
40 - Phosphate (lb/acre-inches)
35 - Potash (lb/acre-inches)
200
All results are on a wet basis.
Step 1
Convert all nutrient values to "as-is" basis (use Table 5).
- All results are already on an "as-is" (wet) basis. No conversion needed.
Step 2
Convert P to P2O5 and K to K2O (use Table 6).
- Results are already reported as P2O5 (phosphate) and K2O (potash). No conversion needed.
Step 3
Convert to the preferred units (pounds per 1000 gal. for liquid manure, use Table 7).
- Total N (lb/1000 gal) = 175 (lb/acre-in, as-is basis) / 27.15 = 6.45
- Organic N (lb/1000 gal) = 40 (lb/acre-in, as-is basis) / 27.15 = 1.47
- P2O5 (lb/1000 gal) = 35 (lb/acre-in, as-is basis) / 27.15 = 1.29
- K2O (lb/1000 gal) = 200 (lb/acre-in, as-is basis) / 27.15 = 7.37
3. Calculating PAN
Plant-available nitrogen (PAN) is the sum of the organic nitrogen and inorganic nitrogen in the manure that is available for crop use in the year of application, where k1 values are from Table 1, k2 values are from Table 2 and nutrient concentrations are from the manure test. Typically nitrate contribution is assumed to be zero and is not calculated.
Equation 1
PAN = organic N x k1(Y1) + ammonium N x k2(NH4) + nitrate N + k2(NO3)
Calculating PAN from a manure test in the preferred units is a three-step process.
Step 1
Calculate ammonium N concentration in the manure, if needed.
Manure test results frequently do not directly report ammonium concentration in the manure. Use Equation 2 to calculate ammonium nitrogen content in manure.
Equation 2
Ammonium N = Total N - Organic N - Nitrate N
Nitrate N is typically assumed to be zero when working with manure.
Step 2
Determine the appropriate manure availability factors needed to calculate PAN.
Look up the correct value for k1(Y1) in Table 1. You need to know the type of manure applied (e.g., poultry, liquid swine) to determine k1(Y1).
Look up the correct value for k2(NH4) in Table 2. You need to know the method of application (see Table 3) to obtain the correct value of k2(NH4). The correct PAN cannot be calculated until the method of application is known. Nitrate availability, if needed, is always assumed to be 1.0.
Step3
Calculate PAN using Equation 1 as your guide.
Example 3
Poultry litter (analysis in Example 1) is to be surface applied with a solid spreader to pasture.
Step 1
Calculate ammonium N concentration in the manure.
- From Example 1, total N is 50 lb/ton and organic N is 44 lb/ton. Ammonium nitrogen was not reported.
- Using Equation 2
Ammonium N (lb/ton) = 50 lb Total N/ton - 44 lb Organic N/ton = 6
Step 2
Determine the appropriate manure availability factors needed to calculate PAN.
- From Table 1 k1(Y1) for poultry manure is 0.62. From Table 2 k2(NH4) is 0.50 for surface-applied manure that is not incorporated.
Step 3
Calculate PAN using Equation 1 as your guide.
- PAN (lb/ton)
= Organic N (lb/ton) x 0.62 + Ammonium N (lb/ton) x 0.50
= 44 (lb/ton) x 0.62 + 6 (lb/ton) x 0.50 = 30
Example 4
Lagoon effluent from a hog operation (analysis in Example 2) is to be injected into a corn crop with a tractor-pulled tanker.
Step 1
Calculate ammonium N concentration in the manure.
- From Example 1, total N is 6.45 lb/1000 gallons and organic N is 1.47 lb/1000 gallons. Ammonium nitrogen was not reported.
- Using Equation 2:
Ammonium N (lb/1000 gal) = 6.45 lb Total N/1000 gallons - 1.47 lb Organic N/1000 gallons = 4.97
Step 2
Determine the appropriate manure availability factors needed to calculate PAN.
- From Table 1 k1(Y1) for liquid hog manure is 0.39. From Table 2 k2(NH4) is 0.95 for injected manure.
Step 3
Calculate PAN using Equation 1 as your guide.
- PAN (lb/1000 gal)
= Organic N (lb/ton) x 0.39 + Ammonium N (lb/1000 gal) x 0.95
= 1.47 (lb/ton) x 0.39 + 4.97 (lb/1000 gal) x 0.95 = 5.30
4. Calculating residual nitrogen factor (RNFV)
Residual nitrogen fertilizer value (RNF) is the fraction of organic nitrogen in the manure that will become available the year after manure application. Only organic nitrogen has residual value in year two after application.
Equation 3
RNFV = organic N x kk1(Y2)
Example 5
Calculate the RNFV of poultry litter applied to the pasture (manure analysis from Example 1).
- From Table 1, kk1(Y2) = 0.13.
- RNFV
= organic N x kk1(Y2)
= 44 lb/ton x 0.13 = 6 lb N/ton
This is the estimated amount of nitrogen that will be released from the poultry litter in the second year after application.
Example 6
Calculate the RNFV of lagoon effluent applied to cornfield (manure analysis from Example 2).
- From Table 1, kk1(Y2) = 0.23.
- RNFV
= organic N x kk1(Y2)
= 1.47 lb/1000 gallons x 0.23 = 0.34 lb N/1000 gallons
This is the estimated amount of nitrogen that will be released from the lagoon effluent in the second year after application.
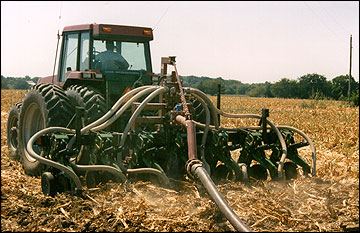 Dragline application of liquid manure.
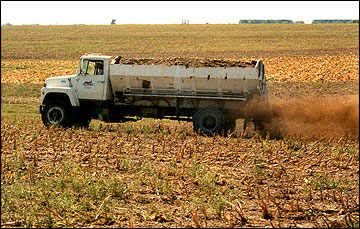
Truck-mounted applicator of solid manure.
Calculating manure application rates with PAN
Examples 7 and 8 show how to determine the manure application rate based on a target nitrogen need for a crop, the amounts of phosphate and potash applied and the amount of nitrogen that will be released in the second year after manure application.
Example 7
The target application rate is 60 pounds per acre for a fall surface application on pasture.
- From Example 3, PAN = 30 lb/ton.
- Manure rate
= Target N rate / PAN
= 60 lb/acre / 30 lb/ton = 2 tons/acre - From Example 1, phosphate in manure = 68 lb/ton and potash in manure = 38 lb/ton.
- Phosphate applied
= Manure rate x phosphate in manure
= 2 tons/acre x 68 lb/ton = 136 lb/acre - Potash applied
= Manure rate x potash in manure
= 2 tons/acre x 38 lb/ton = 76 lb/acre - From Example 5, RNFV = 6 lb N/ton
- Residual nitrogen
= Manure rate x RFNV
= 2 tons/acre x 6 lb N/ton = 12 lb N/acre
Example 8
The target application rate is 150 pounds per acre for a lagoon effluent injected ahead of a corn crop.
- From Example 4, PAN = 5.30 lb/1000 gallons.
- Manure rate
= Target N rate / PAN
= 150 lb/acre / 5.30 lb/1000 gallons = 28.3 thousand gallons/acre - From Example 2, phosphate in manure = 1.29 lb/1000 gallons and potash in manure = 7.37 lb/1000 gallons.
- Phosphate applied
= Manure rate x phosphate in manure
= 28.3 thousand gallons/acre x 1.29 lb/1000 gallons
= 36 lb/acre - Potash applied
= Manure rate x potash in manure
= 28.3 thousand gallons/acre x 7.37 lb/1000 gallons
= 209 lb/acre - From Example 6, RNFV = 0.34 lb N/1000 gallons
- Residual nitrogen
= Manure rate x RFNV
= 28.3 thousand gallons/acre x 0.34 lb N/ton = 10 lb N/acre