What will this guide help you do?
Soil test reports are designed to translate laboratory measurements into practical nutrient and lime decisions. When sampling is consistent, and the correct crop and yield goal are selected, a soil test report can help you identify which nutrients are most likely to limit yield or quality, avoid unnecessary fertilizer inputs, and track soil fertility trends over time. Use this guide to:
- confirm that your sample and report settings match your field, lawn, or garden (depth, units, crop, yield goal if required);
- understand the major sections of the MU soil test report (soil test results, ratings, and recommendations);
- interpret pH and acidity measures (pH, buffer pH, neutralizable acidity) and how they affect lime recommendations;
- prioritize where fertilizer response is most likely;
- utilize updated submission guidance for Extension office entries under the complete (regular) package; and
- follow two examples of MU soil test reports (field crops first and horticultural crops second) using the attached sample reports.
Mehlich-3 transition: What changed and why?
The MU Extension Soil & Plant Testing Laboratory has transitioned to a soil nutrient extraction method called Mehlich-3. This method is a widely used standard for routine soil testing. Before making this change, the laboratory conducted extensive evaluations to ensure that Mehlich-3 results matched and correlated with long-standing MU methods previously used for interpretation. This careful evaluation helps ensure reliable, consistent recommendations.
Moving to Mehlich-3 improves laboratory efficiency and supports faster turnaround times. This transition enables a more complete nutrient analysis from a single extraction, which lowers soil testing costs.
Mehlich-3 provides multiple plant-available nutrients
- macronutrients: phosphorus (P), potassium (K), calcium (Ca), magnesium (Mg), and sulfur (S);
- micronutrients: zinc (Zn), iron (Fe), manganese (Mn), copper (Cu), and boron (B); and
- other diagnostic elements: sodium (Na) and aluminum (Al) help interpret salinity/sodicity and acidity-related constraints, respectively.
For phosphorus, Mehlich-3 performs well across a broader range of soil conditions than previously used methods that are best suited to acidic soils. This is especially useful across Missouri, where soils range from acidic uplands to neutral and calcareous settings.
Comparing new results with older tests
If you have older MU soil tests that used different extraction methods, do not compare raw numbers directly across methods. Instead, compare the interpretation categories (Very Low, Low, Medium, High, Very High) and recommendations, and keep the sampling depth and timing consistent. The interpretation categories and recommendations are designed to remain consistent across the transition from the old to the new Mehlich-3 method.
In the new electronic report, results are displayed using Mehlich-3, legacy extraction methods (listed as “Others”), or both. Mehlich-3 is the default setting. “Others” method values can be provided either by running the legacy methods on special request, or by reporting legacy-equivalent values calculated from Mehlich-3 using regression-based conversion equations. There is no conversion equation for Al (Table 1).
Table 1. Legacy-equivalent conversions used in the reporting system in ppm.
| Legacy method (reported as “Other”) | Conversion from Mehlich-3 |
|---|---|
| Bray-1 P | Bray-1 P = 0.746 × Mehlich-3 P |
| Ammonium Acetate (AA) K | AA K = 0.933 × Mehlich-3 K |
| Ammonium Acetate (AA) Ca | AA Ca = 0.869 × Mehlich-3 Ca |
| Ammonium Acetate (AA) Mg | AA Mg = 0.820 × Mehlich-3 Mg |
| Ammonium Acetate (AA) Na | AA Na = 1.055 × Mehlich-3 Na |
| Calcium-phosphate S | Ca-phosphate S = 0.324 × Mehlich-3 S |
| DTPA Zn | DTPA Zn = 0.521 × Mehlich-3 Zn |
| DTPA Fe | DTPA Fe = 0.330 × Mehlich-3 Fe |
| DTPA Mn | DTPA Mn = 0.323 × Mehlich-3 Mn |
| DTPA Cu | DTPA Cu = 0.520 × Mehlich-3 Cu |
| Hot-water B | Hot-water B = 0.493 × Mehlich-3 B |
All legacy (other) methods are available as a special request option. The analysis package cost will remain the same as before. In the current report header, the top-left method selector includes (1) Mehlich-3 and (2) Others (Bray1/AA/Ca-Phosphate/DTPA/HotWater). Users may select either option or both at the same time, but Mehlich-3 is set as the default.
Complete soil test package, pricing, and discounts
The MU lab’s regular package includes analysis of the following:
- Soil pH (salt), soil pH (water), buffer pH, and neutralizable acidity
- Organic matter (loss on ignition estimate)
- Mehlich-3 P, K, Ca, Mg, S, Na, Zn, Mn, Fe, Cu, B, Al (option to Bray1 P, Ammonium Acetate K, Ca, Mg, Na; Ca-Phosphate S, DTPA for Zn, Fe, Cu, Mn; and Hot water B)
- Cation exchange capacity (CEC), base saturation, and CEC-based soil texture
The MU lab’s regular soil test package costs $15 per sample (fees subject to change). Single-submission volume discounts:
- More than 100 samples: 10% discount
- More than 500 samples: 15% discount
- More than 1,000 samples: 20% discount
Special volume discount: If you anticipate submitting more than 5,000 samples in a calendar year, contact the lab directly at soiltestingservices@missouri.edu or 573-882-0623.
Extension office submission guidance
Guidance for sample submission through an Extension office for field crops (MP188); commercial fruits, vegetables, and turfs (MP727); or lawns and gardens (MP555) is available. Requests for any individual add-on package, such as zinc (Zn), sulfur (S), micronutrients (Zn, Fe, Mn, Cu), sodium (Na), or boron (B), should be selected as “Regular”.
“Regular” selection in the soil test submission form (field crops; commercial fruits, vegetables, and turfs; and lawns and gardens):
- The sample is analyzed for the full complete package, and there is no additional charge for individual add-ons that fall within the included analyses; and
- If the client's request falls within the included analyses, the client receives the full set of results at no additional cost.
Step 1: Collect a representative soil sample
A soil test report is only as accurate as the sample submitted. Most “unexpected” results are caused by sampling inconsistency rather than laboratory error. To protect the value of your test and ensure year-to-year comparability, follow consistent sampling depth, collect enough cores to provide a representative sample, and separate areas that differ in soil type or management.
A practical, step-by-step sampling checklist:
- Collect soil samples from the recommended sampling depth (0-6 inches) and keep them consistent.
- Separate different areas: soil type changes, slopes, management zones, different cropping histories, old feedlots, or heavily banded fertilizer areas.
- Within each uniform area, collect many cores (15-20) in a zig-zag pattern and combine into one composite sample. For smaller areas such as a garden, fewer cores (10-15 are sufficient). Consider recording a GPS coordinate for each composite area.
- Use clean tools (probe, auger) and a clean plastic bucket. Avoid galvanized or rusty containers that can affect micronutrient results.
- Mix the cores thoroughly, remove stones and plant residues, and submit the recommended subsample amount. Boxes are available at your local extension office.
- Label the sample clearly (field ID, area/zone, depth, date, and GPS coordinates if recorded).
- Avoid sampling immediately after fertilizer, manure, or lime applications and avoid extreme wet, frozen, or droughty soil conditions when possible. Proximity to a gravel road may affect results.
For detailed sampling guidance, including grid, zone, and composite sampling strategies, see MU Extension publication G9070, Soil Sampling Depth and Collection Techniques for Soil Fertility and Soil Health Testing.
Step 2: Understand the major parts of the MU soil test report
MU soil test reports include (1) a soil test results table with values and ratings, (2) pH and acidity-related measures used to estimate lime recommendations, (3) organic matter and CEC, and (4) a recommendations table that converts results into nutrient and lime rates for the selected crop and yield goal (soil test reports 1 and 2).
Confirm report settings: method and units
Start by confirming the extraction method(s) and the unit display selected in the report header. In the top-left of the electronic report, the method selector includes (1) Mehlich-3 and (2) Others (legacy methods). Either option or both can be selected, but Mehlich-3 is set as the default. In the top-right, the unit selector includes (1) ppm (mg/kg), which is set as the default, and (2) lb/acre equivalents are calculated as lb/acre = ppm × 2 (approx. for the top ~6 inches; actual factor varies with bulk density and depth). Garden and landscape reports present fertilizer and lime recommendations per 1,000 square feet.
- Mehlich-3: multi-nutrient extraction method used for routine reporting of P, K, Ca, Mg, S, Na, Zn, Fe, Mn, Cu, B, and Al.
- Others (legacy methods): Bray-1 P; ammonium acetate (AA) extractable K, Ca, Mg, and Na; DTPA extractable Zn, Fe, Mn, and Cu; calcium-phosphate extractable S; and hot-water extractable B. These may be measured directly as a special request, or reported as legacy-equivalent values derived from Mehlich-3 for all nutrients except Al.
- Units: ppm (mg/kg) are concentration-based. The lb/acre (ppm × 2) units are an approximate surface-soil conversion often used for quick planning. Always base decisions on the report’s category rating and recommendation for your selected crop and yield goal.
For meaningful comparisons across years, keep sampling depth and timing consistent. Compare interpretation categories (Very Low, Low, Medium, High, and Very High) and recommendations rather than raw numbers when methods or units differ between soil tests.
Soil test results: How to interpret your report
The lettered sections below correspond to letters shown on the attached MU soil test example reports: Soil Test Report 1 for Field Crops and Soil Test Report 2 for Lawns & Gardens.
A. Soil pH (salt) and soil pH (water)
Soil pH is the primary soil-chemistry indicator on the report because it affects nutrient availability, root growth, and microbial activity that drives nutrient cycling. When soil has a low pH, the availability of nutrients such as phosphorus (P), potassium (K), calcium (Ca), magnesium (Mg), and molybdenum (Mo) decreases, while aluminum (Al) and manganese (Mn) can become more soluble and potentially injure roots. When soil has a high pH, the availability of zinc (Zn), iron (Fe), manganese (Mn), and sometimes phosphorus (P) declines. This is why soil pH is the first item to interpret, because correcting pH often improves the effectiveness of nutrients already in the soil.
MU reports two pH values. Soil pH (salt) is measured, determined in a 0.01 M CaCl2 solution. This method improves consistency by reducing the influence of variable soil moisture and salt concentration. The report also provides soil pH (water) as a converted value derived from pH (salt), allowing users to compare results with older pH (water)-based interpretations or expectations.
- Soil pH (salt): measured in 0.01 M CaCl2
- Soil pH (water): converted from salt pH using: pH(water) = 0.684 + 0.9573 × pH (salt) [MU lab also analyzes soil pH by water method on request with an additional fee]
Ideal pH ranges: Most soil nutrient availability and biological processes that support crop growth, such as root development, microbial activity, residue breakdown, and nitrogen fixation in legumes, perform best in a moderately acidic to near-neutral range. That’s why many row-crop systems target ~6.0–6.5 to balance nutrient availability while minimizing acid-related constraints such as aluminum (Al) toxicity and poor root growth at low pH, and micronutrient tie-up (Zn and Fe) at a high pH. The “optimum” pH is crop-specific. For instance, blueberries are adapted to strongly acidic soils and may develop iron chlorosis and poor growth if the soil pH is raised too high. However, legumes such as alfalfa are less tolerant of acidity and typically require a higher target pH to maintain stands and yield.
Practical implications: Soil pH determines whether the soil environment is supportive of efficient nutrient uptake. If pH is below the crop target, fertilizer efficiency is reduced, and crop response to lime is often among the most reliable “first investments”. If pH is low, prioritize liming and incorporate when feasible. If pH is in the desirable range, focus on nutrients with low ratings and maintain pH through routine retesting. If soil pH is above the crop’s desired range, management options depend on the cause (e.g., free carbonates) and the production system. Lowering pH by elemental sulfur is typically only practical for localized horticultural uses; follow the report guidance where provided. The MU soil test report will indicate the required amounts of lime and elemental sulfur to adjust the pH to the desired ranges.
B. Buffer pH and neutralizable acidity (lime requirement)
Soil pH tells you whether your soils require lime, but it does not tell you how much lime is needed to change the pH. That’s the role of buffer pH and neutralizable acidity. Buffer pH reflects the soil’s resistance to pH change (buffering capacity), which is influenced by clay, organic matter, and exchangeable acidity. Two soils can have the same soil pH, but they require different lime rates depending on the buffering capacity of the soil.
MU measures buffer pH using the Woodruff buffer, then reports neutralizable acidity using a simple conversion. Neutralizable acidity is an estimate of the amount of acidity on exchange sites that must be neutralized to reach the target condition used in MU’s system. If buffer pH is ≥ 7.0, N.A. is treated as 0 (no lime requirement).
- Neutralizable acidity (N.A.) (meq/100g) calculated as: N.A. = (7.0 − buffer pH) × 10
Practical implications: Buffer pH and neutralizable acidity explain how much lime is needed. This is what allows lime recommendations to be scaled appropriately for different soils. Use lime recommendations derived from these values; when possible, apply and incorporate lime to speed the pH correction in the root zone. If the report includes application limits, which is common for horticultural reports, follow these limits to avoid over-application in a single pass.
C. Organic matter (OM; LOI estimate)
Organic matter (OM) represents the portion of soil made of decomposed plant and microbial residues, living organisms, and humified materials. Soil OM is central to nutrient cycling because it stores nutrients such as nitrogen and sulfur, and releases them gradually through mineralization. Organic matter also supports soil aggregation, water holding capacity, water infiltration, and production resilience under weather stress. MU reports OM as an estimate based on loss-on-ignition (LOI), a widely used method for routine OM assessment and tracking.
Practical implications: Soil OM provides “background fertility” and improves soil physical conditions that support rooting and nutrient uptake. Low OM systems often show greater variability in crop performance and may require more careful nutrient application timings and maintenance. Treat OM as a trend indicator rather than a single-year decision number. Track OM over time with consistent depth and timing, and build OM through long-term practices including residue retention, no-till, diversified rotations, cover crops, biochar, and manure or compost applications where research and economics support its use locally.
D. Cation exchange capacity (CEC; summation method)
Cation exchange capacity (CEC) is the soil’s capacity to retain and exchange positively charged nutrient ions (cations) such as K+, Ca2+, Mg2+, and Na+. In practical terms, CEC helps explain nutrient buffering and risks. Low CEC soils tend to hold fewer cations and can show greater variability in K and Mg over time. Higher CEC soils typically buffer nutrients more strongly. MU reports CEC using a summation method that combines the measured extractable cations and neutralizable acidity.
MU’s calculation is: CEC (meq/100g) = K(ppm)/391 + Ca(ppm)/200.4 + Mg(ppm)/121.6 + Na(ppm)/229.9 + neutralizable acidity (meq/100g)
MU lab analyzes CEC by the NH4OAc distillation method on request at an additional fee.
Practical implications: CEC is a risk-management tool. A lower CEC increases the likelihood that soil test K can decline more quickly under high removal, and nutrient concentrations can fluctuate more with weather and management. Higher CEC soils generally provide more buffering against short-term changes. Use CEC to guide your maintenance strategy, especially for K. On lower CEC soils, maintaining adequate K is often more important, and split applications may be considered when feasible. On higher CEC soils, nutrient levels may be more stable, but nutrient removal from the soil is important.
E. Macronutrients (P, K, S, Ca, Mg) tests and ratings
Phosphorus (P), potassium (K), and sulfur (S) are macronutrients most often associated with yield-limiting deficiencies in many cropping systems because plant demand is high and soils frequently require external fertilizer inputs to sustain economically optimal production. Calcium (Ca) and magnesium (Mg) are usually adequate in most Missouri soils due to parent material, exchangeable reserves, and liming history. Soil-based Ca and Mg deficiencies are less common in row-crop systems. However, Ca can still be a concern in horticultural crops, not necessarily because soil Ca is low, but because Ca movement to developing tissues can be limited during drought or irregular watering. Sulfur has also become increasingly important because it is often considered the fourth major deficient nutrient after N, P, and K. The increase in S deficiencies has been in part due to a decrease in atmospheric sulfur deposition, while modern fertilizer programs often provide less incidental S than in past decades.
Phosphorus (P), potassium (K), and sulfur (S) tests and ratings
Phosphorus, K, and S are often the soil test items that drive the largest fertilizer decisions because they frequently limit yield when soil supply is low. The extractable values on the report represent the portion of soil nutrients that a specific extractant can remove and correlate with crop response probabilities in calibration research. MU reports include both the measured extractable value and a rating category (e.g., Very Low, Low, Medium, High, Very High), which functions as a practical interpretation tool. For P and K, ratings often closely align with responses and provide a direct signal for prioritizing fertilizer investment. For S, interpretation is less obvious because S availability depends strongly on organic matter mineralization, landscape position, and seasonal moisture. Nevertheless, soil test values and rating categories still provide useful screening information to minimize the risk of deficiency. If S fertilizer is applied, keep in mind that timing is important since S is highly mobile in soil.
How to interpret ratings
Rating categories (Very Low, Low, Medium, High, Very High) translate soil test values into an agronomic message about the likelihood of crop response to fertilizer. While thresholds are nutrient- and crop-specific, the general meaning is:
- Very Low / Low have a high probability of yield response, and corrective fertilization is a priority.
- Medium indicates that a response is possible. Follow recommendations and consider current production economics and crop removal.
- High / Very High suggests a low probability of yield response in the short term. A shift toward maintenance or skip applications may be appropriate. Retest soils in 2-3 years.
Table 2. Probability of yield response to fertilization.
| Soil test category | Typical probability of yield response to fertilization |
|---|---|
| Very Low (Severe Deficient) | 80–100% |
| Low (Deficient) | 55–75% |
| Medium (Critical) | 20–30% |
| High (Optimum) | 0–10% |
| Very High (Above Optimum) | 0–1% |
Practical implications: P and K category ratings support economically sound decisions. Invest where response is likely and avoid unnecessary build-up when the crop is unlikely to respond. Sulfur deserves special attention because it is increasingly a yield-limiting nutrient in susceptible soils and seasons, and because declining atmospheric S deposition has reduced “background” S compared to the past. As a result, S deficiency is now more frequently observed in coarse-textured and low-organic-matter soils or in cool, wet springs when mineralization is slow.
Use the category rating and the recommendation table together. Confirm that the crop and yield goal are correct on the form and then apply the recommended rates or adjust carefully based on documented field history, such as the application of manure, recent high-rate fertilizer applications, removal history, irrigation and drainage conditions, or zone variability. If the category rating is borderline for S or field conditions increase S deficiency risk (low OM, sandy areas, no manure history, early-season stress), consider confirming the need using plant tissue testing or small on-farm strips to verify yield response before adopting routine applications.
Calcium (Ca) and Magnesium (Mg): These nutrients are usually adequate in Missouri soils, but Ca can still limit fruit quality under stress conditions. Calcium and Mg values in the report provide important context for soil fertility and cation status, but they are less common primary drivers of fertilizer decisions in most Missouri field-crop systems because deficiencies are rare. Calcium contributes to cell wall structure and membrane stability, while magnesium is central to chlorophyll and photosynthesis. In most agronomic situations, maintaining appropriate soil pH through liming and following P, K, and S recommendations typically supports adequate Ca and Mg nutrition.
A key exception is horticultural production, including some fruit trees and vegetables, where Ca-related disorders can occur even when soil Ca is not truly deficient. This happens because Ca is relatively immobile in the plant and depends on water flow for transport. Drought, irregular irrigation, or rapid fruit growth can reduce Ca delivery to young tissues and fruit. In these situations, the first “fix” is often improved water management and consistent moisture rather than simply adding Ca fertilizer.
Practical implications: Ca and Mg results can help explain pH behavior, base saturation, and overall nutrient buffering. They also help avoid unnecessary inputs when Ca and Mg are already adequate and allow targeted decisions when special situations arise (e.g., Ca-related fruit disorders). Treat Ca and Mg as context indicators in most field-crop systems. Focus management on pH and nutrients most likely to limit yield. In horticultural systems where Ca-related fruit disorders are a concern, prioritize consistent irrigation and plant water status first, then consider Ca inputs only when aligned with crop needs, symptoms, and management conditions.
F. Micronutrients (Zn, Fe, Mn, Cu, B) and how to use them
Micronutrients are required in small amounts, but they are essential for photosynthesis, enzyme function, hormone regulation, and reproductive development. In practice, micronutrient deficiencies are usually site-specific and are driven as much by soil chemistry and crop sensitivity as by the soil test value itself. That’s why MU reports provide extractable micronutrient values (typically Zn, Fe, Mn, Cu, and B) and, where available, an interpretive category rating. The key is to treat micronutrient results as a risk screen, then interpret them through the lens of soil pH, texture, organic matter, drainage, carbonate presence, and the crop being grown.
How to interpret micronutrient ratings (and why “Low” does not always mean “fertilize”): A Very Low/Low rating generally means the soil has a high probability of micronutrient limitation under the unfavorable conditions, but it does not guarantee a yield response to fertilizer application. Micronutrient calibration is inherently more variable than other nutrients because their availability is strongly affected by soil pH, moisture/redox conditions, and interactions with other nutrients. In other words, the same soil test value may behave differently in two fields depending on pH, carbonate status, organic matter, compaction, drainage, and weather.
A practical way to interpret ratings is:
- Very Low / Low: High risk, but not an automatic prescription. First ask: “Is soil pH (or carbonate) likely restricting availability?” Then ask: “Is this a crop that commonly responds to this micronutrient on these soils?”
- Medium: Borderline zone. Deficiency can still occur if pH is high, carbonates are present, organic matter is low, or the crop is highly sensitive.
- High / Very High: Low likelihood of deficiency, but problems can still appear due to root restriction, drought, cold soils, or antagonisms. For instance, excessive P can reduce Zn uptake.
Bottom line: The micronutrient rating is most useful as a triage tool. It tells you where to investigate further, but not necessarily where to apply the fertilizer product.
Why pH is the first diagnostic filter for micronutrients
Across most agronomic systems, soil pH is the strongest single predictor of micronutrient availability. When pH increases toward neutral and alkaline conditions, the solubility and plant availability of several micronutrients generally decline. Zinc, Fe, Mn, and Cu are more likely to be adsorbed, precipitated, or converted into less plant-available forms. In acidic soils, Mn can become soluble, increasing the risk of toxicity and root injury. Whenever a report shows Low micronutrients, the “first question” should be: Is the soil pH in the crop’s target range? In many cases, correcting pH toward the recommended range improves micronutrient uptake efficiency and reduces the need for repeated micronutrient fertilizer inputs. MU Extension guidance also emphasizes that extreme pH values can limit nutrient availability and complicate diagnosis, underscoring the importance of pH in interpretation and troubleshooting.
Table 3. Crop- and nutrient-specific patterns (what is most likely to respond and under what conditions).
| Nutrient | Most responsive crops/situations | Conditions that increase deficiency risk | Practical interpretation tip |
|---|---|---|---|
| Zinc (Zn) | Corn tends to show the most consistent response when soil Zn is low, and conditions restrict availability. | High pH / calcareous soils, cool/wet early season, coarse texture and low organic matter, and sometimes high or repeated P applications can reduce Zn availability/uptake. | If Zn is Low but pH is near optimal, and there is a strong history of manure/Zn input, the response may be limited. If Zn is Medium but the soil is high pH/calcareous and corn is grown, the risk can still be real; confirm with tissue tests (MU Soil & Plant Testing Lab) or on-farm strips. |
| Iron (Fe) | Iron Deficiency Chlorosis (IDC) risk is a classic case in soybean. Soil tests are often weaker predictors of response. | High pH + carbonates/ bicarbonates (calcareous soils), wet/cool or poorly aerated conditions that affect root function and Fe acquisition. | If Fe looks Low, focus less on “adding Fe” broadly and more on identifying IDC risk: pH/carbonates, chlorosis history, sensitive varieties, drainage/wetness patterns. Use tolerant varieties and targeted strategies rather than routine soil-applied Fe. |
| Manganese (Mn) | Some crops respond in high-pH soils when Mn availability is restricted. Mn behavior is strongly tied to pH and redox. | Deficiency risk rises at high pH in well-aerated soils (Mn oxidizes into less available forms). Toxicity risk rises at a low pH, and Mn becomes more soluble. | If Mn is Low and pH is high, Mn fertilizer may help in responsive crops, but pH and field conditions dominate. If soils are strongly acidic and symptoms suggest toxicity, the fix is often liming, not adding Mn. |
| Copper (Cu) | Responses are more likely in high organic matter soils and some alkaline/calcareous conditions. Apply cautiously in these situations. | High organic matter (Cu complexed/less available), certain high pH/calcareous conditions; limited plant-available Cu even if total Cu is adequate. | A Low Cu rating should trigger checks on soil type (organic/muck vs mineral), pH, and crop sensitivity. Avoid casual Cu use. Excess Cu can accumulate in perennial systems. |
| Boron (B) | Response is more likely in B-sensitive crops (e.g., alfalfa and some vegetable/fruit crops) where soil supply is low and moisture limits uptake. | Coarse texture, low organic matter, dry conditions (reduced mass flow), sometimes calcareous/high-pH settings depending on adsorption/chemistry. Narrow margin between deficiency and toxicity. | If B is Low, don’t apply automatically. Consider crop sensitivity, water, and soil conditions first. If B is needed, be precise. Application rate accuracy matters due to a narrow safety window. |
To interpret micronutrients, using a short decision sequence is recommended instead of a single-number decision:
- Start with soil pH. pH often explains the micronutrient limitation better than the extractable value alone.
- Use the rating as a risk indicator. Low = investigate. It does not always mean “apply”.
- Overlay crop sensitivity and field history. Ask whether the crop commonly responds (e.g., Zn in corn; IDC risk in soybean on calcareous soils).
- Confirm with tissue diagnostics when the decision is costly or uncertain. Tissue testing is especially helpful when symptoms appear, soil tests are borderline, or when pH is likely driving availability.
- Use on-farm strips when feasible. Small, replicated strips can validate whether a micronutrient application produces an economic response under your conditions.
Practical implications: When micronutrient rates are Low/Very Low, prioritize pH correction to the crop’s target range when feasible. A pH adjustment improves overall nutrient-use efficiency and can reduce the need for repeated micronutrient inputs over time. When high pH or calcareous conditions are prevalent, and pH changes are difficult, rely more on crop/variety selection, targeted nutrient placement, and confirmation through tissue testing and strip applications rather than blanket applications.
G. Sodium (Na)
On MU soil reports, sodium is included mainly as a diagnostic and risk indicator. Sodium is evaluated because excess can negatively impact soil physical properties and reach toxic levels for plants. Sodium matters most when it is high relative to Ca and Mg. High soil test Na levels can degrade soil structure (clay dispersion), leading to crusting, surface sealing, reduced infiltration, ponding, and variable stands. Symptoms can look like compaction or poor drainage. High Na levels in soil can harm crops by interfering with the way plants take up water and nutrients, leading to stunted growth and reduced yields. If Na is high, the practical focus is to identify the source (water quality, drainage, landscape position, salt inputs) and manage sodicity risk (often improving drainage/leaching and, when appropriate, applying a soluble Ca source such as gypsum). In most cases, Na should be monitored and managed when it is high, rather than applied as a nutrient.
H. Aluminum (Al)
Aluminum is reported as an indicator of acidity stress, not a plant nutrient. In acid soils, Al is more soluble and can restrict root growth, reduce water and nutrient uptake, and cause stress that may resemble drought or nutrient deficiency. Al should be interpreted in conjunction with soil pH (salt/water), buffer pH, and neutralizable acidity. Concerns increase when soil pH is below the crop target. The primary corrective practice is usually limited to raising pH and reducing Al activity to improve rooting and fertilizer efficiency. Most field crops are sensitive to Al at low pH, but acid-adapted crops such as blueberry can perform well at low pH. Al is typically only a concern when soils are over-acidified (e.g., pH is lowered below the crop’s target range) or when aluminum sulfate is used aggressively as an acidifier, which can injure roots.
I. Base saturation (K, Ca, Mg, Na, H)
Base saturation (BS) is the percent of CEC occupied by exchangeable cations (K, Ca, Mg, Na), while the remainder is represented as acidity (H/exchangeable acidity).
MU reports base saturation as BS-K (%), BS-Ca (%), BS-Mg (%), BS-Na (%), and BS-H (%).
Base saturation should not be used as the primary basis for fertilizer decisions because it is a relative measure, not a direct indicator of nutrient sufficiency. Percentages can appear “imbalanced” even when nutrient levels (ppm and category ratings) are adequate. Base saturation values can shift as CEC, organic matter, or acidity changes. Peer-reviewed research evaluating an “ideal” base saturation or Ca:Mg ratio has shown no consistent yield benefit from chasing base ratios and often results in higher amendment costs. Fertility and lime decisions are more reliable when based on soil pH + buffer pH/neutralizable acidity (lime need) and soil test nutrient levels/ratings (response probability).
Where base saturation is useful is as a diagnostic context tool: High BS-H supports acidity problems, and potential lime is needed. Elevated BS-Na can indicate sodicity/structural risk (crusting, poor infiltration) and signal the need for salinity/sodicity follow-up (EC, SAR/ESP), not Na fertilization. Unusually high BS-K with marginal Mg (or a history of heavy K) can suggest possible K-Mg uptake interactions worth confirming with Mg values, symptoms, and tissue testing. Differences in BS-Ca and BS-Mg can help explain variability among soils due to parent material or liming history.
Practical implications: Use base saturation to support interpretation, not to set targets. If it flags something unusual (e.g., high BS-Na or very high BS-K with marginal Mg), treat it as a prompt to confirm with field history and targeted diagnostics.
J. CEC-based major soil type estimate (screening-level texture estimate)
MU includes a CEC-based major soil type estimate as a screening-level classification rather than a true particle-size texture measurement. This is useful for quick context because CEC is often related to texture and clay mineral content, but it does not replace laboratory particle-size analysis.
The CEC thresholds are:
- CEC ≤ 10.9 meq/100g: sandy soils (sand, loamy sand, sandy loam)
- CEC 11.0–20.9 meq/100g: loamy soils (silt, silt loam, loam, sandy clay loam)
- CEC ≥ 21.0 meq/100g: clayey soils (sandy clay, clay loam, silty clay loam, silty clay, clay)
For accurate soil texture determination, the hydrometer (particle-size) method is available by special request at an additional cost.
Practical implications: Texture influences water-holding capacity, nutrient buffering, and response to fertilizer applications, especially for K and, sometimes, S. A screening-level estimate can help explain why recommendations differ between soils. If a more accurate texture is needed (e.g., for high-stakes management zoning, irrigation scheduling, or research-grade interpretation), request a hydrometer (particle-size) analysis, available by special request at an added cost.
K. Fertilizer and Lime Recommendations: Example field crop report (Soil Test Report 1)
The attached field-crop report demonstrates how ratings and recommendations guide corn and soybean fertility decisions. In this example, soil pH is slightly acidic, and lime is recommended. However, P and K are Medium; therefore, maintenance/build applications are recommended to sustain soil test levels.
Key results and interpretation for soil test report 1 (field crops):
- Soil pH (water = 5.9; salt = 5.5) is rated Medium. Soil pH is slightly acidic and may reduce nutrient availability/efficiency for some crops; apply lime based on the lime requirement (ENM) shown below to move pH toward the crop target range.
- CEC = 15.4 meq/100g and organic matter (OM) = 2.6%: moderate nutrient-holding capacity; K can decline with crop removal, so maintain K near the target range and retest on schedule to monitor drawdown.
- Phosphorus (P) = 64.0 lb/acre is rated Medium: yield response is possible but not guaranteed; apply maintenance/build P2O5 at the recommended rate (90 lb P2O5/ac for corn and 65-75 lb P2O5/ac for soybean, depending on yield goal) for your crop and yield goal to support yield and prevent the soil test from declining into Low.
- Potassium (K) = 422.0 lb/acre is rated Medium: yield response is less likely than in Low, but possible depending on crop removal and conditions; follow the recommended maintenance/build K2O rate (60-65 lb K2O/ac for corn and 90-105 lb K2O/ac for soybean, depending on yield goal) for your crop and yield goal, and retest in 2-3 years to confirm the trend.
- Sulfur (S) = 20.0 lb/acre is rated Medium. Sulfur deficiency risk is low; no routine S application is recommended unless there is a known field history, coarse texture/low OM, or tissue tests indicate deficiency.
- Zinc (Zn) = 6.54 lb/acre is rated Medium. The risk of Zn deficiency is low; no routine Zn application is recommended.
- Nitrogen (N) recommendations are based on yield goal, crop rotation, and organic matter content, but not on soil test N level. Routine soil tests generally do not provide a reliable soil N value for fertilizer recommendations.
Limestone suggestions: what ENM means and how to convert it to a lime rate
MU Soil & Plant Testing reports lime recommendations as ENM (Effective Neutralizing Material). ENM is a standardized way to express “how much neutralizing power” the soil needs while accounting for lime quality. In simple terms, ENM combines both the chemical neutralizing value (purity/effective calcium-carbonate equivalent, CCE) and fineness (particle size), which determine how quickly lime reacts. The lime supplier provides the ENM value for the lime source. This lets MU provide a recommendation that can be applied consistently across different lime sources.
What the ENM number means:
- ENM = 0 lb/ac means no lime is needed to reach the target pH for the selected crop and management system.
- A positive ENM value, such as 735 lb/ac in this report, means the soil needs additional neutralizing material to raise pH. The larger the number, the greater the lime requirement.
How to convert ENM number to an actual limestone application rate: To get the tons of limestone (Ag lime) product per acre, divide the report ENM requirement by the ENM guaranteed by your lime supplier (lb ENM per ton of product):
- Tons lime/ac = (ENM required, lb/ac) ÷ (lime ENM guarantee, lb/ton) Examples:
- If the soil test reported ENM requirement = 735 lb/ac and lime supplier guarantees ENM = 400 lb/ton, then lime rate = 735 ÷ 400 = 1.84 tons/ac.
- If the soil test reported ENM requirement = 735 lb/ac and lime supplier guarantees ENM = 300 lb/ton, then lime rate = 735 ÷ 300 = 2.45 tons/ac.
Key takeaways: The lower the lime ENM/ton, the lower the quality or coarser the material. A greater amount of lime is needed to deliver the same effective neutralizing power.
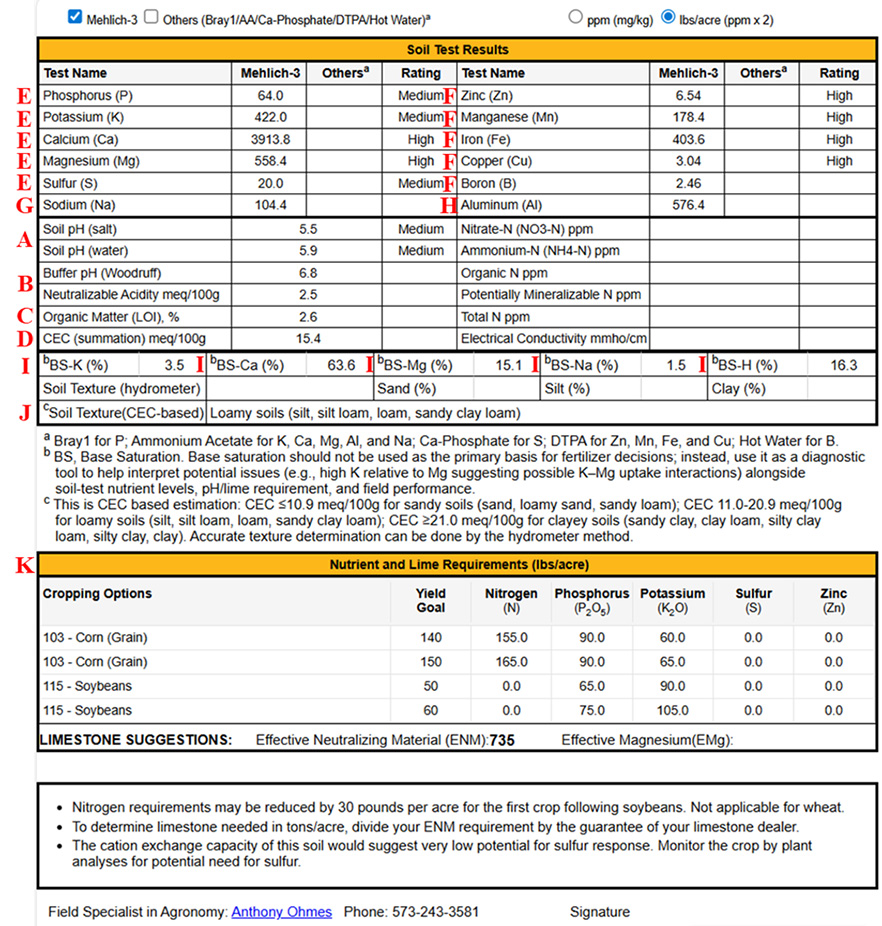
Additional comments: Additional decision rules in the report include a 30 lb/ac nitrogen credit for the first crop following soybeans (not applicable to wheat) and guidance to apply the recommended zinc only once in the rotation. Sulfur is not recommended in this example. The report notes that sulfur response potential is low and suggests monitoring crops and using plant analysis when sulfur deficiency is suspected.
K. Fertilizer and Lime Recommendations: Example horticultural crop (Soil Test Report 2)
The attached horticultural report illustrates a different but common situation: strong soil acidity with very low phosphorus, very low potassium, and low calcium. For vegetables and gardens, correcting soil pH is typically the first priority because acidity reduces nutrient availability and fertilizer efficiency.

Key results and interpretation for soil test report 2 (vegetables):
- Soil pH (salt 5.8; water 6.2) is moderately acidic (rated Medium) and below the target range for most vegetables, so lime is a top priority to improve nutrient availability and overall fertilizer efficiency.
- Neutralizable acidity (N.A.) is 1.5 meq/100g: this supports a meaningful lime requirement, consistent with the recommendation. Calcitic lime is appropriate in most cases; use dolomitic lime only if soil-test Mg is low or Mg is specifically needed (Mg is high in this report, so no dolomitic lime is needed).
- Phosphorus (P) = 17.0 lb/acre is rated Very Low: there is a high probability of response to P, especially after pH is corrected. Apply the recommended P2O5 rate (4.0 lb P2O5 per 1,000 sq ft) to build soil P and support early growth.
- Potassium (K) = 144.0 lb/acre is rated Very Low: K is very likely to limit yield and quality for many vegetable crops. Apply the recommended K2O rate (2.5 lb K2O per 1,000 sq ft) and retest after the season to track improvement.
- Sulfur (S) = 14.6 lb/acre and Zinc (Zn) = 10.7 lb/ac. No S and Zn are recommended based on these results.
Additional comments: The report recommends 40 lb of limestone per 1,000 square feet for vegetables. The horticultural report also emphasizes building organic matter for gardens and crops other than lawns and encourages routine retesting every 2 to 3 years to track progress and refine future fertilizer and lime decisions.
Turning nutrient recommendations into fertilizer products
Recommendations are commonly reported as fertilizer-label nutrient forms (N, P2O5, K2O, and S). To estimate the product needed, divide the recommended nutrient rate by the fertilizer grade fraction. Convert the grade percent to a fraction (e.g., 60% = 0.60) before dividing.
Common quick conversions to calculate the amount of product to apply:
- Urea (46-0-0): lb product = lb N / 0.46
- MAP (11-52-0): lb product = lb P2O5 / 0.52
- DAP (18-46-0): lb product = lb P2O5 / 0.46
- TSP (0-46-0): lb product = lb P2O5 / 0.46
- Potash (0-0-60): lb product = lb K2O / 0.60
- Gypsum (0-0-0-17S): lb product = lb S / 0.17
For gardens, recommendations may be expressed as lb per 1,000 square feet. To scale, multiply the rate by your area in square feet ÷ 1,000. To convert to an acre basis, multiply lb per 1,000 square feet by 43.56.
When to use plant (tissue) testing with soil tests
Soil tests estimate nutrient supply potential. Plant tissue tests reflect what nutrients are present in the crop. Tissue testing is useful when fields show uneven growth, chlorosis, stunting, or suspected nutrient deficiency. They indicate when a field or horticultural crop micronutrient response probability is uncertain. A practical diagnostic approach is paired sampling. Sample a healthy area and a problem area for soil and tissue, and then compare the results.
Retesting frequency and tracking trends
Retesting every 2 to 3 years is a common interval for many systems. Sampling at least once per rotation is a practical benchmark for field crops such as corn-soybean. To make year-to-year comparisons meaningful, keep sampling depth, timing, and method consistent. If management changes substantially (new manure program, major liming, conversion to no-till, new irrigation), more frequent retesting may be warranted.
If your report recommends no P2O5 or no K2O, consider more frequent retesting to determine when maintenance fertilizer should be applied.
Resources and contacts
For help interpreting results, choosing tests, or discussing high-volume submissions, contact:
- MU Soil & Plant Testing Laboratory: soiltestingservices@missouri.edu | 573-882-0623
- Field crops and agronomy guidance: contact your local MU Extension agronomy specialists. The local agronomy field specialist for a soil-sampled county is listed at the bottom of the soil test report. For example, Mr. Anthony Ohmes is listed for field crops in Perry County (Soil test report 1)
- Horticultural, lawn, turfgrass, and garden guidance: contact your local MU Extension horticulture specialists. The local horticulture field specialist for a soil-sampled county is listed at the bottom of the soil test report. For example, Ms. Eliza Pessereau is listed for horticultural crops in St. Louis County (Soil test report 2)