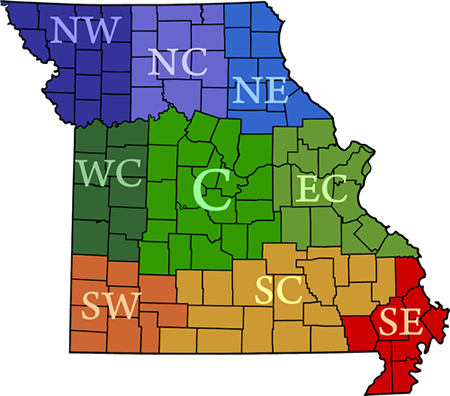
Select the options below to see detailed crop progress information for the entire state of Missouri, state by district, or individual district information.
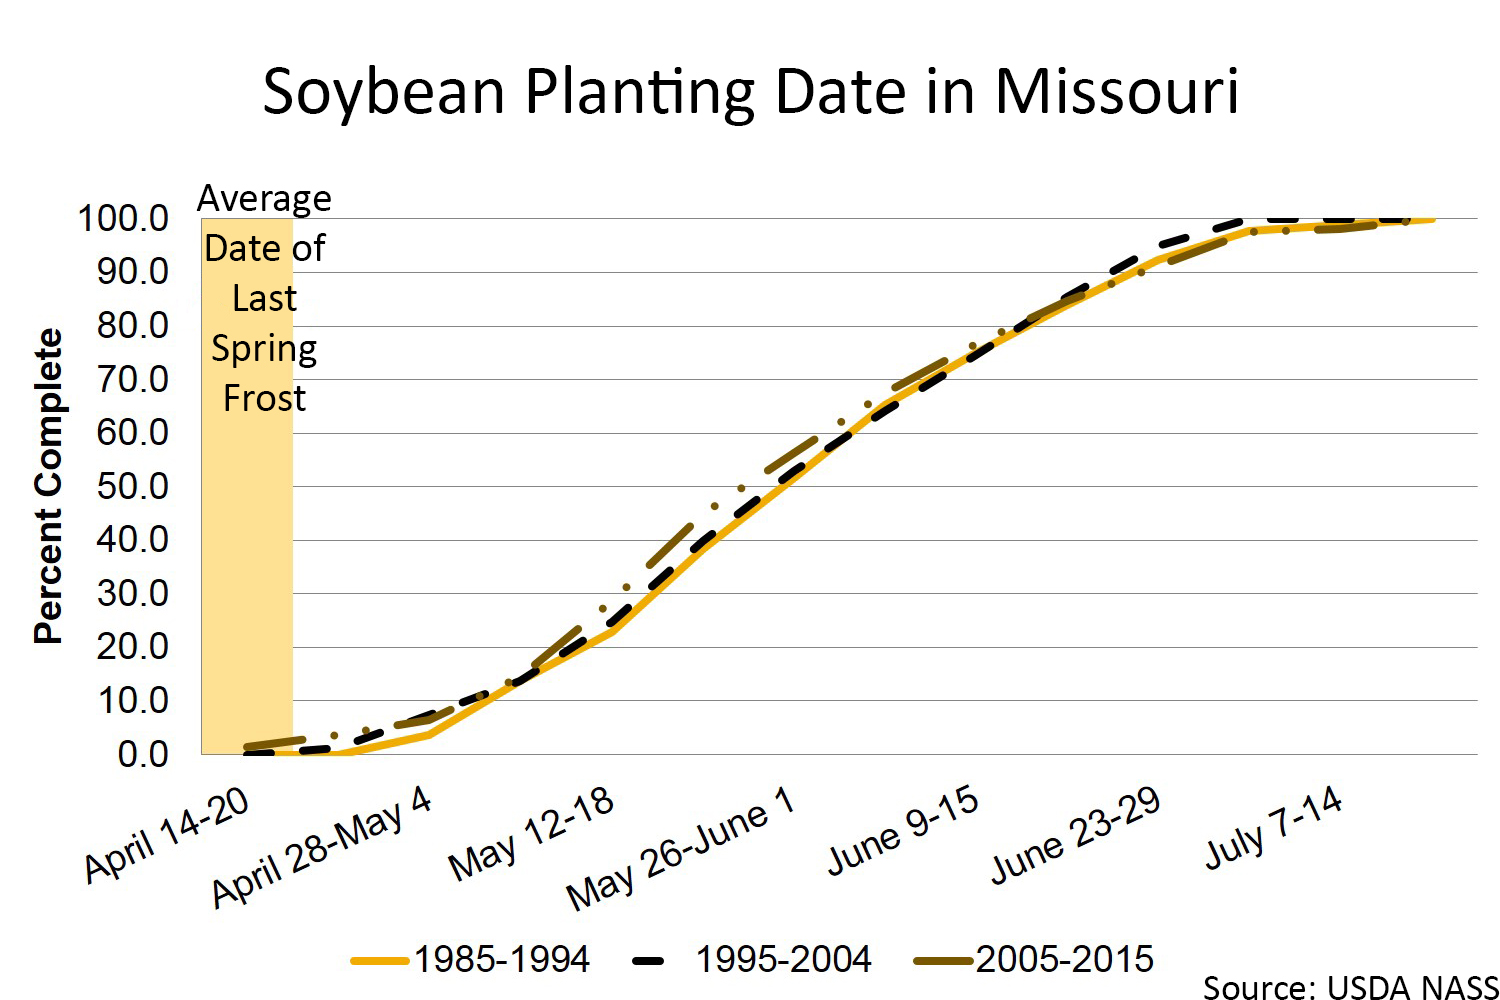
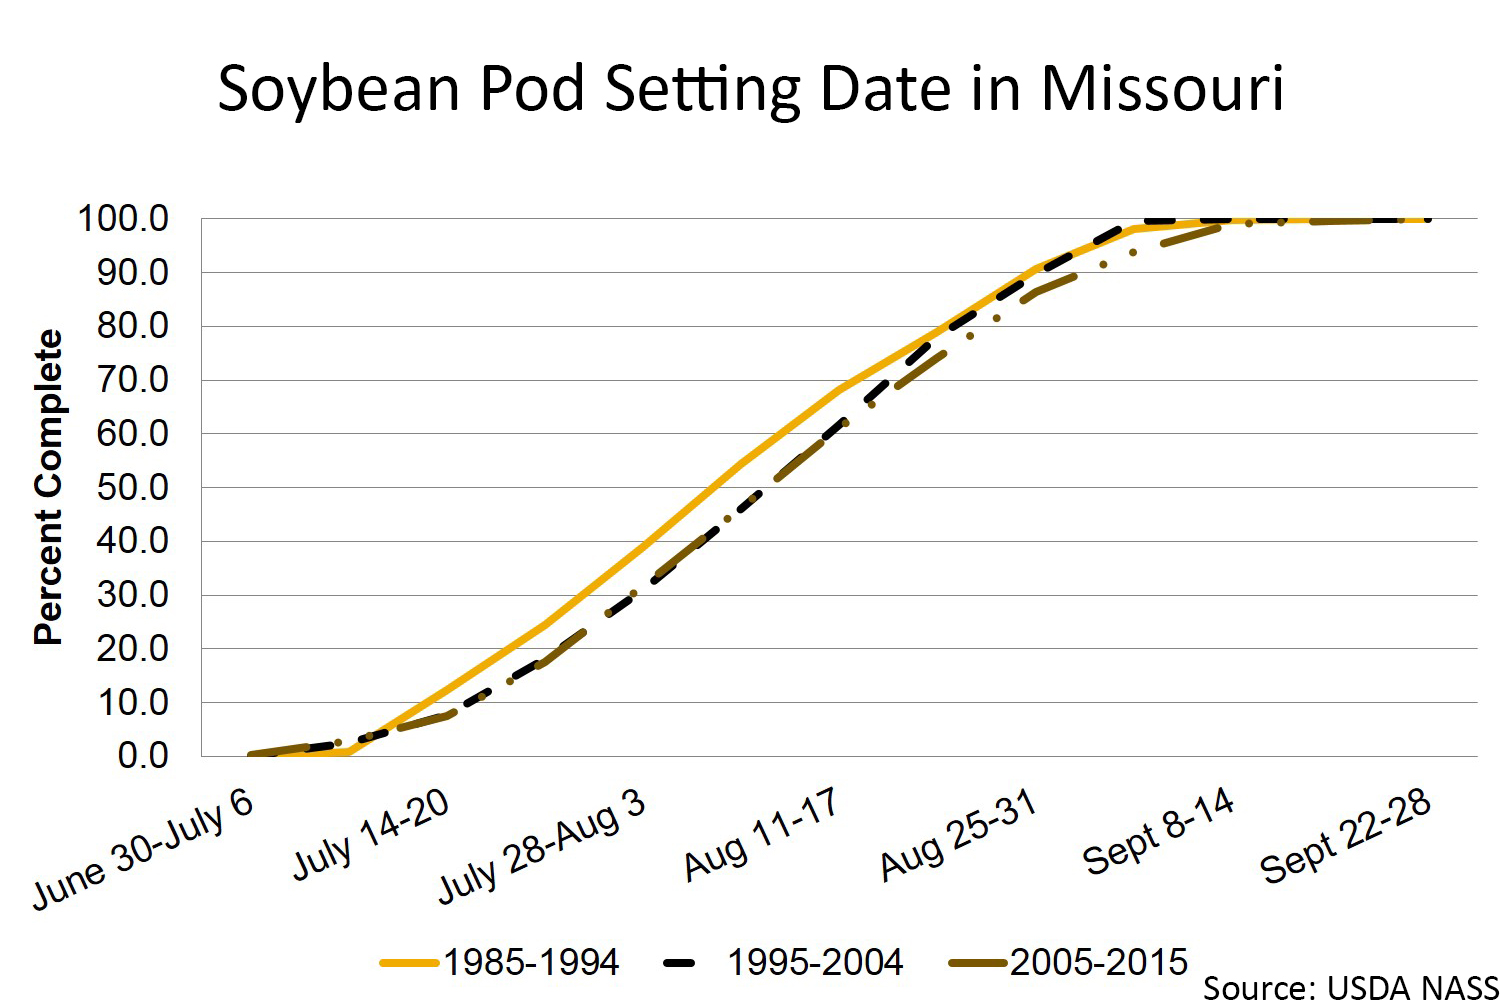
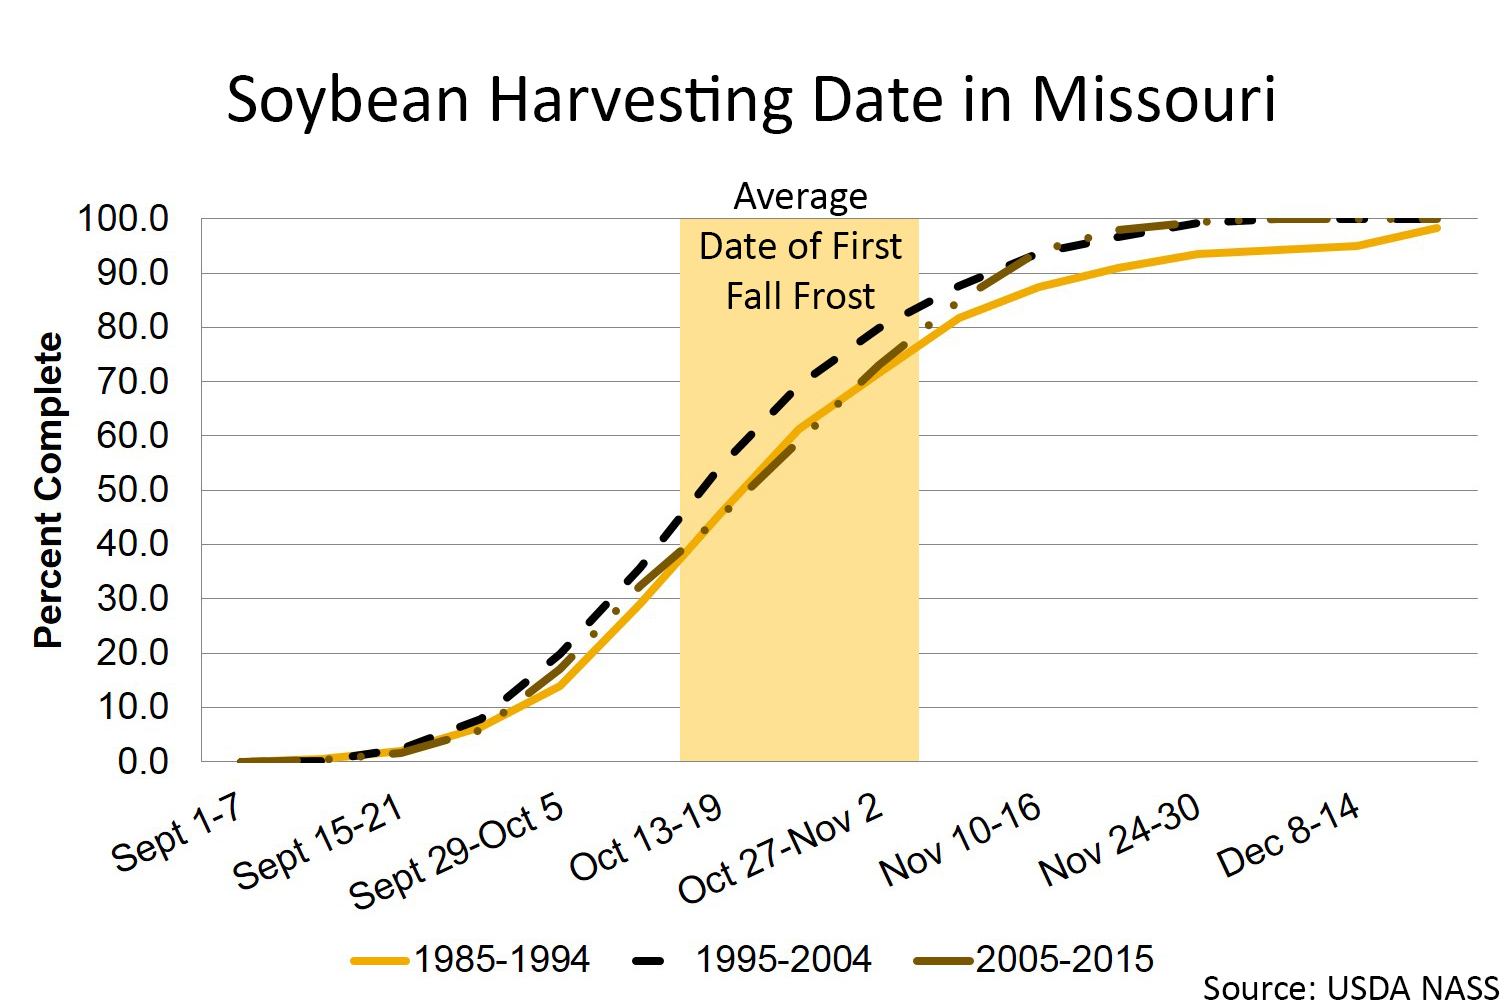
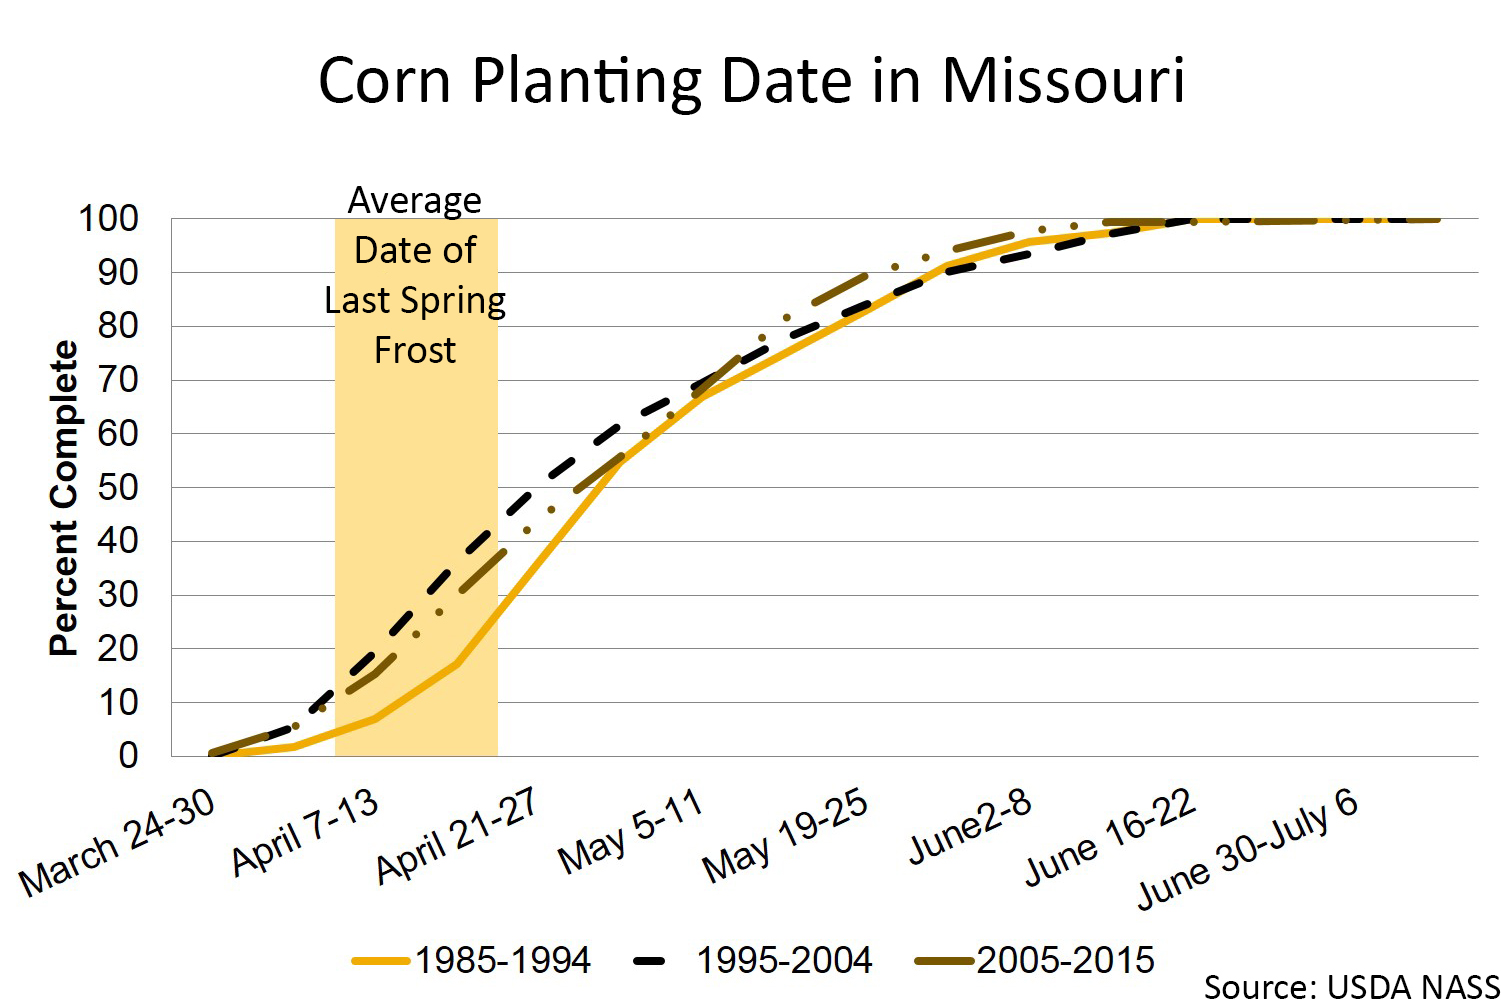
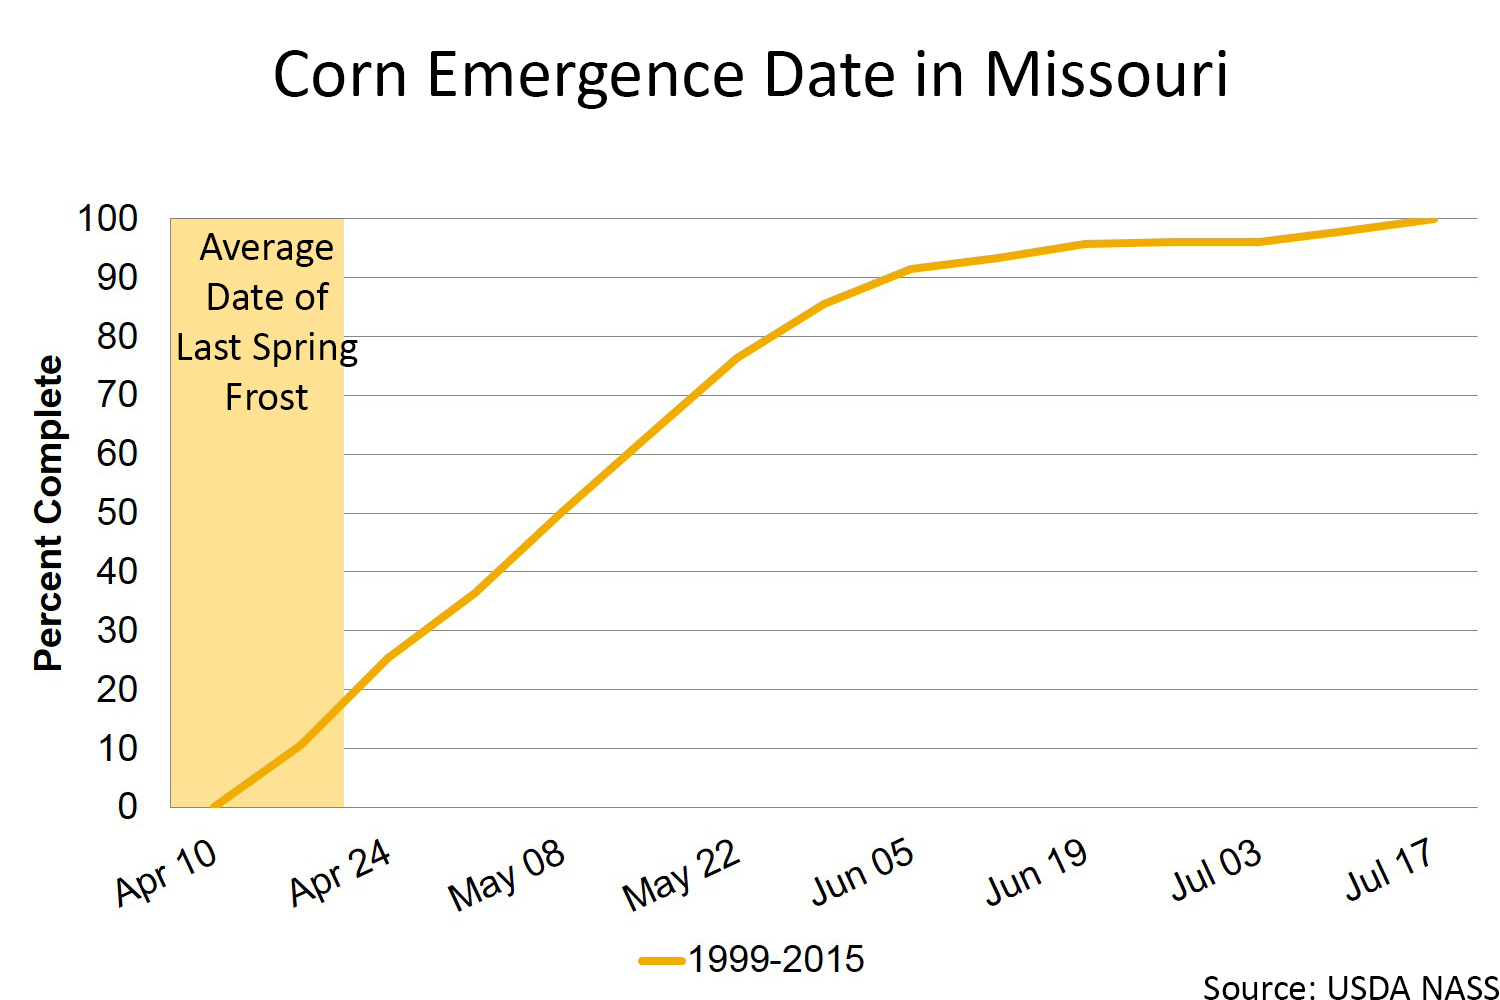
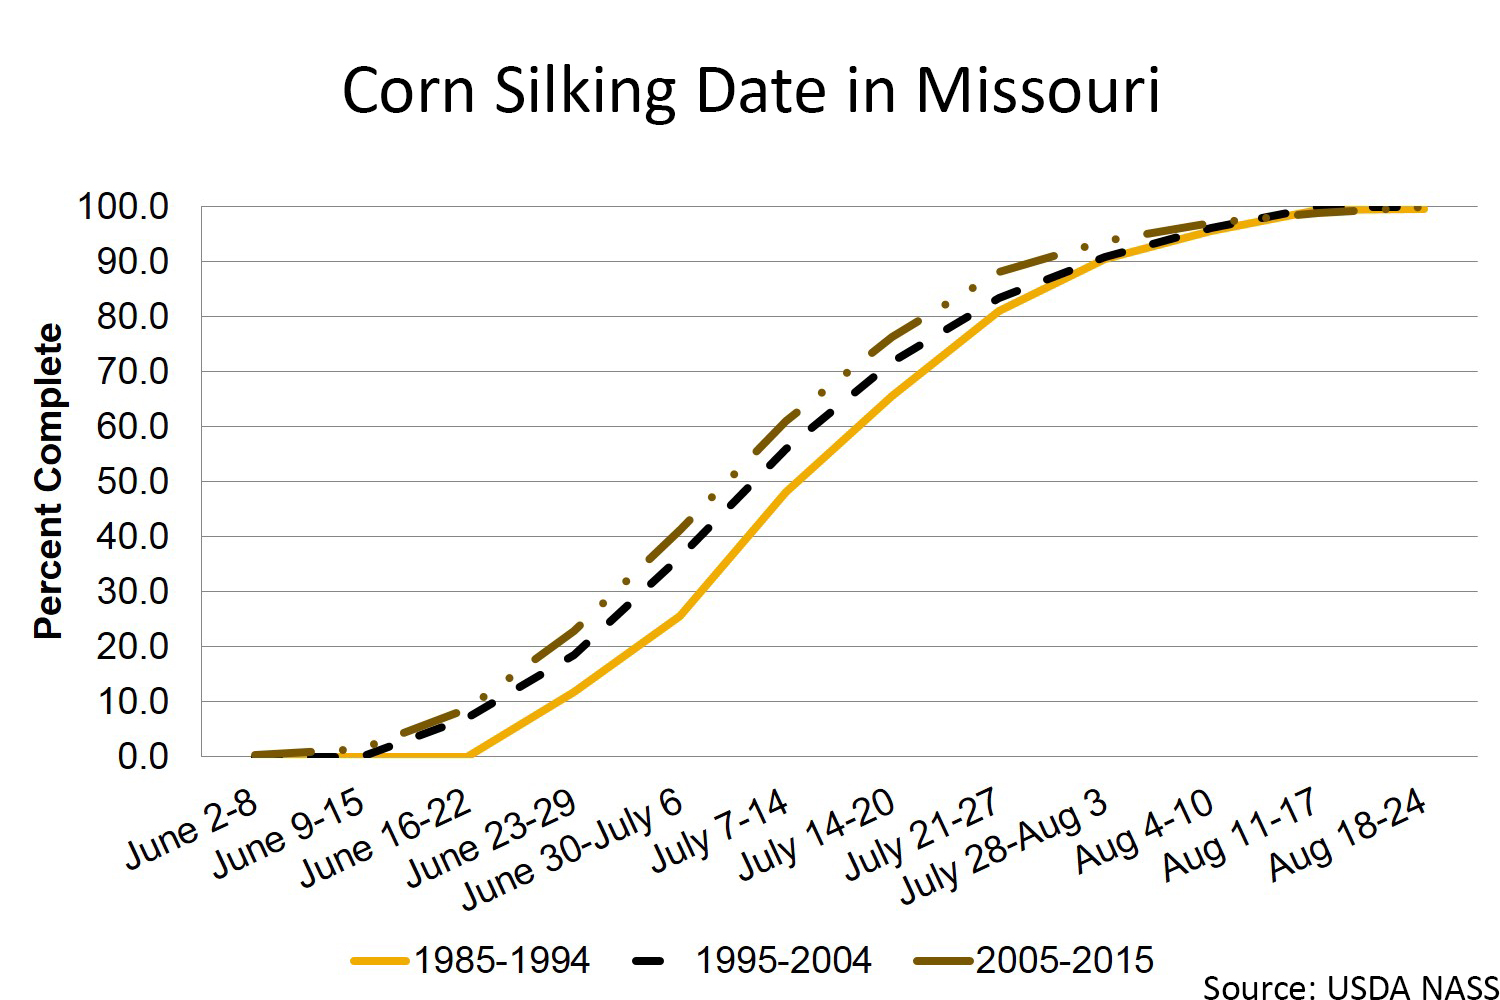
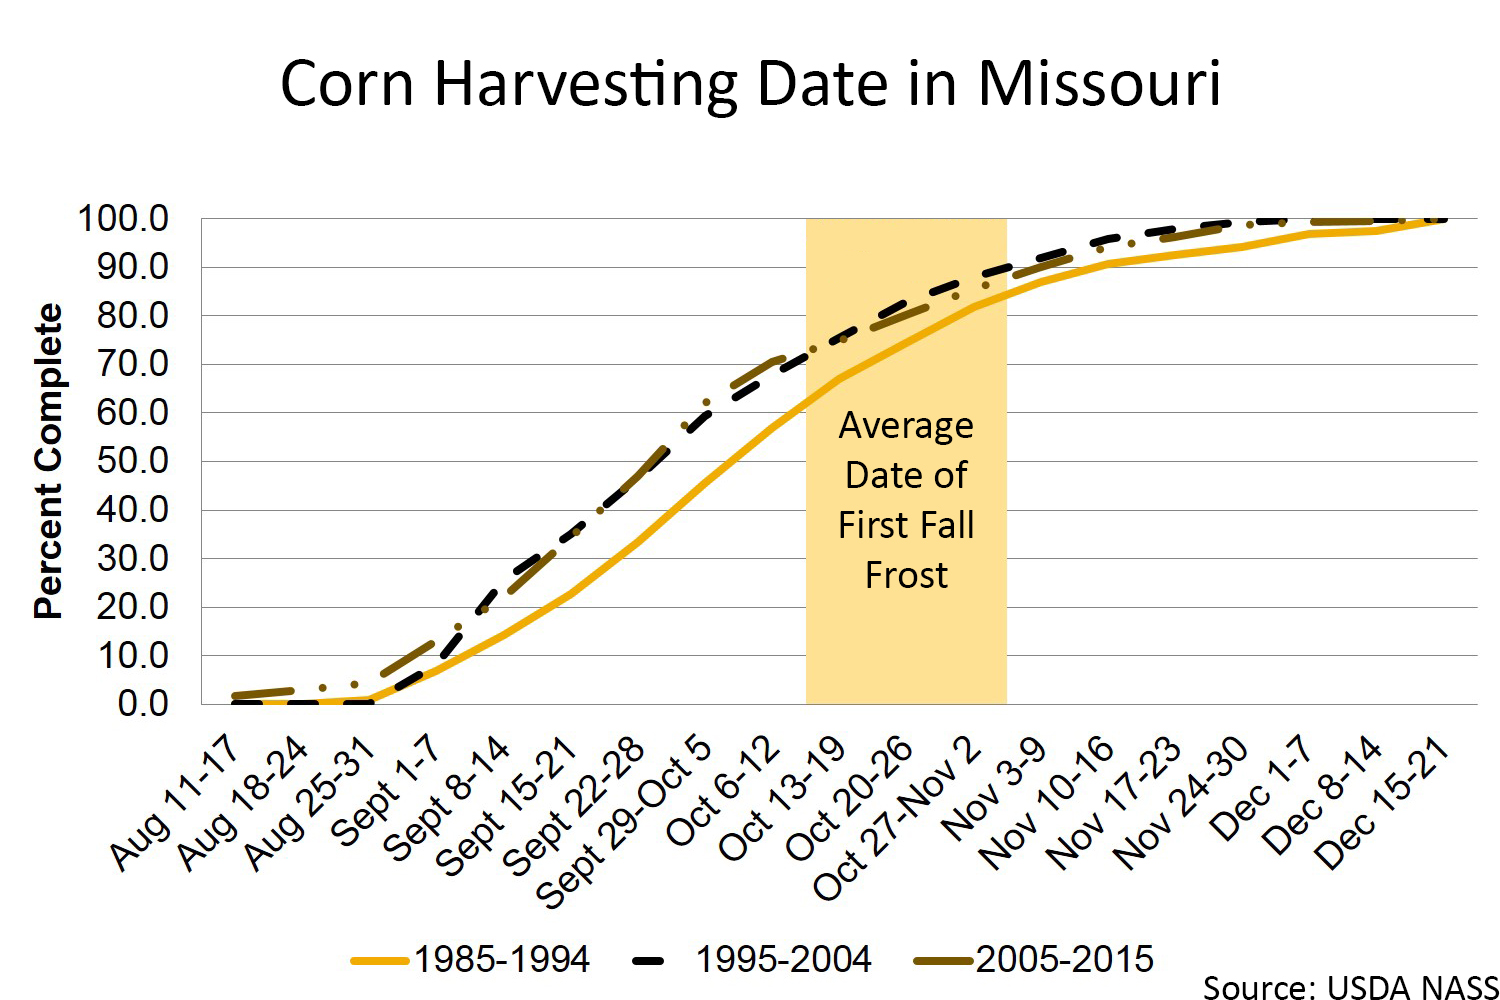
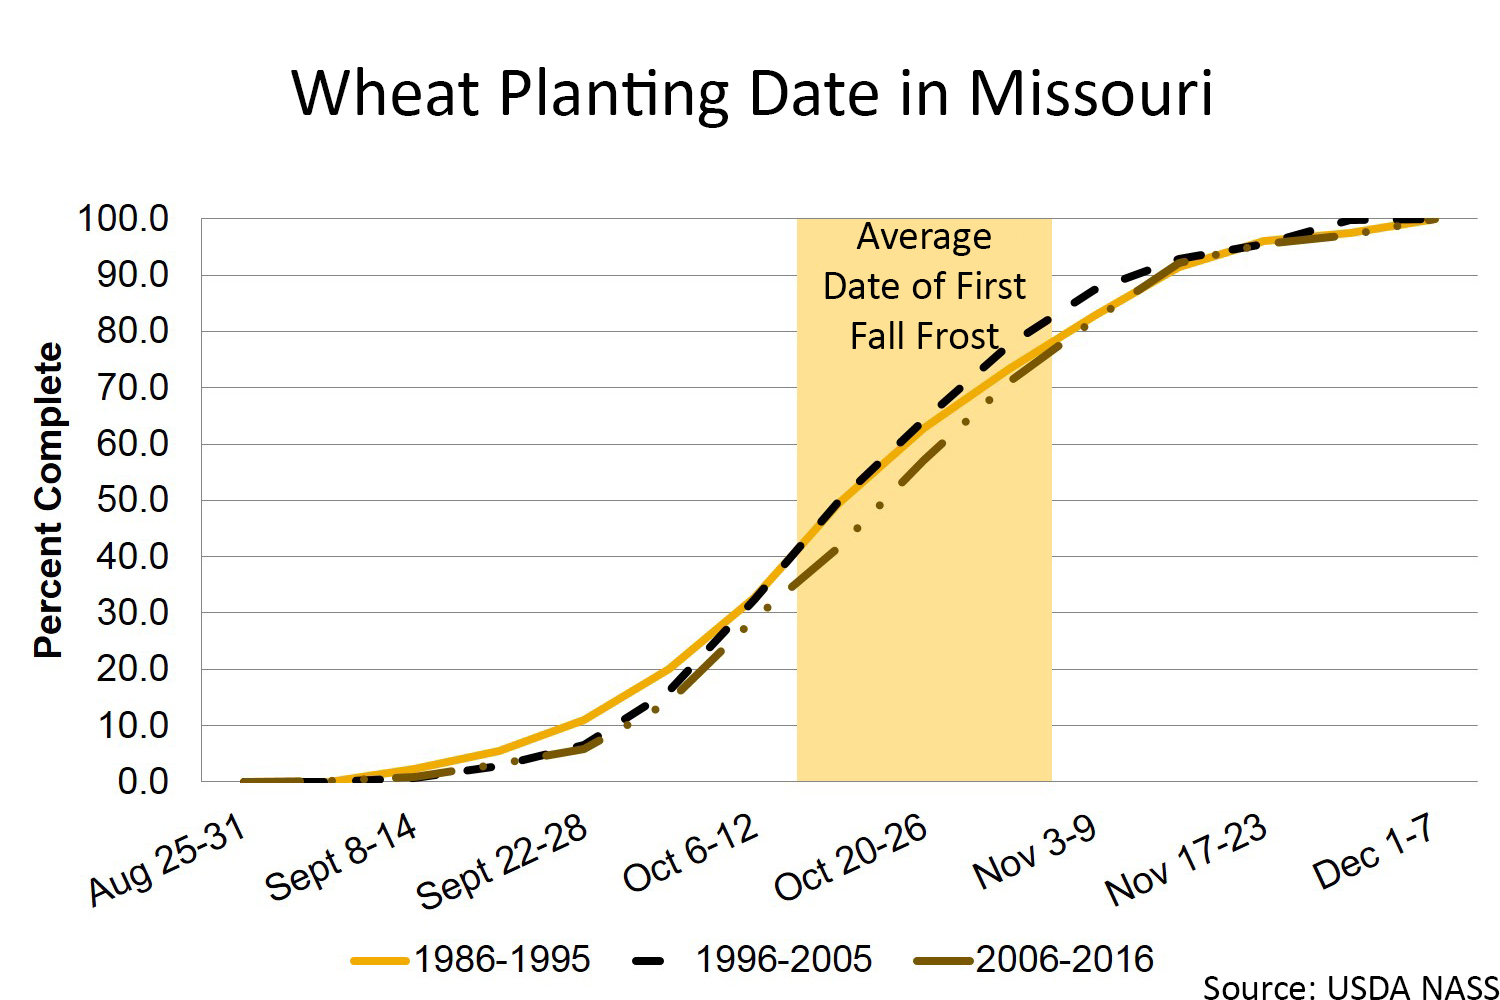
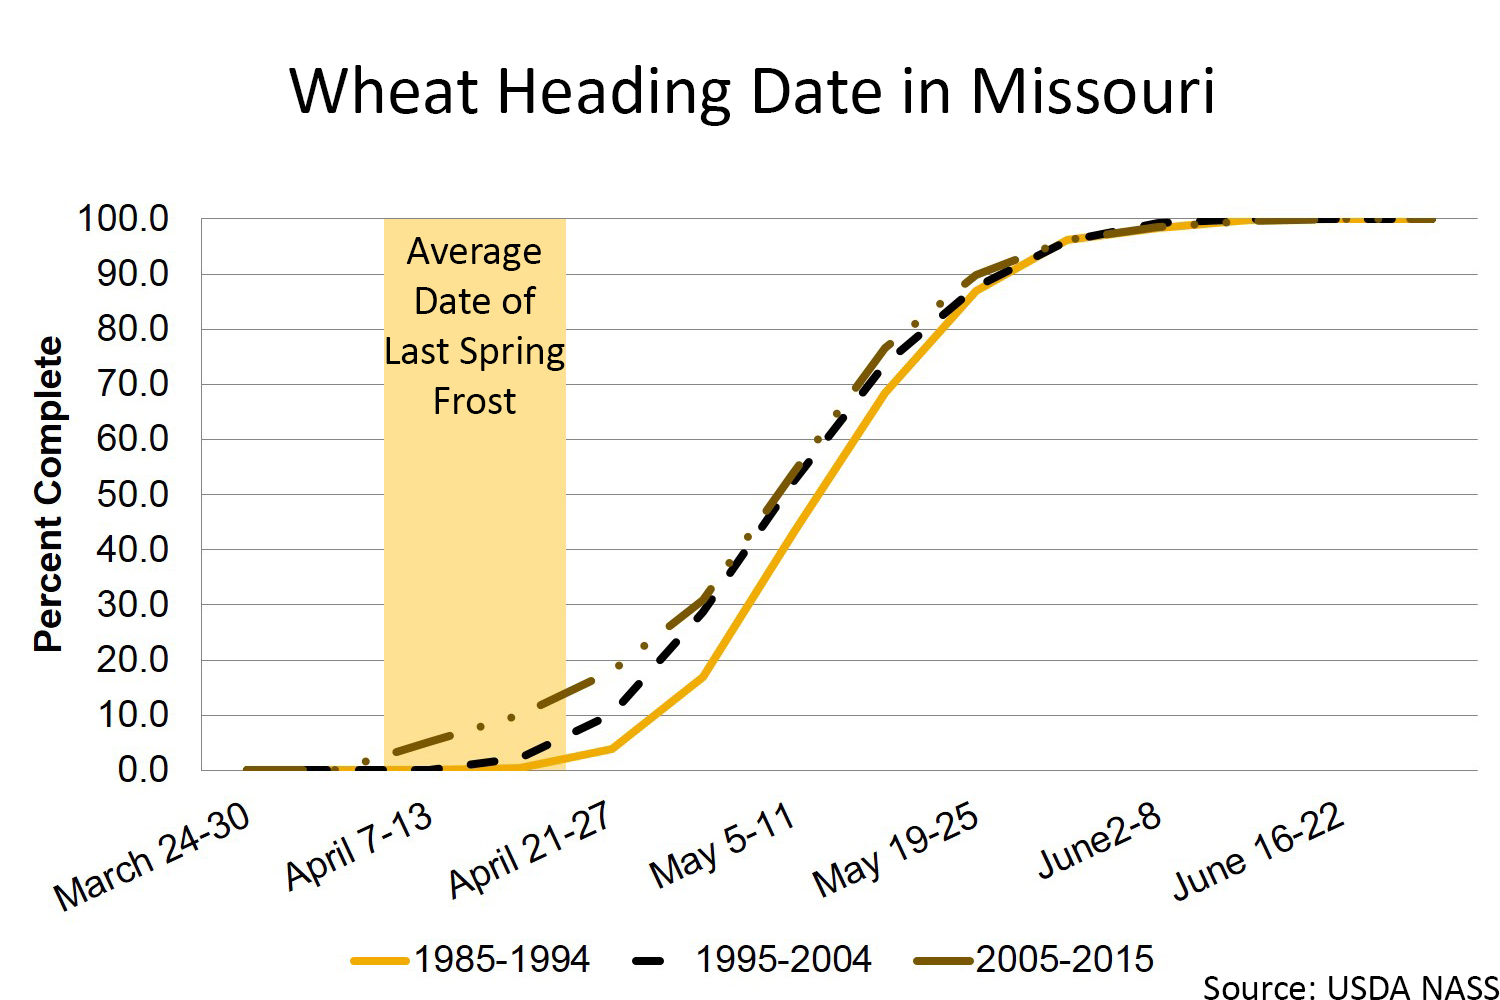
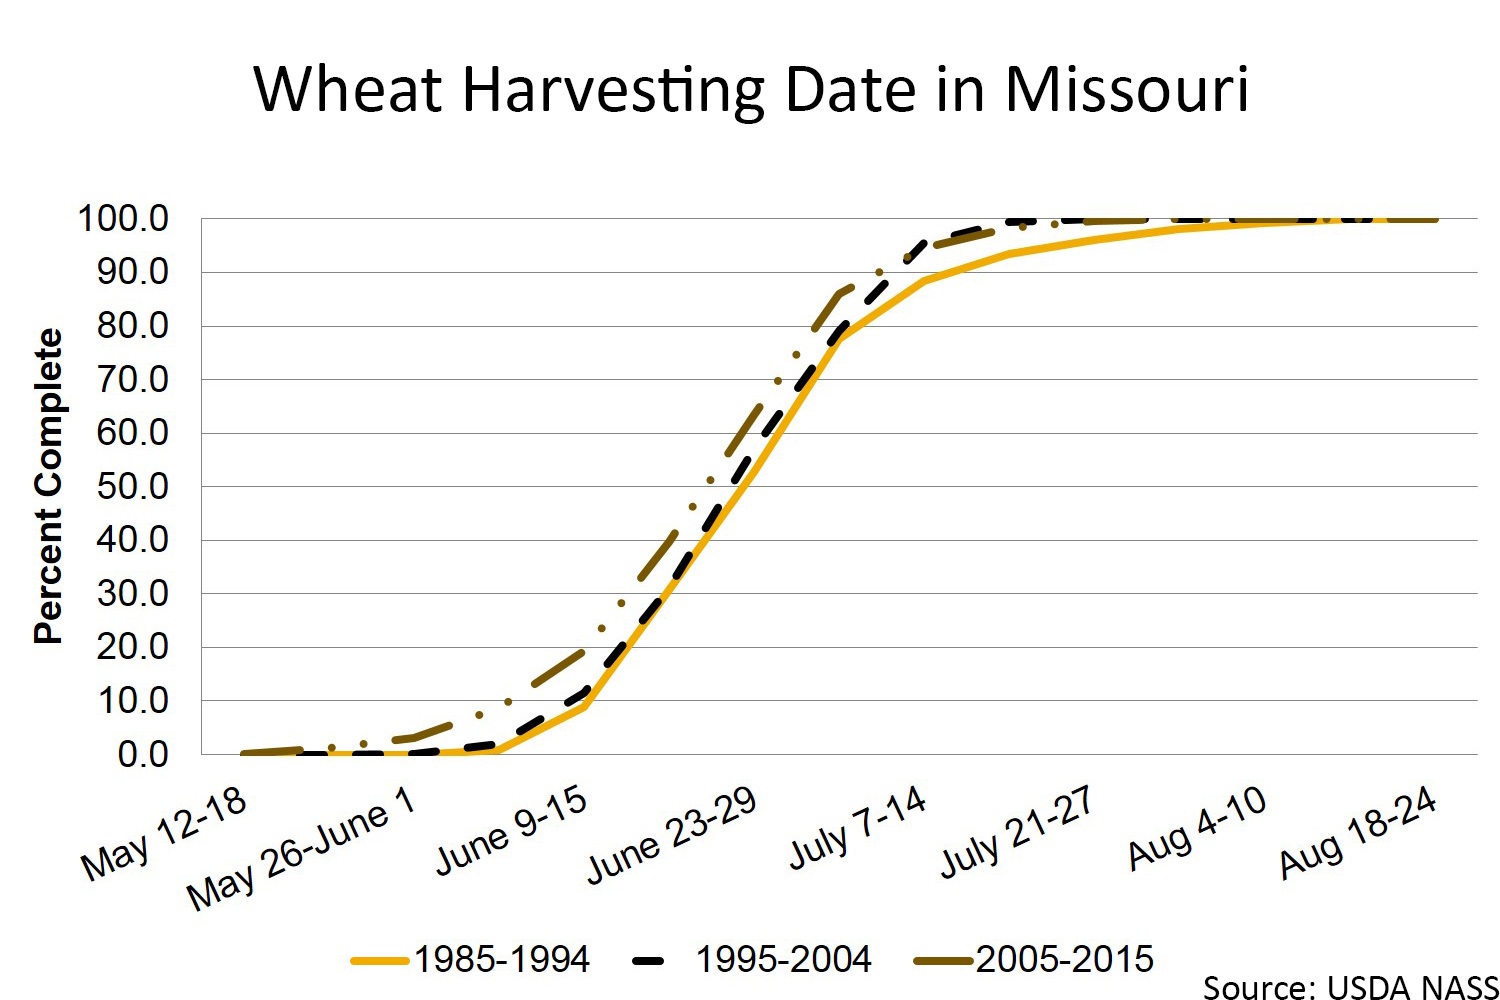
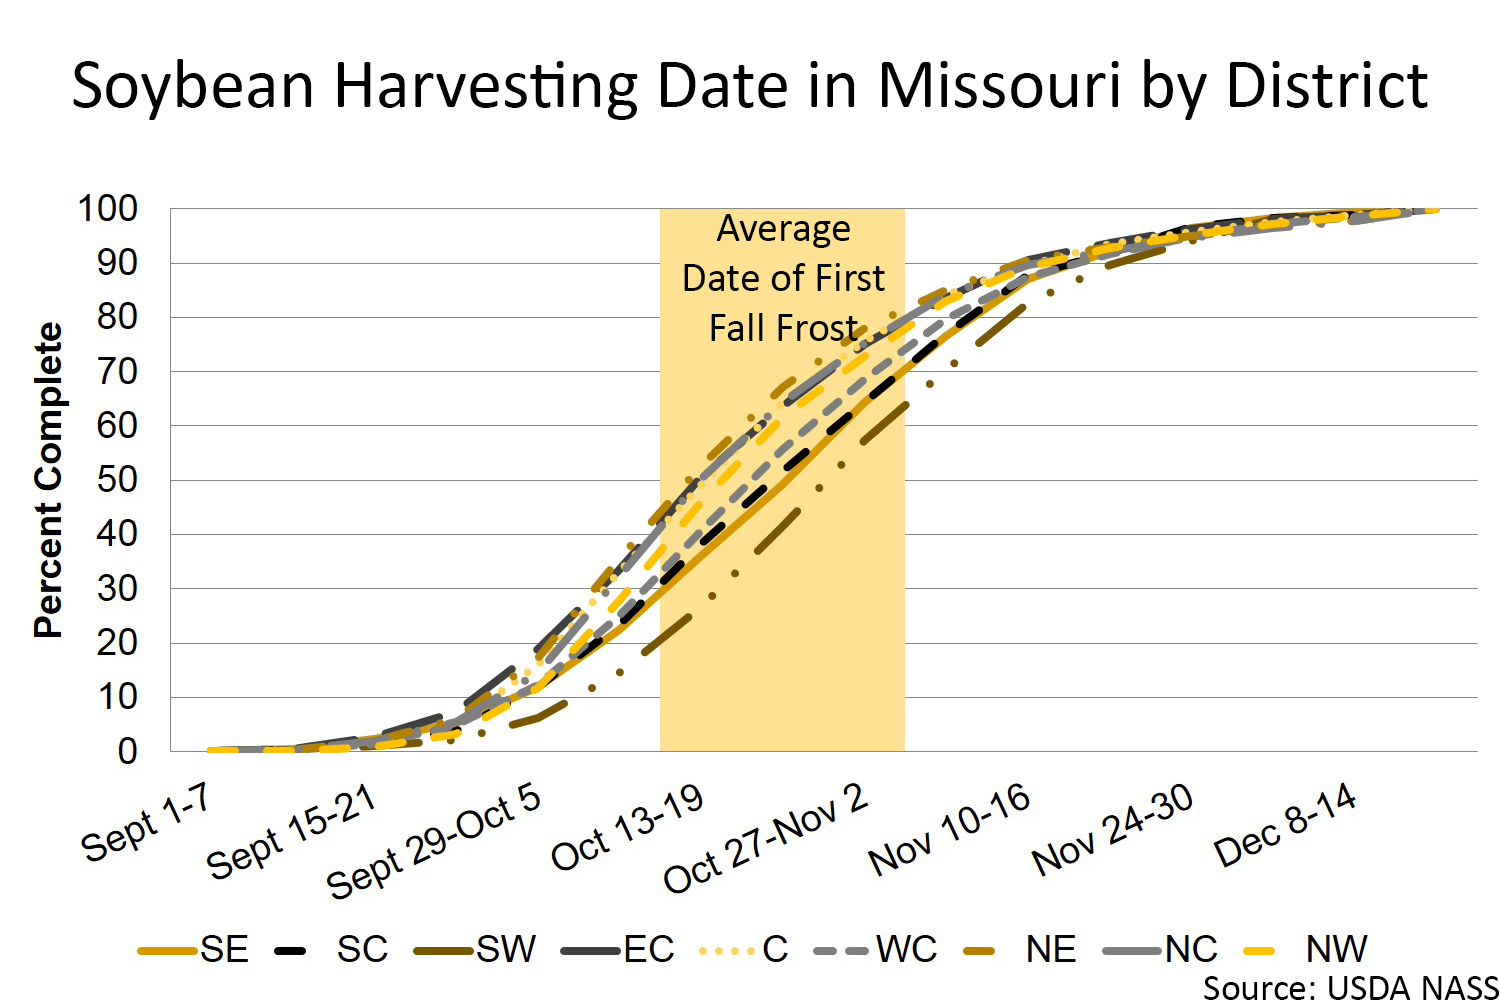
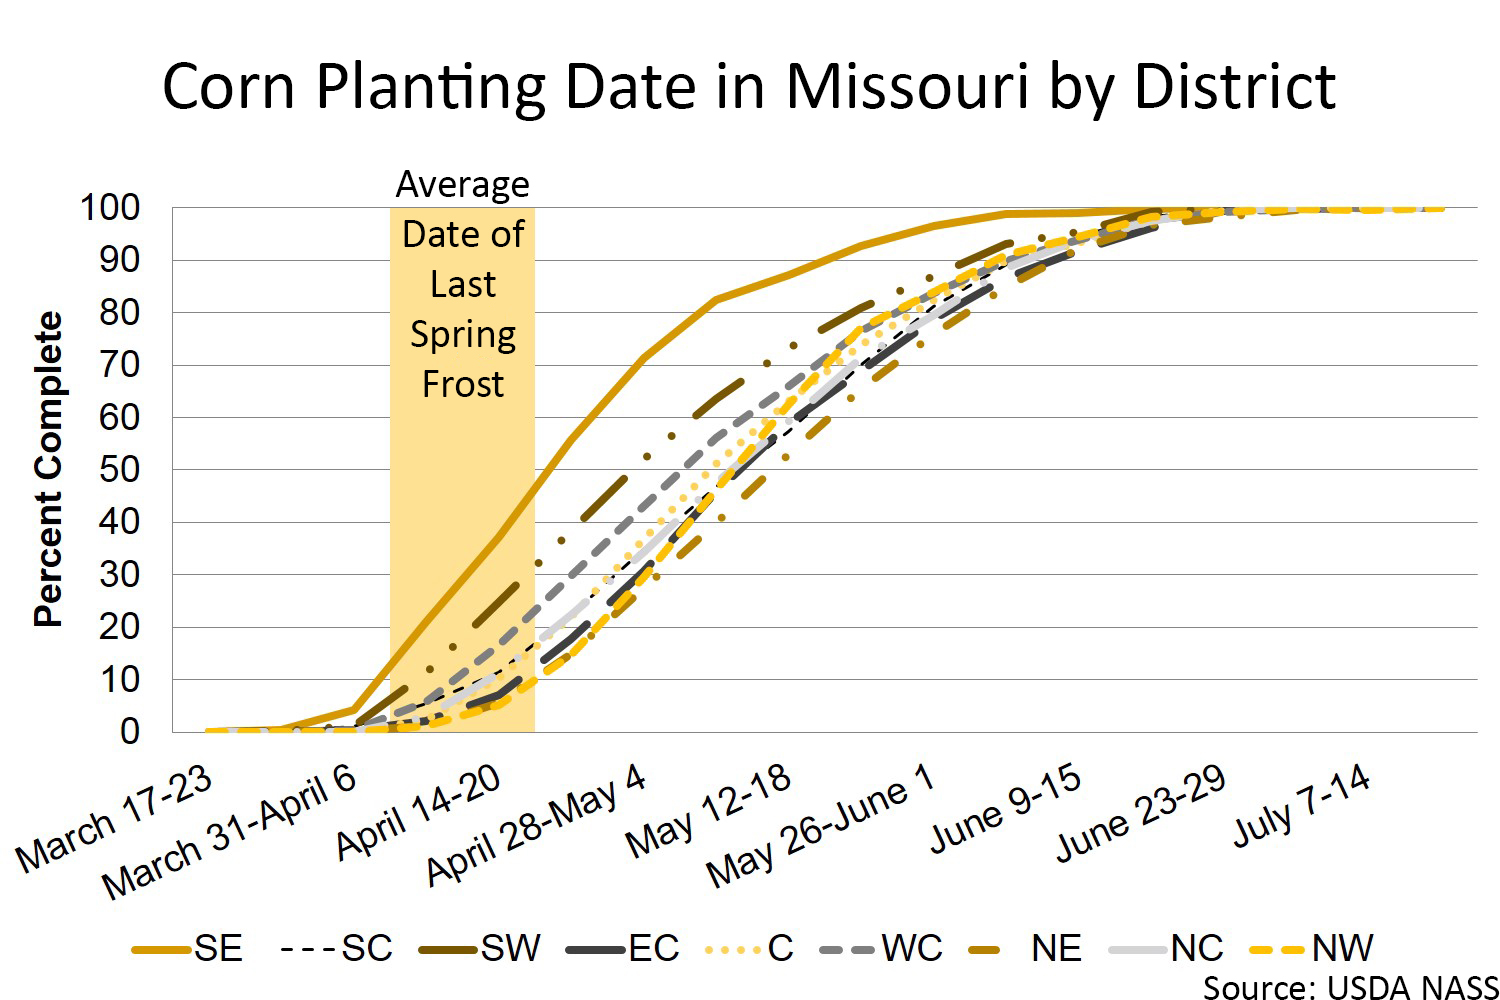
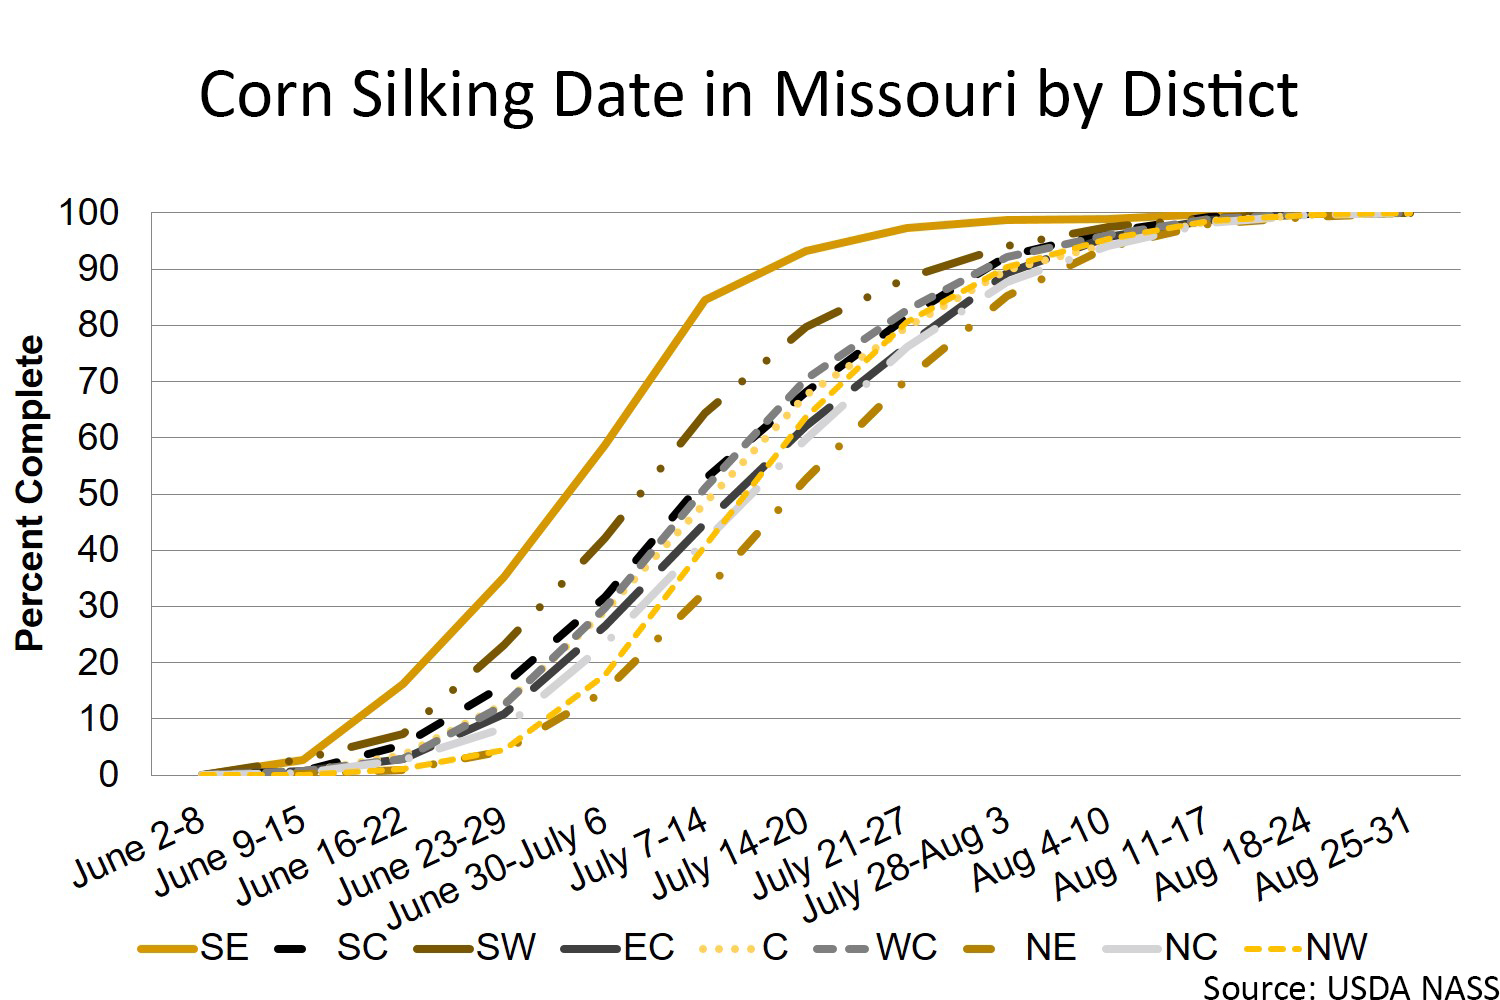
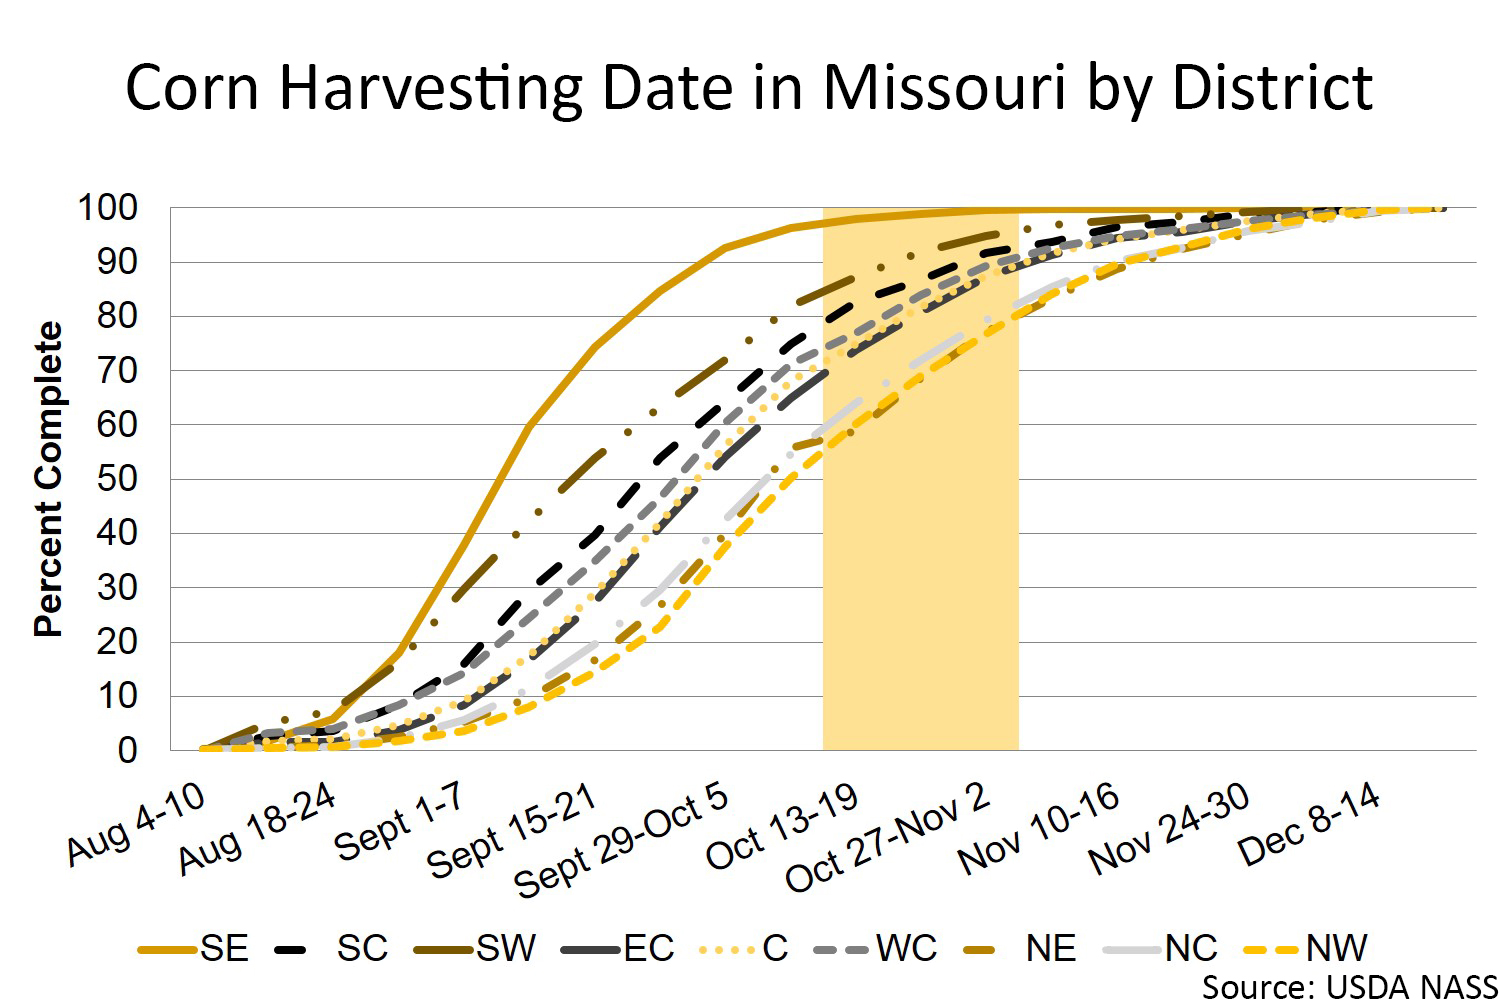
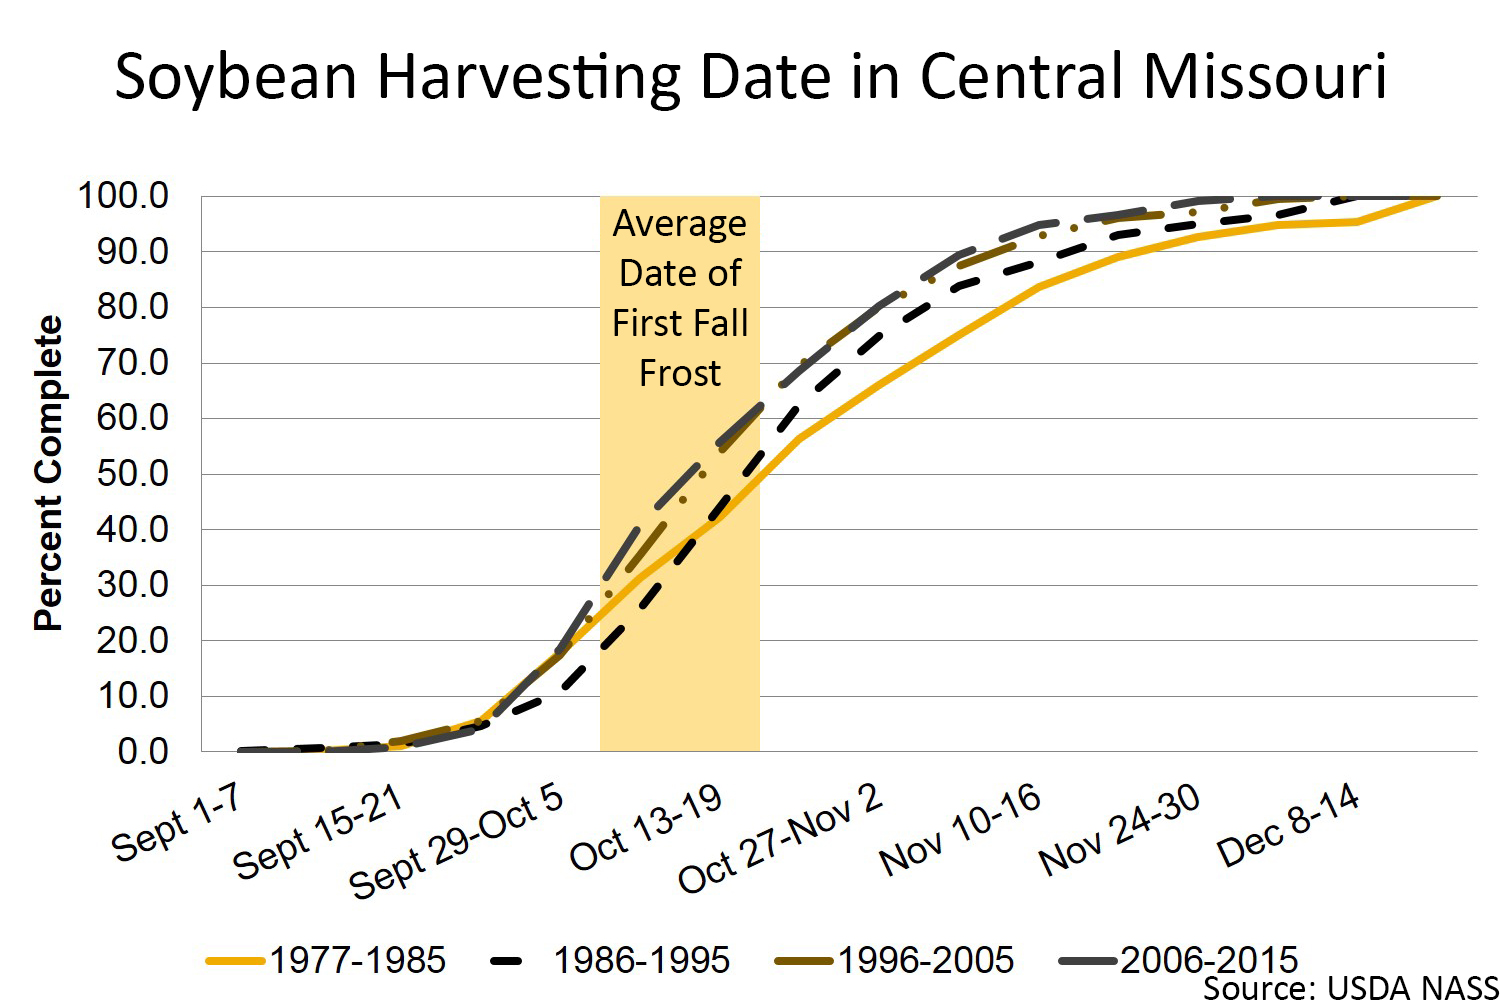
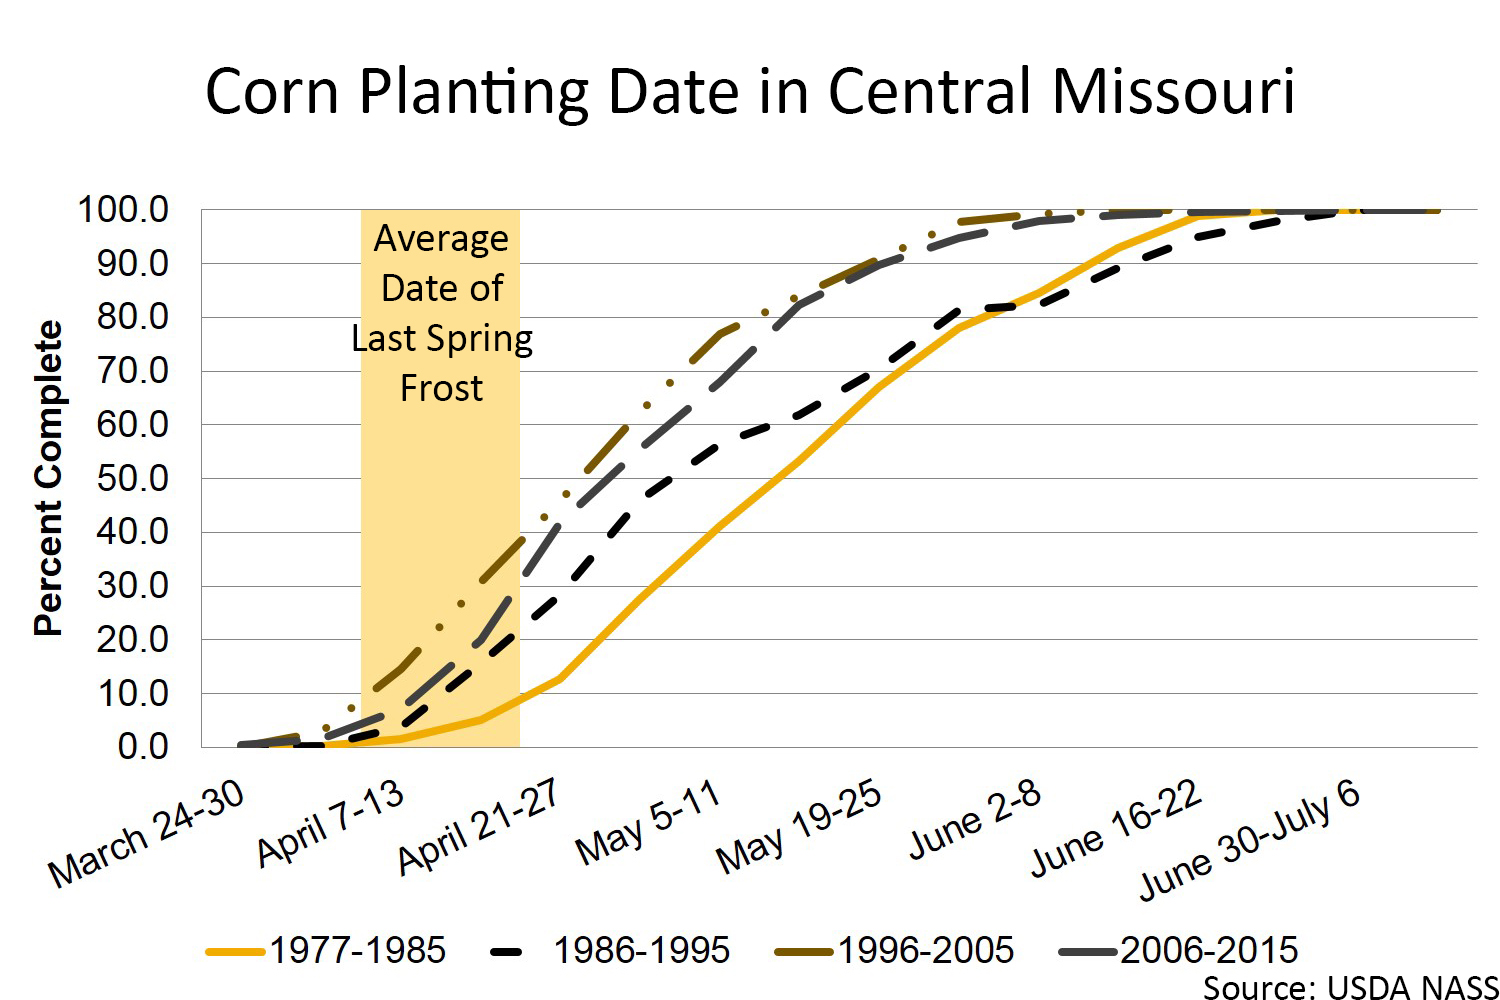
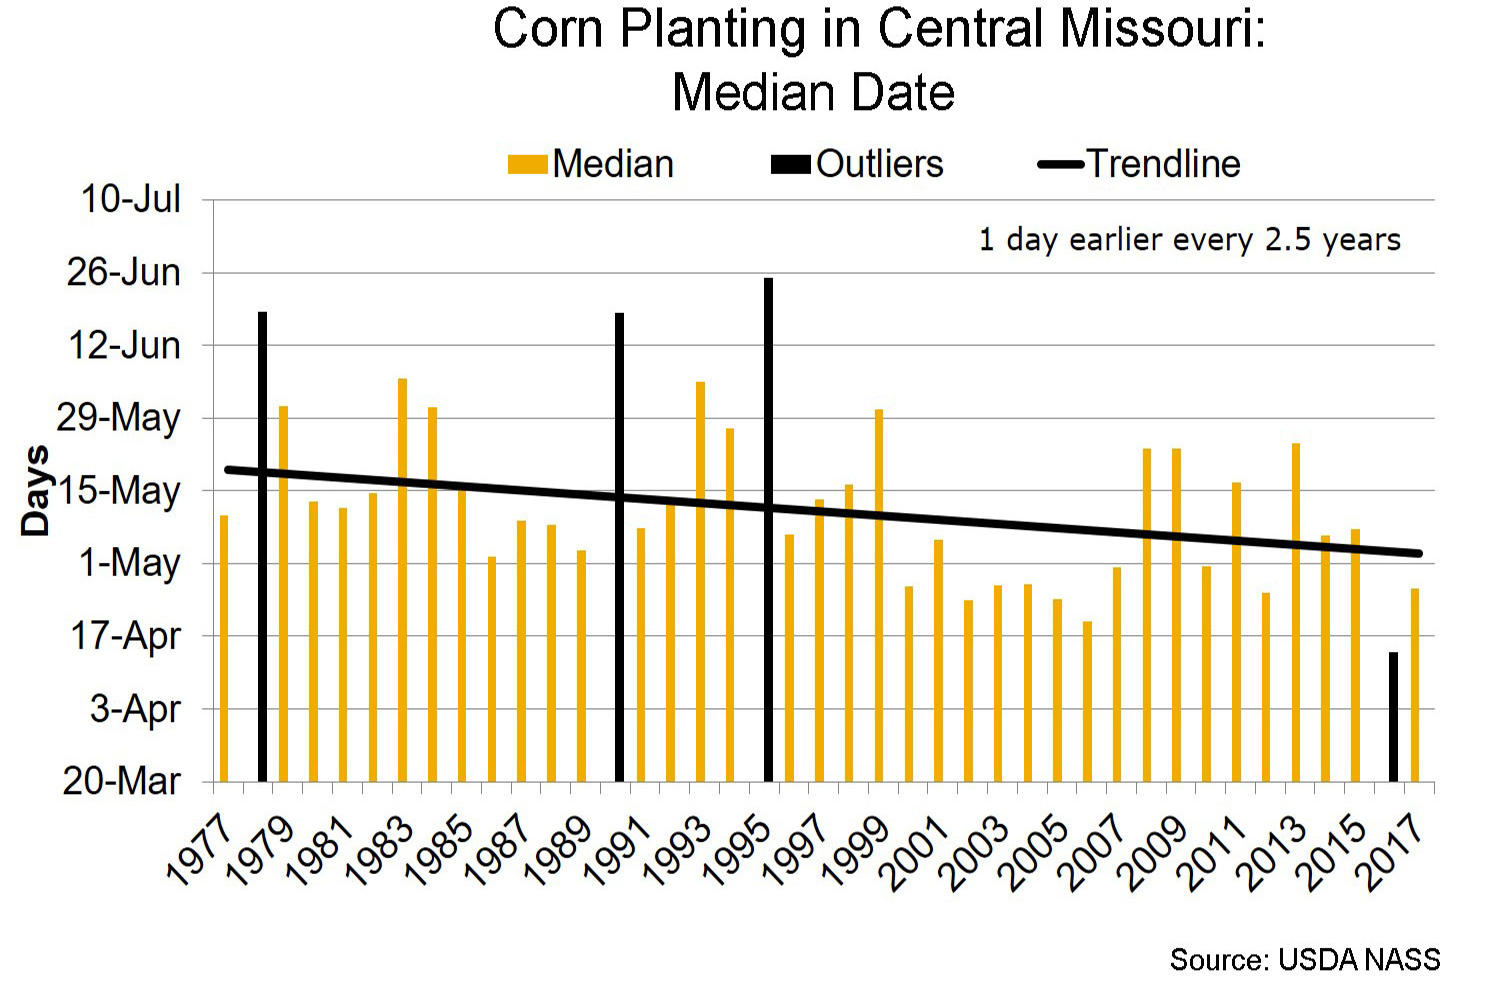
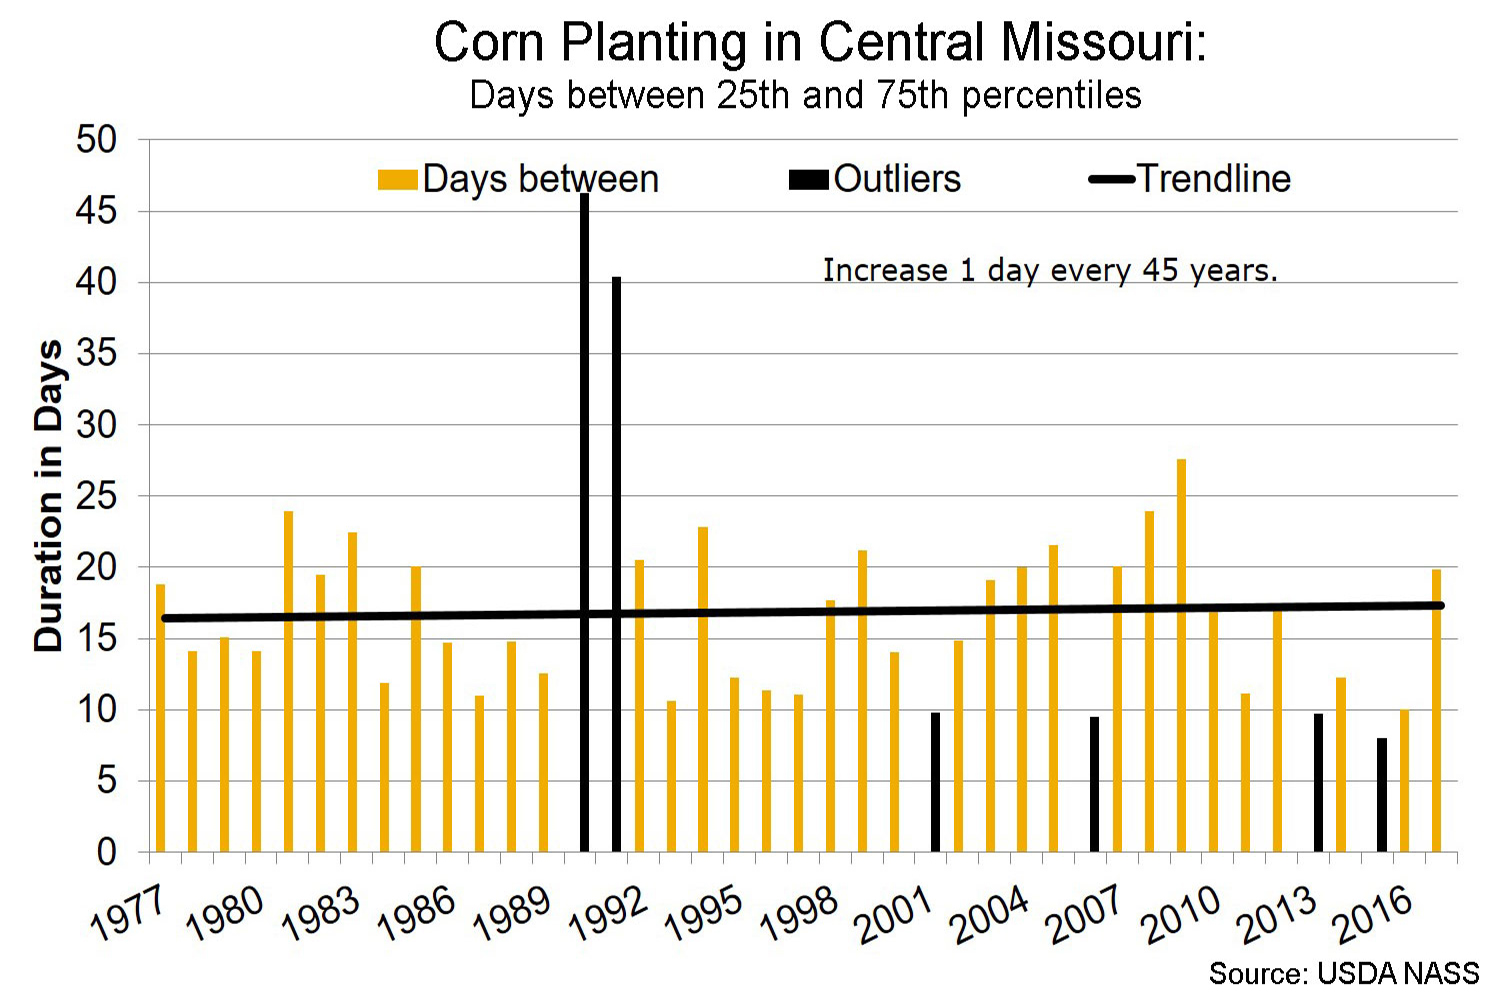
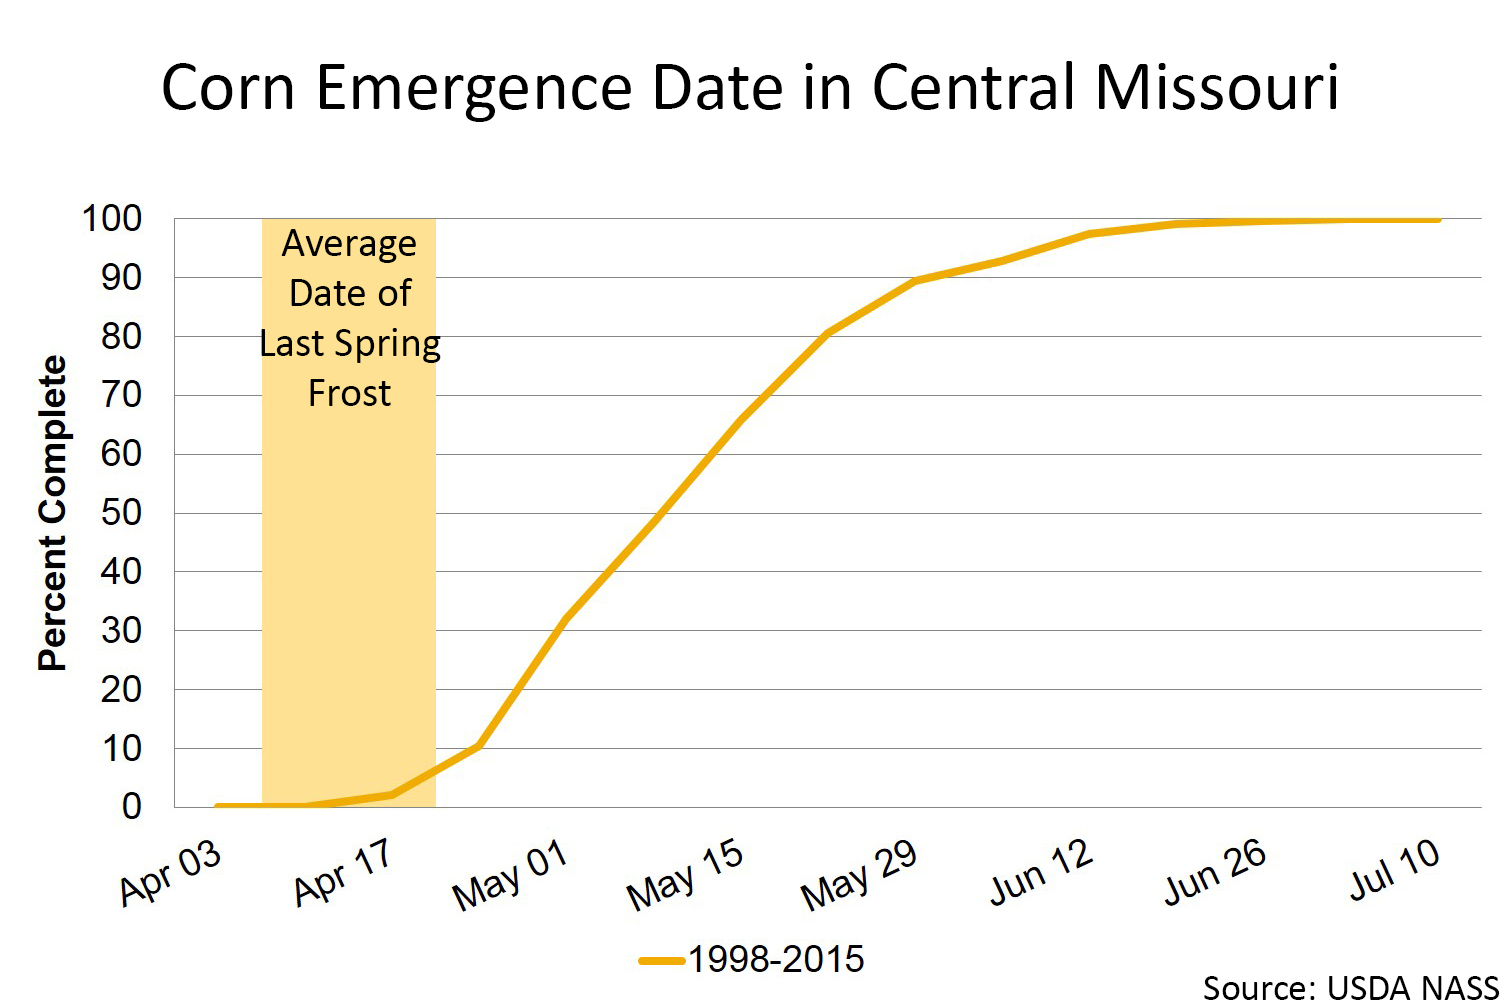
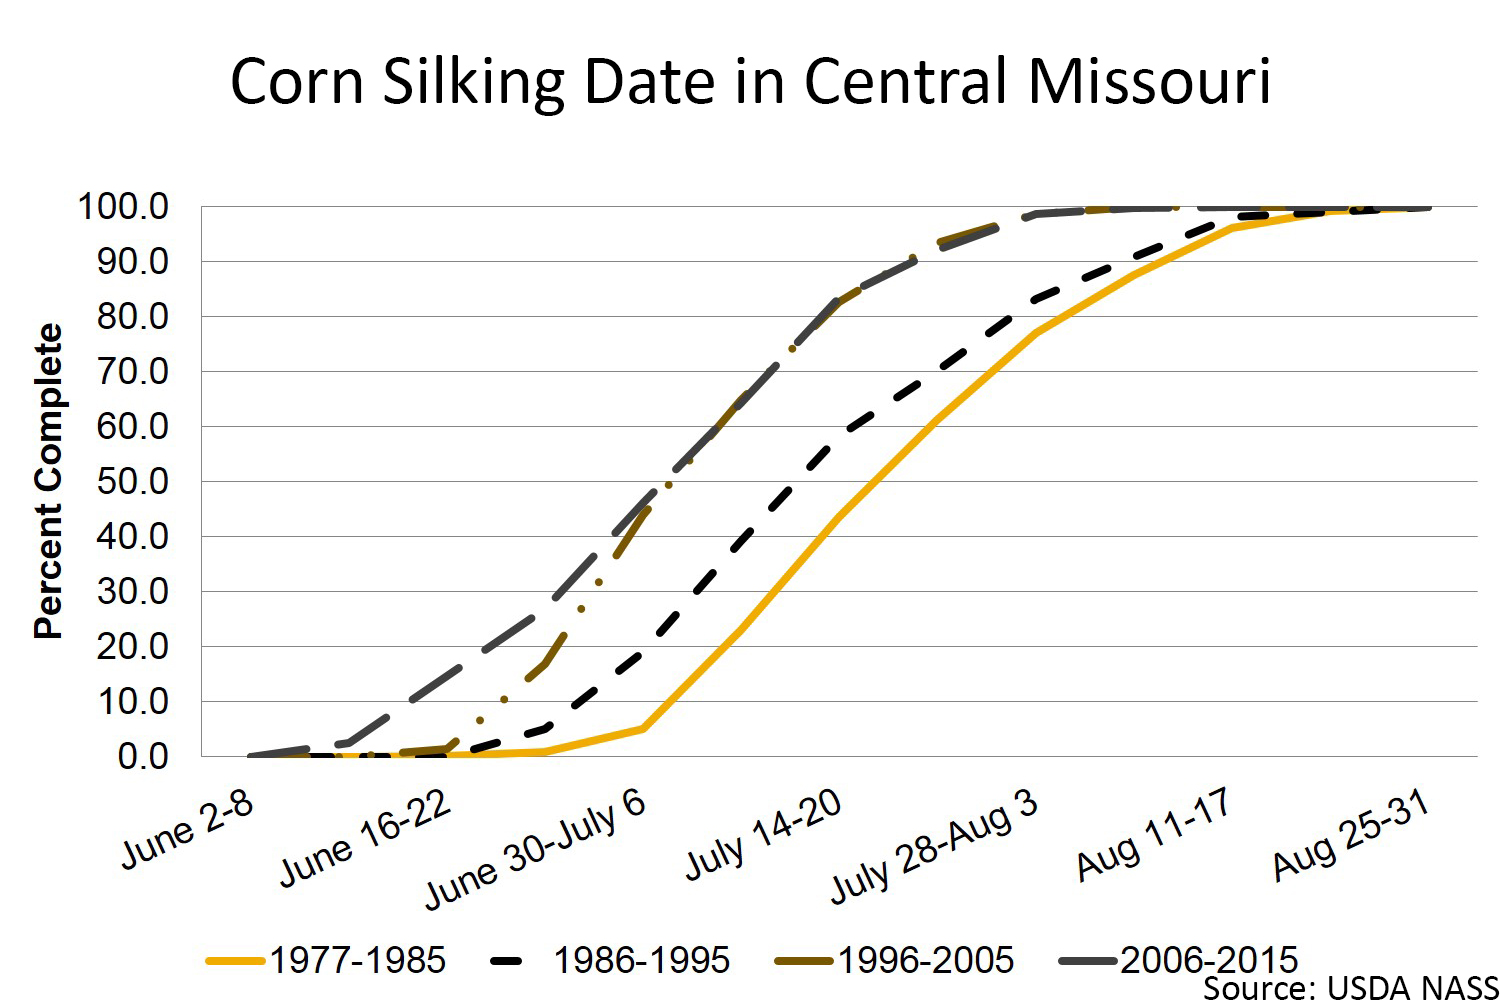
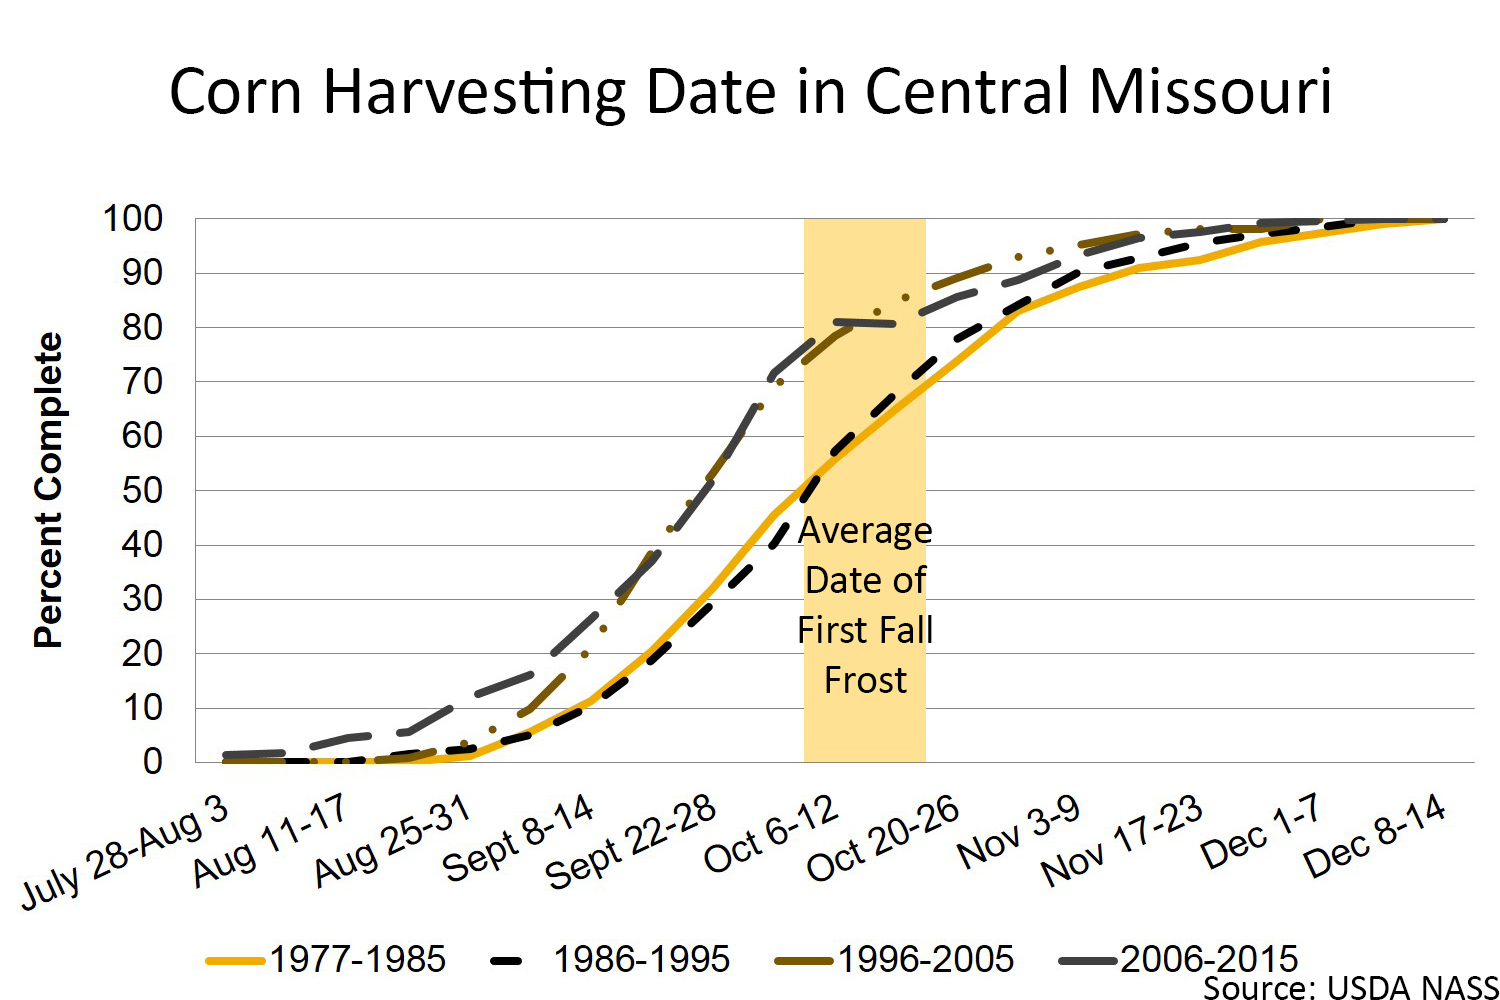
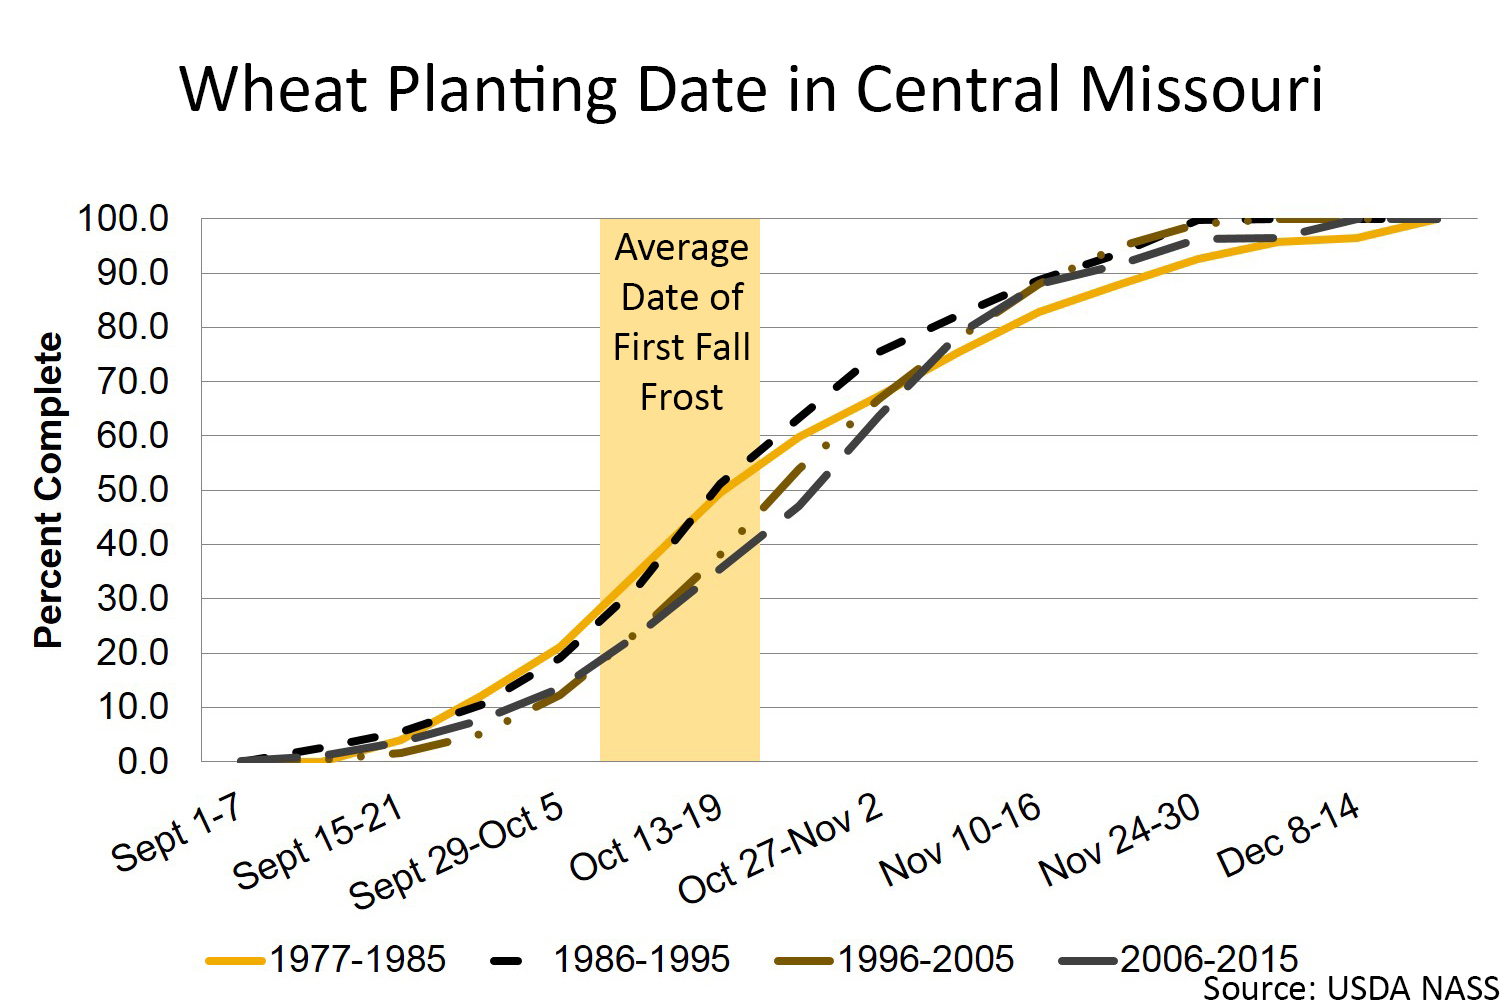
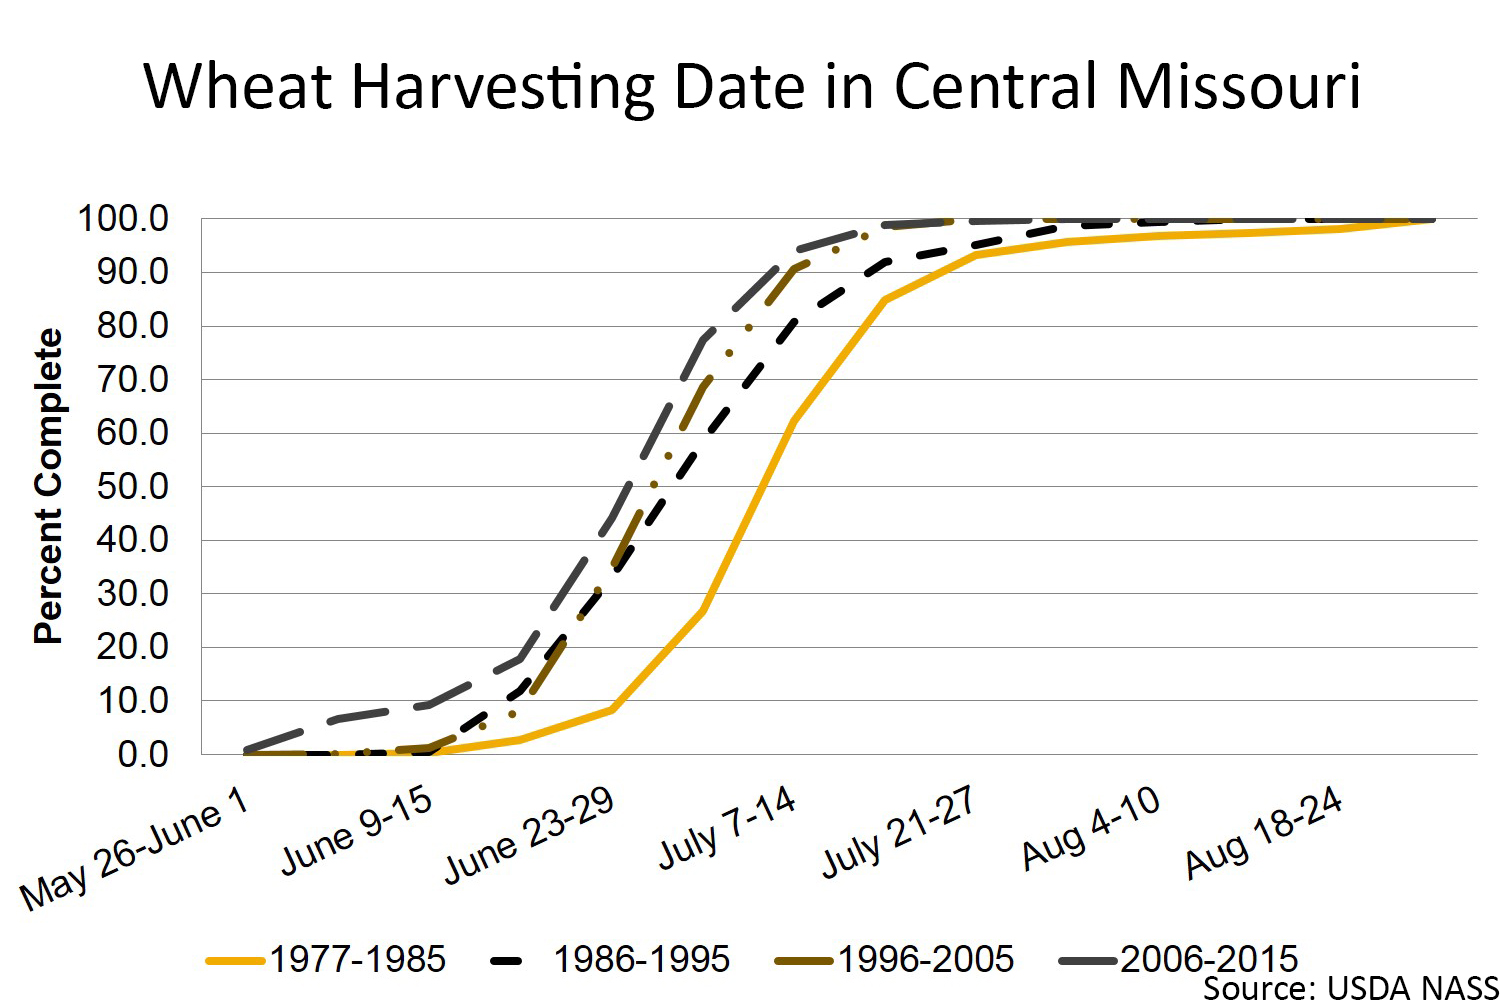
These graphs present the USDA Crop Progress Reports from around 1985 to 2015 for the state of Missouri.
Select the graphs to view a larger image.
Soybean

Corn
Wheat
Statewide field working days
| Week Beginning | 25 percentile | 75 percentile range | Average |
|---|---|---|---|
| 28-Mar | 2.1 | 4.1 | 3.0 |
| 4-Apr | 1.9 | 4.9 | 3.3 |
| 11-Apr | 1.9 | 4.8 | 3.4 |
| 18-Apr | 1.7 | 4.2 | 3.4 |
| 25-Apr | 2.1 | 4.6 | 3.3 |
| 2-May | 1.7 | 4.5 | 3.1 |
| 9-May | 2.0 | 4.5 | 3.4 |
| 16-May | 2.0 | 5.4 | 3.6 |
| 23-May | 2.6 | 4.9 | 3.7 |
| 30-May | 2.9 | 4.9 | 3.8 |
| 6-Jun | 3.1 | 5.1 | 4.2 |
| 13-Jun | 3.0 | 5.7 | 4.2 |
| 20-Jun | 3.6 | 5.8 | 4.7 |
| 27-Jun | 4.1 | 5.7 | 4.8 |
| 4-Jul | 4.4 | 6.0 | 5.1 |
| 11-Jul | 4.5 | 5.9 | 5.1 |
| 18-Jul | 4.9 | 6.3 | 5.5 |
| 25-Jul | 4.6 | 6.3 | 5.3 |
| 1-Aug | 4.2 | 6.3 | 5.2 |
| 8-Aug | 5.0 | 6.3 | 5.6 |
| 15-Aug | 4.7 | 6.2 | 5.4 |
| 22-Aug | 4.8 | 6.4 | 5.4 |
| 29-Aug | 5.0 | 6.5 | 5.5 |
| 5-Sep | 4.8 | 6.4 | 5.5 |
| 12-Sep | 4.7 | 6.3 | 5.3 |
| 19-Sep | 4.6 | 5.8 | 5.1 |
| 26-Sep | 4.1 | 6.3 | 5.2 |
| 3-Oct | 4.7 | 6.1 | 5.3 |
| 10-Oct | 4.1 | 6.0 | 5.0 |
| 17-Oct | 4.4 | 6.0 | 4.8 |
| 24-Oct | 3.6 | 5.8 | 4.7 |
| 31-Oct | 3.4 | 5.7 | 4.4 |
| 7-Nov | 2.8 | 5.9 | 4.4 |
| 14-Nov | 3.1 | 5.2 | 4.1 |
| 21-Nov | 2.1 | 4.8 | 3.5 |
| 28-Nov | 2.0 | 3.7 | 2.7 |
| 5-Dec | 1.5 | 2.6 | 2.4 |
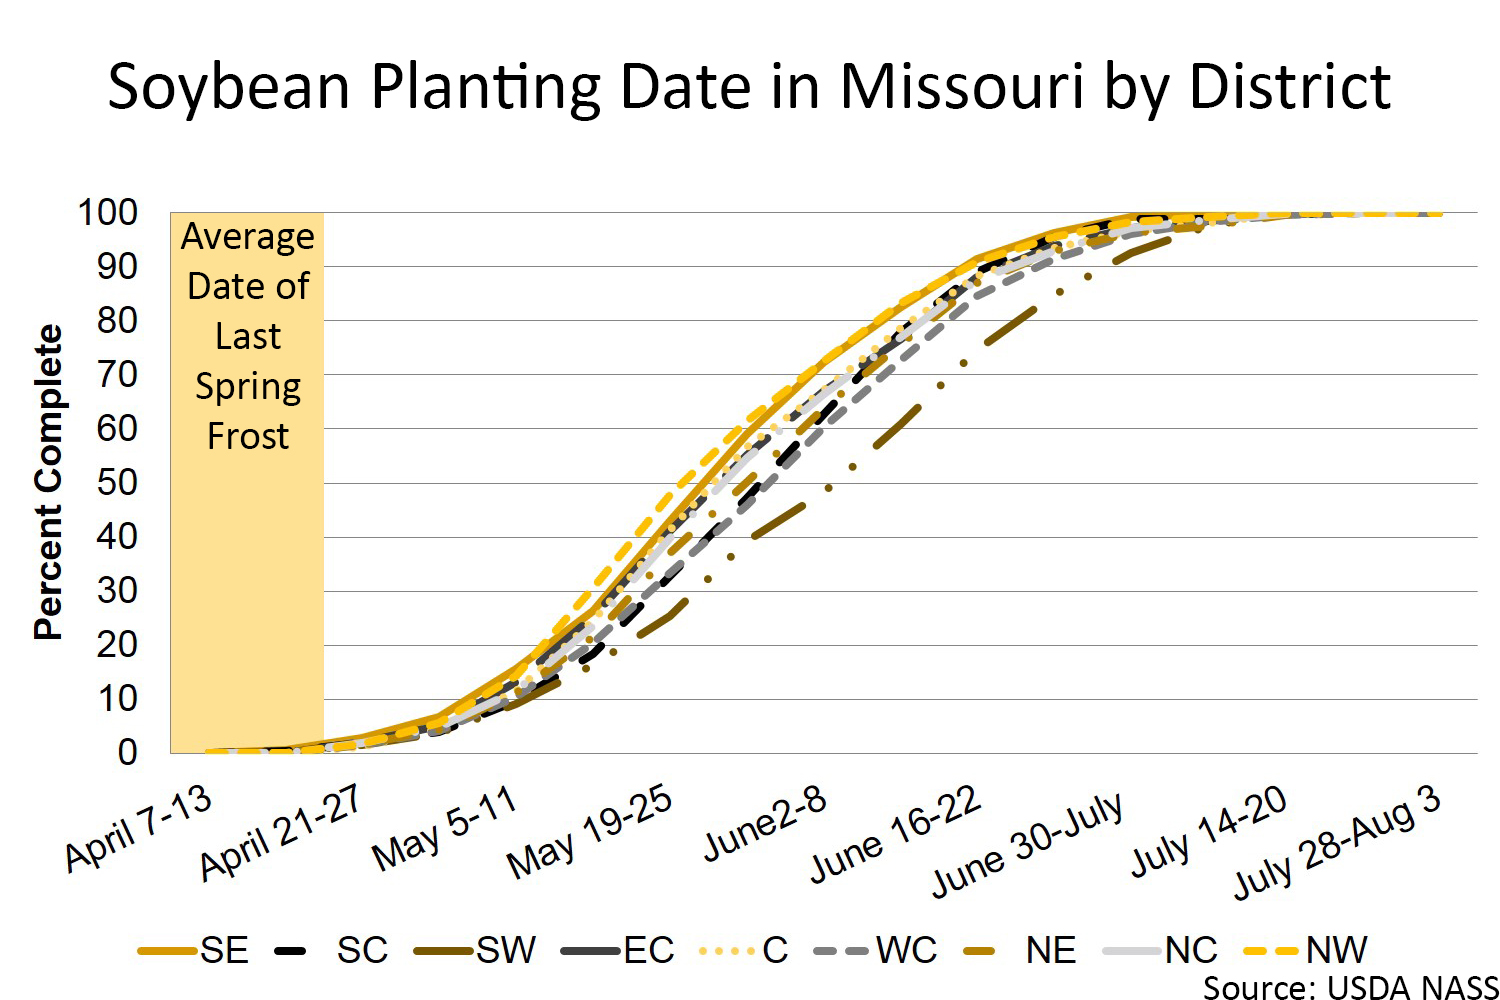
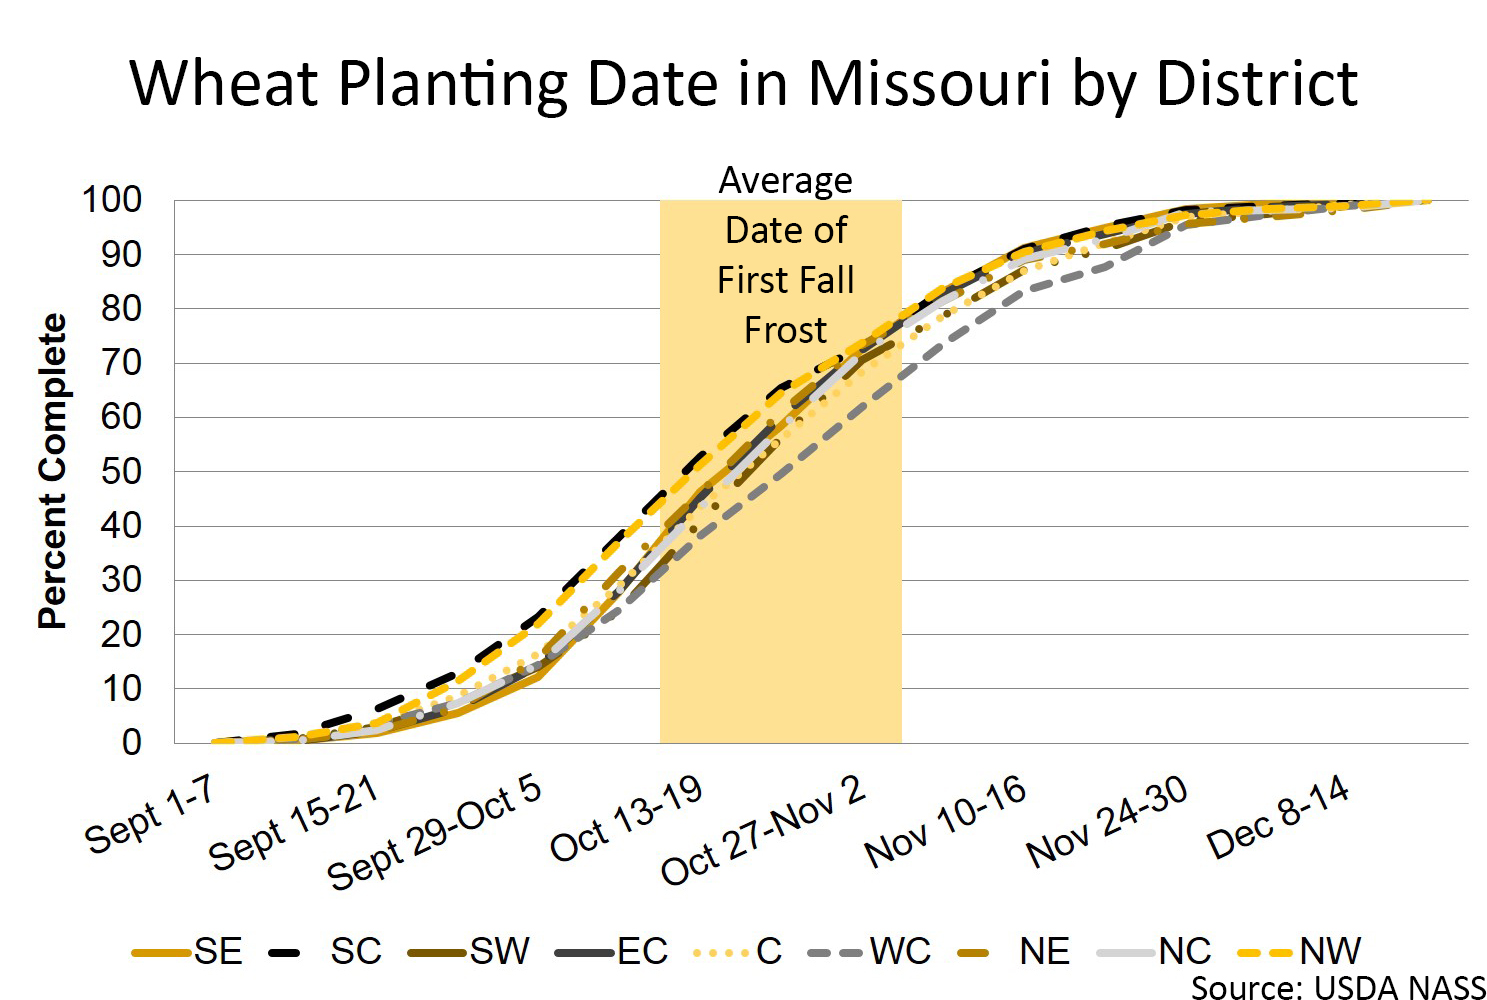
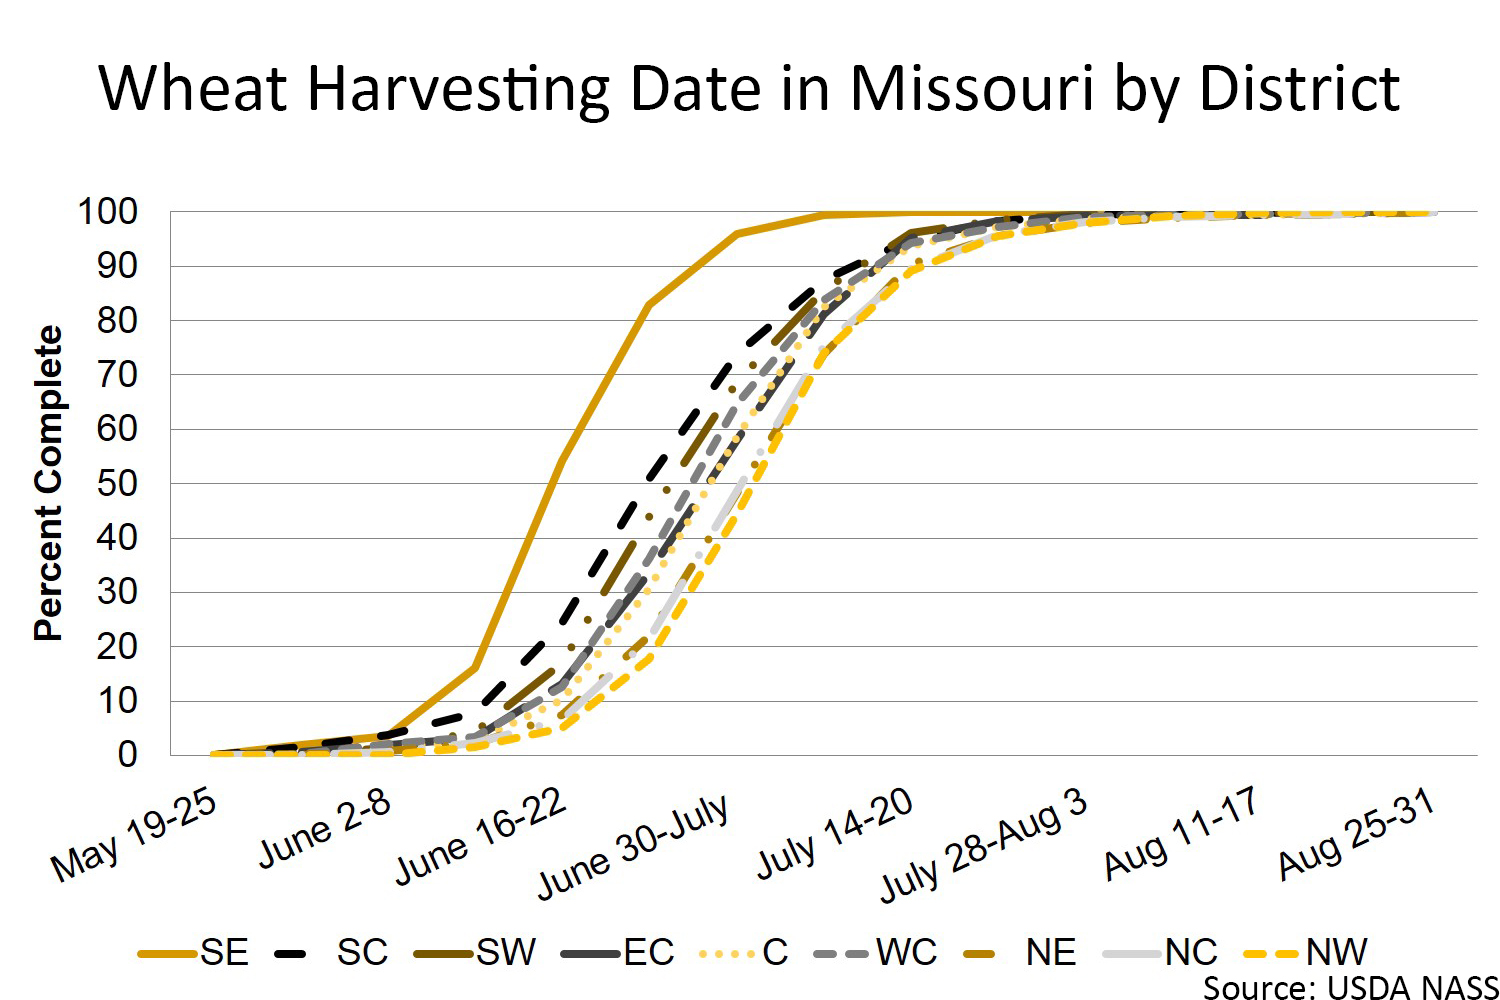
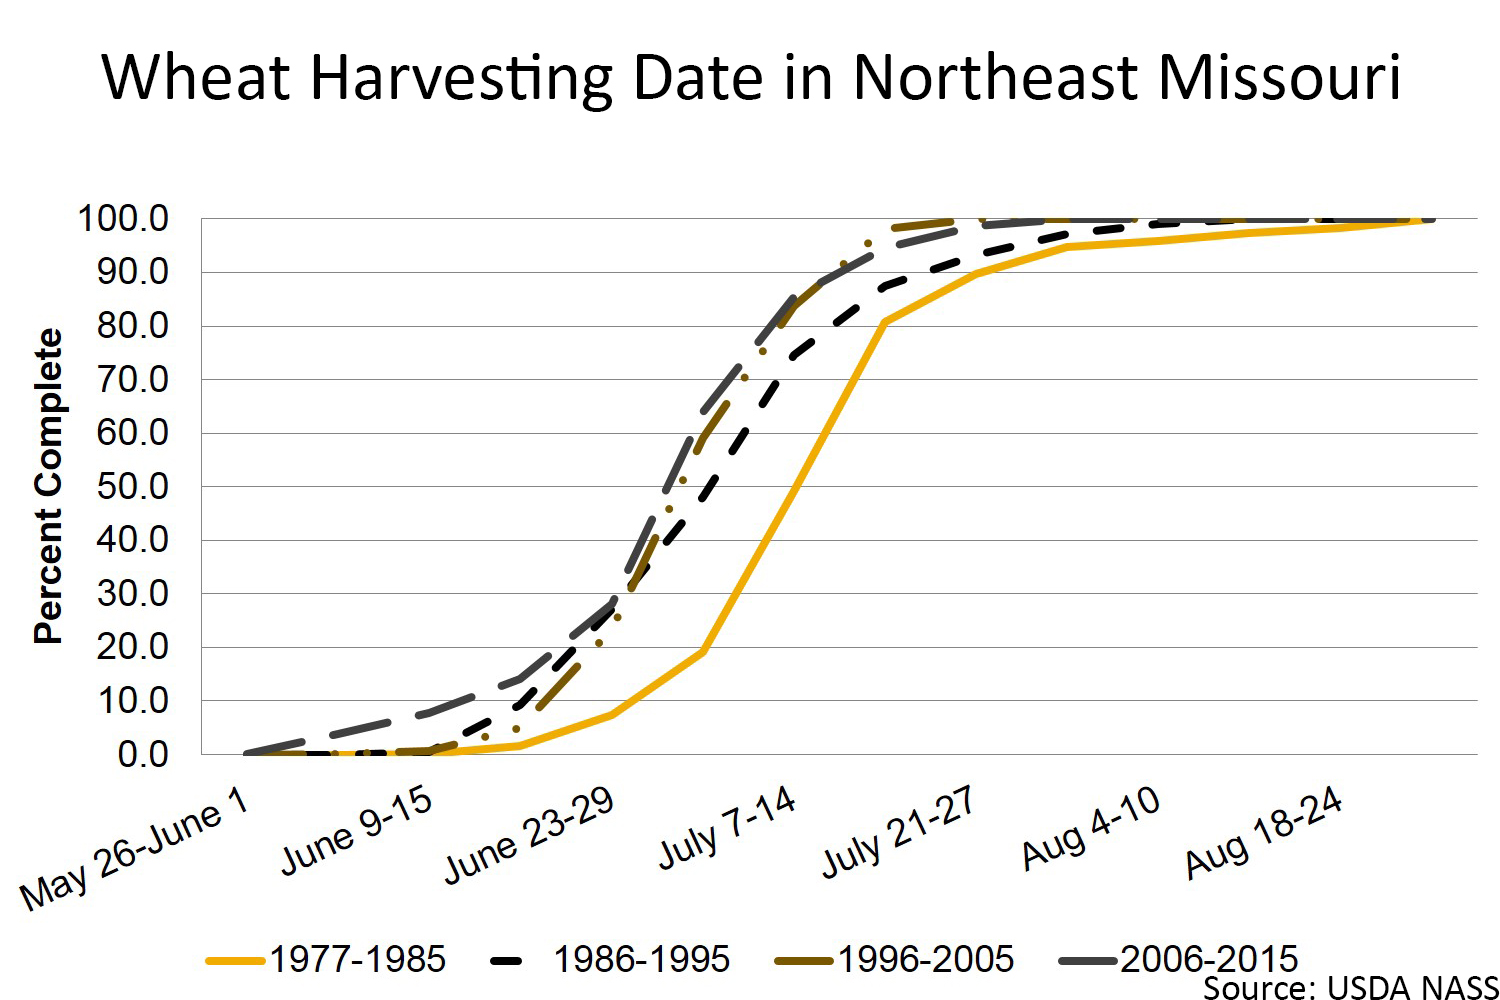
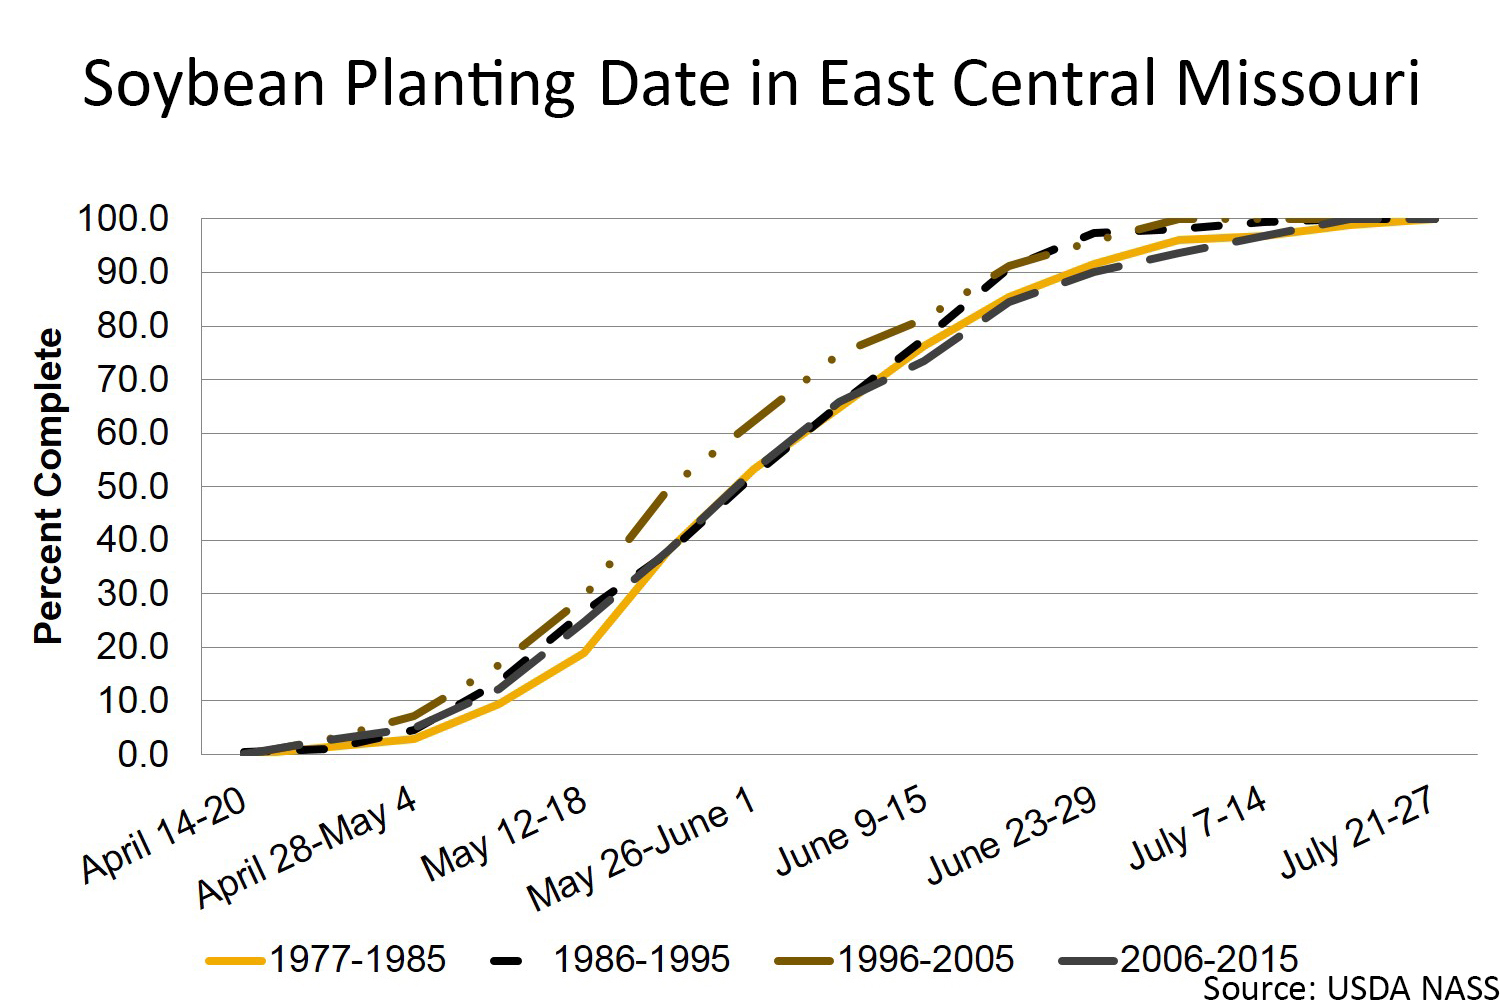
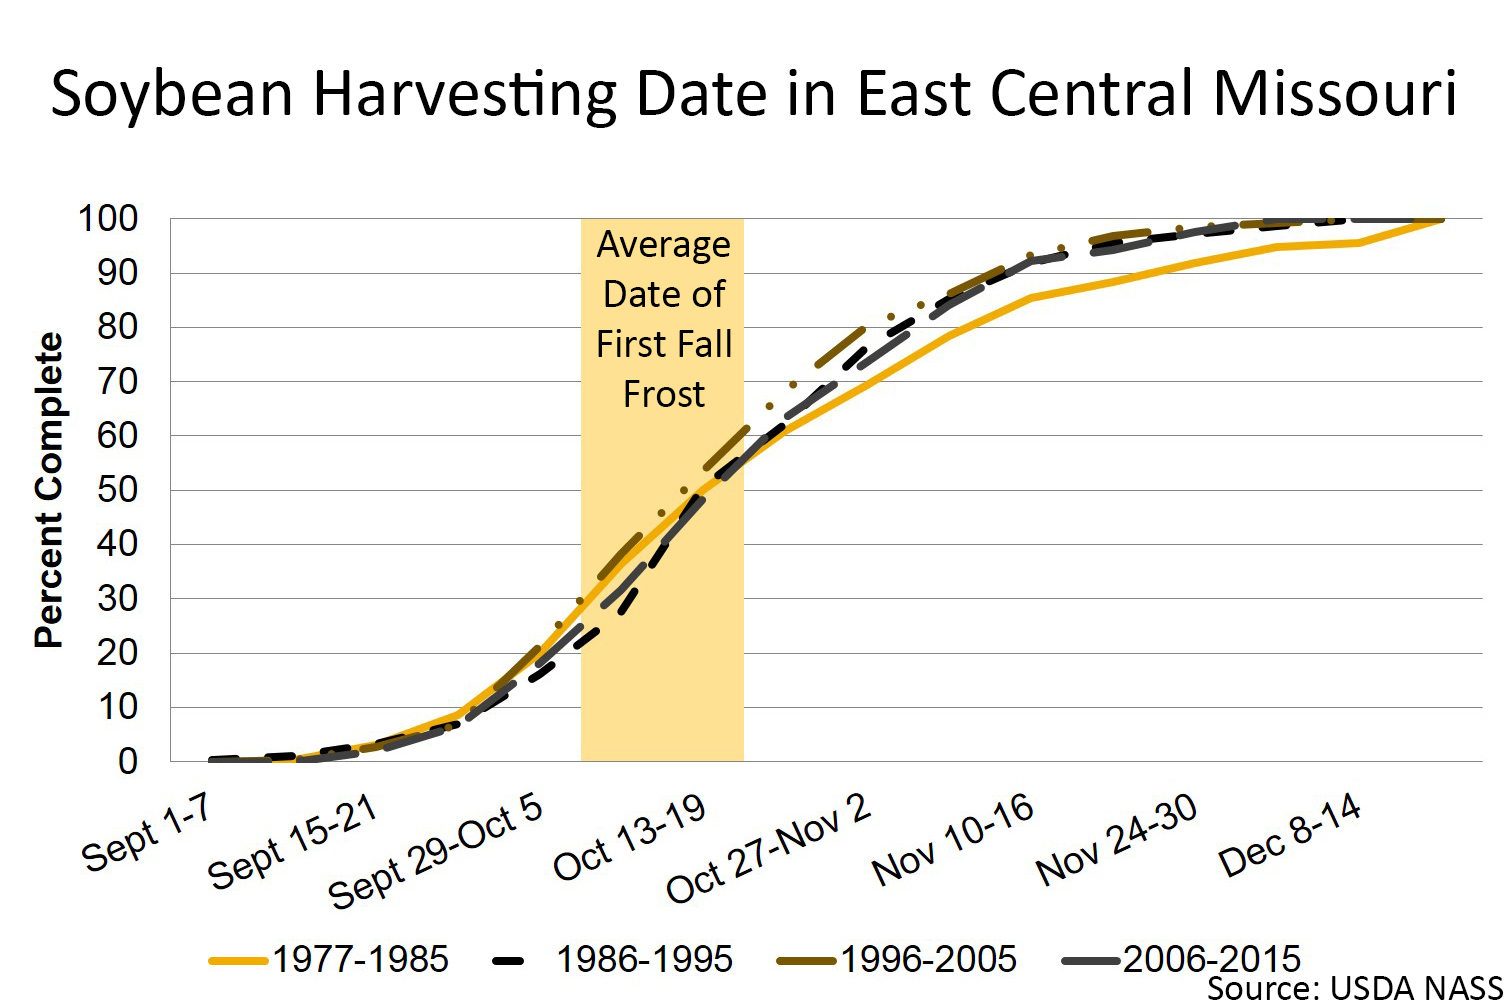
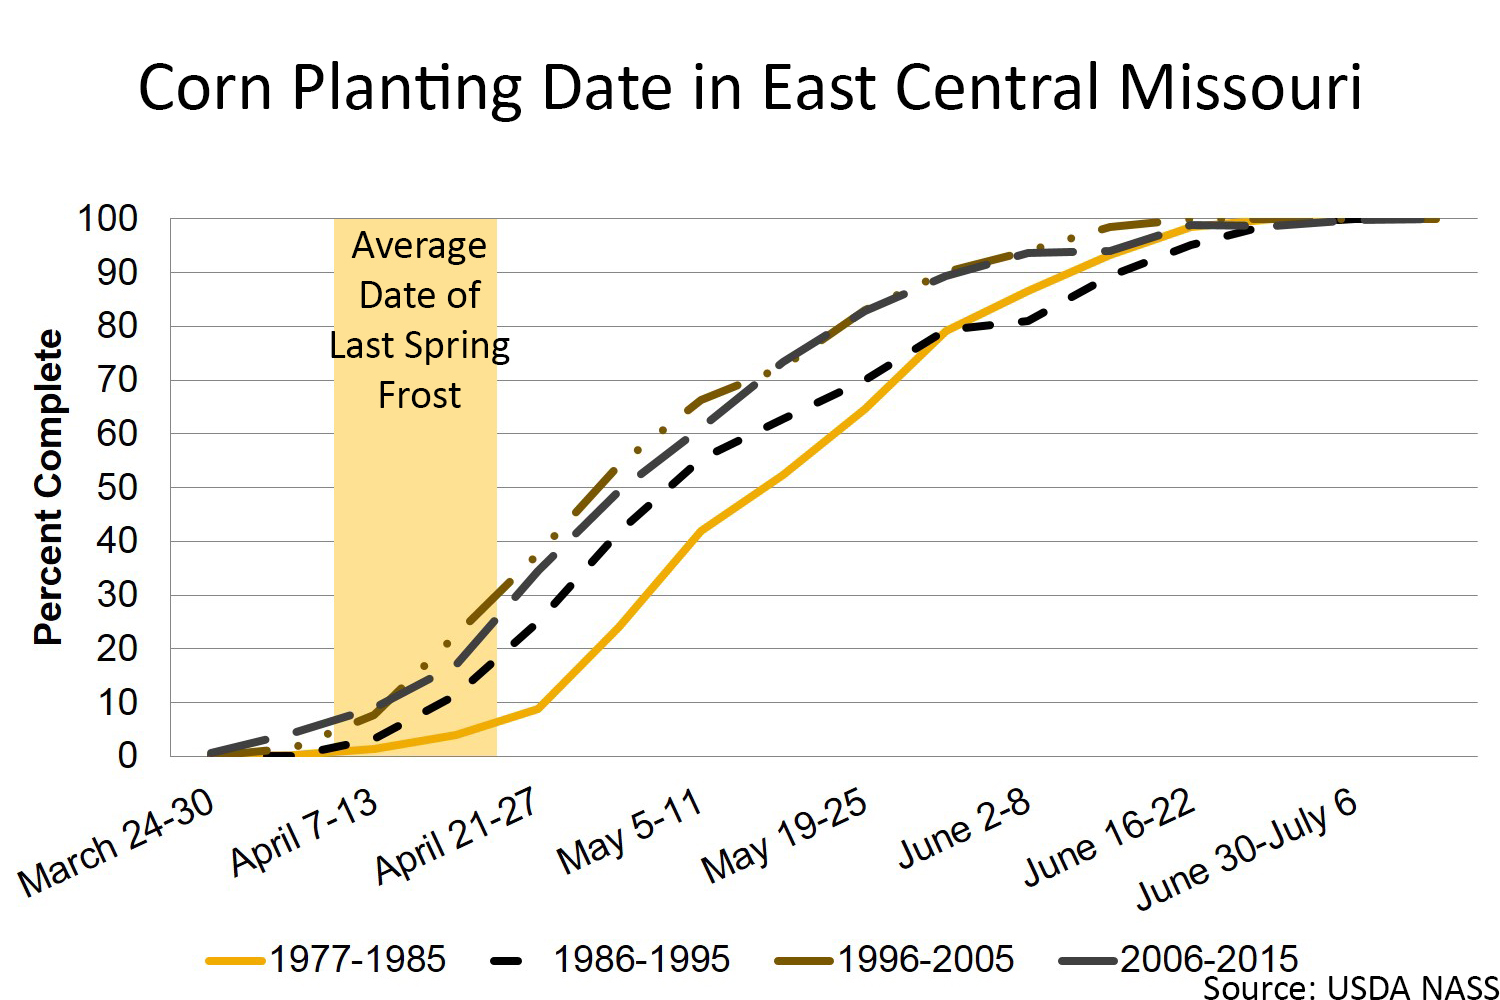
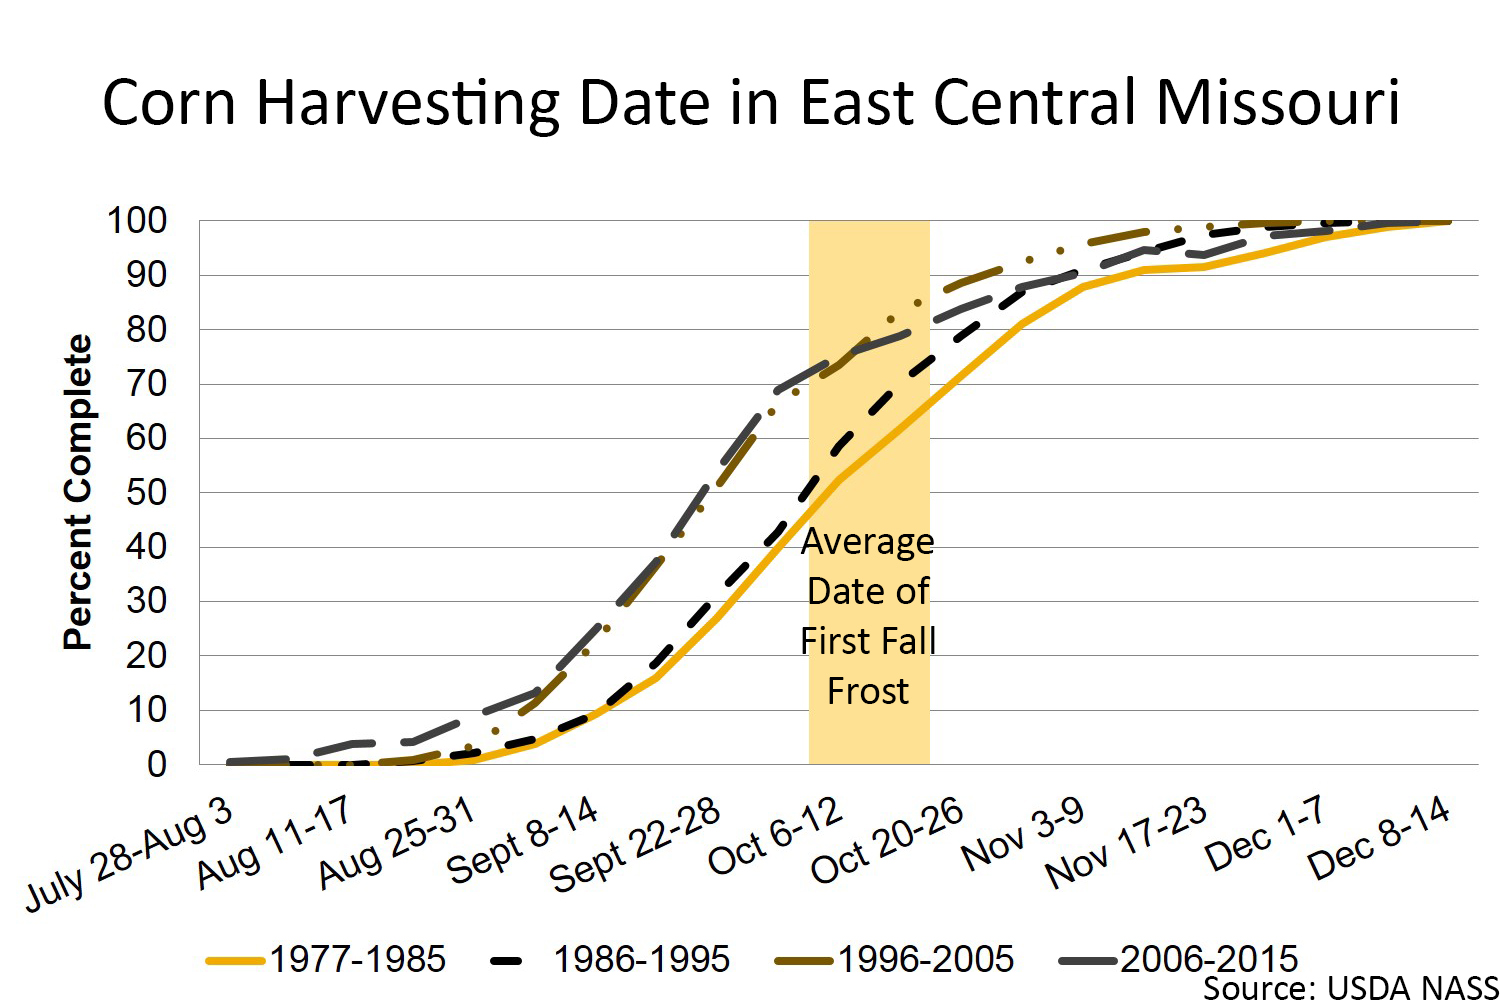
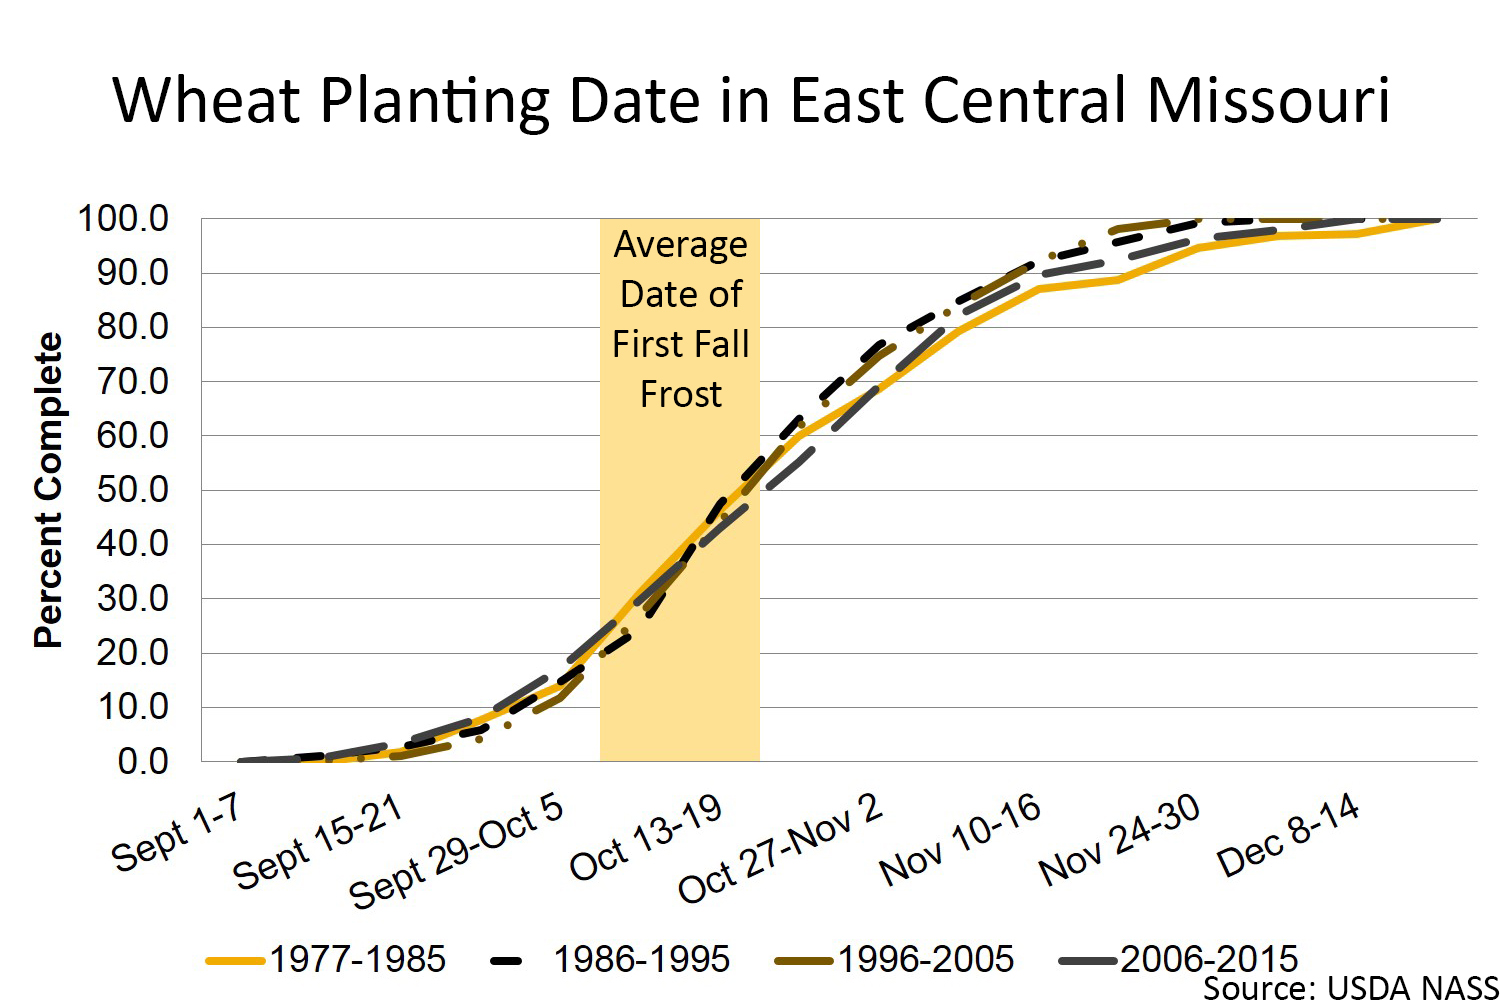
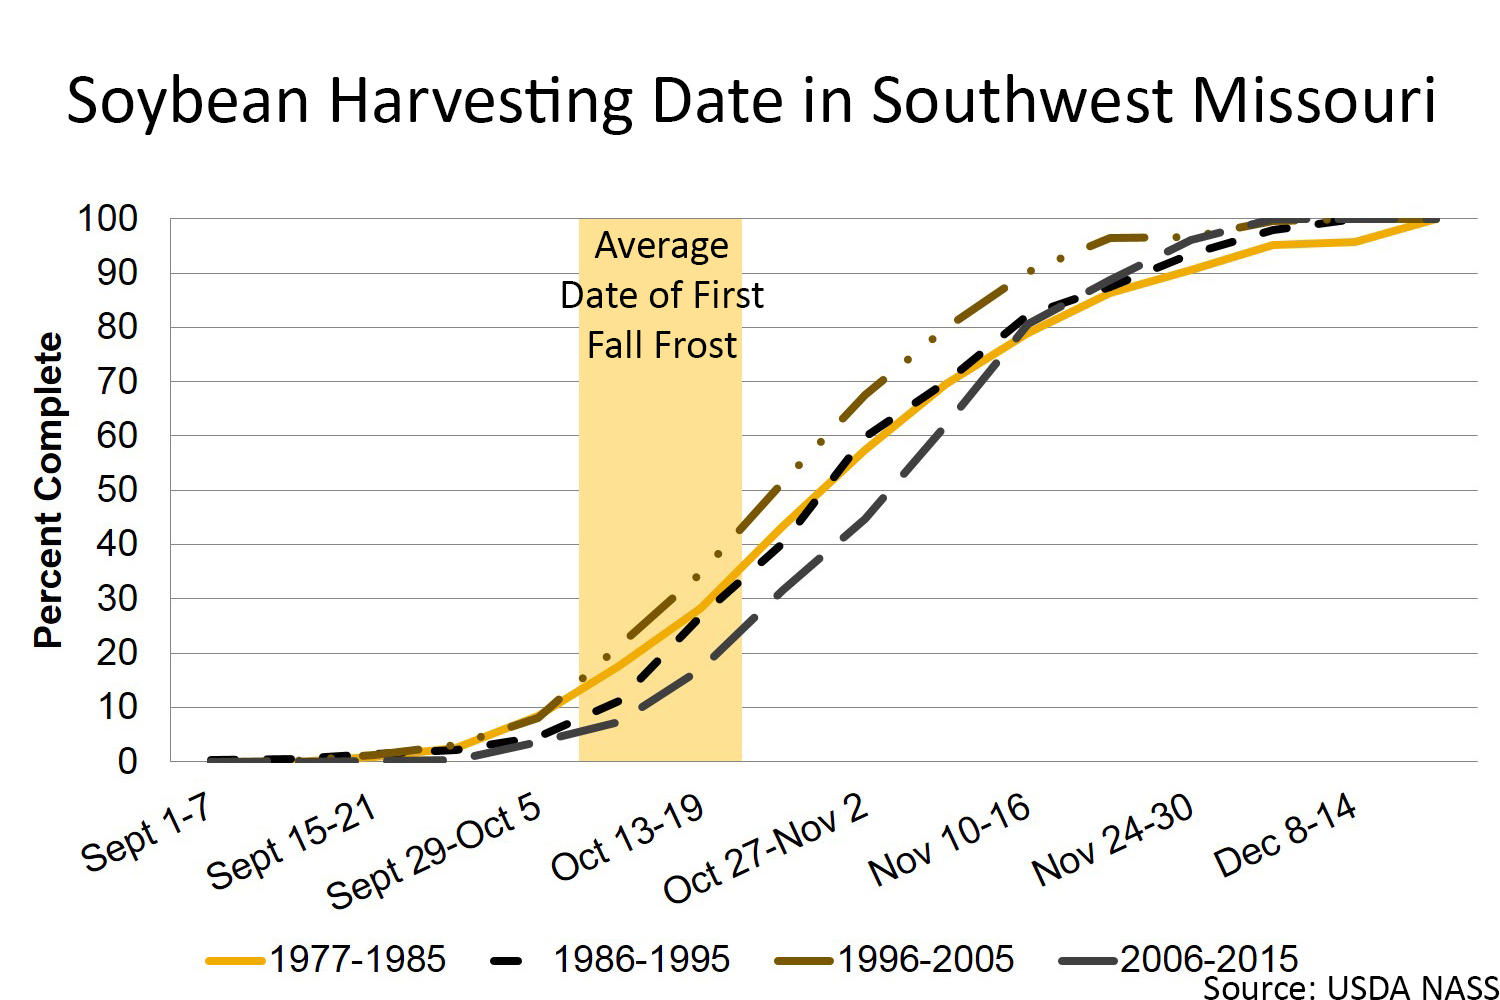
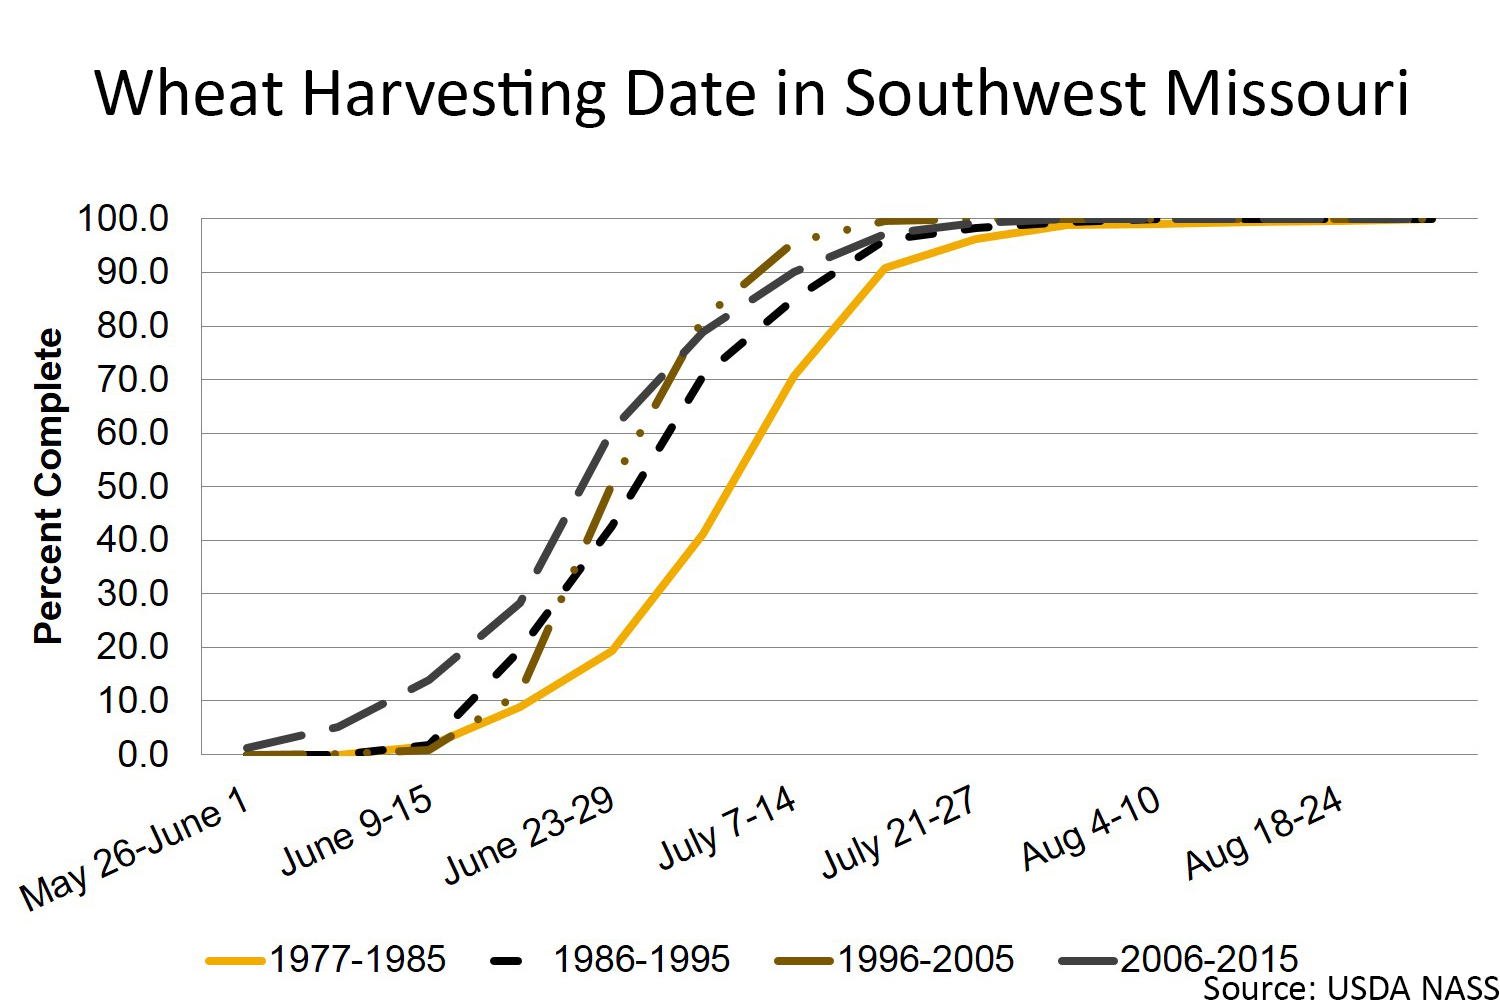
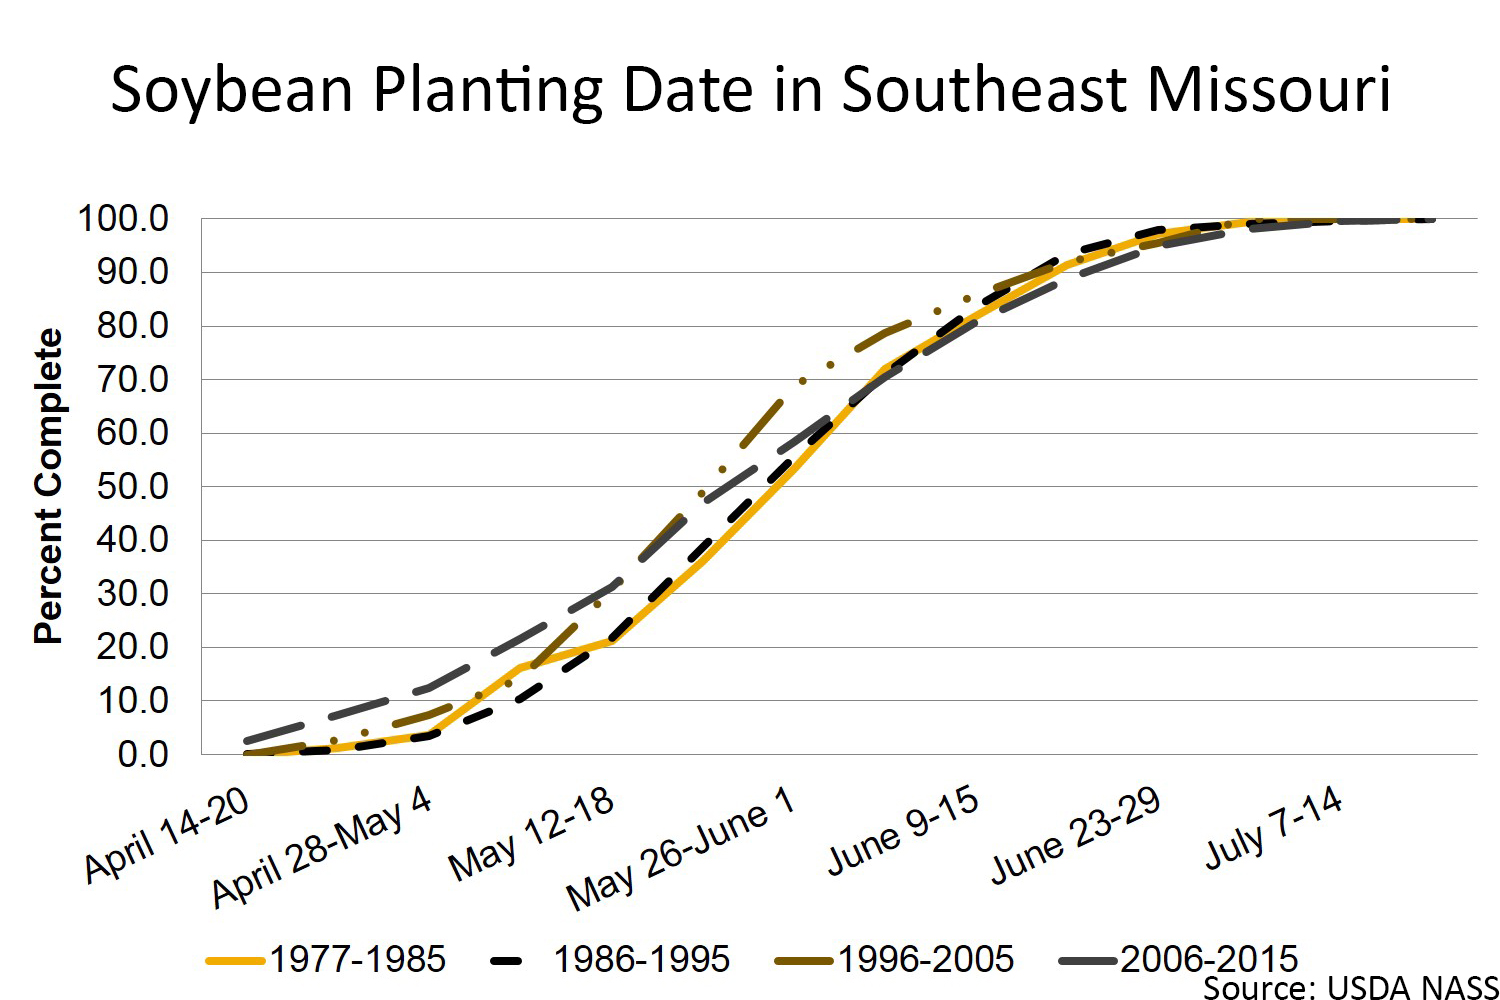
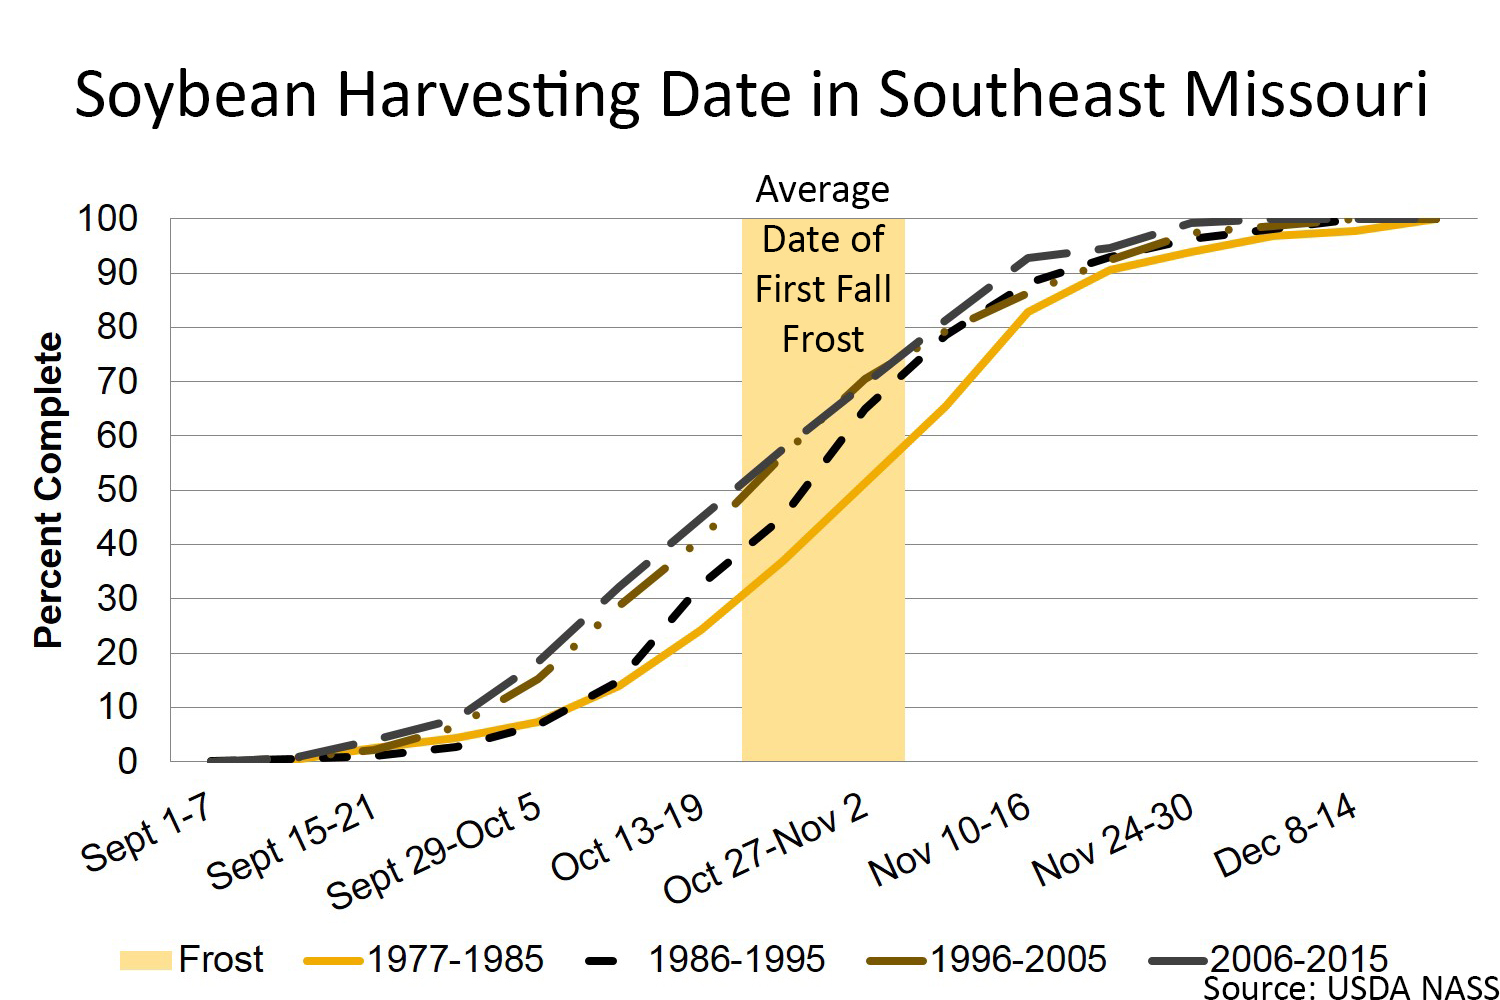
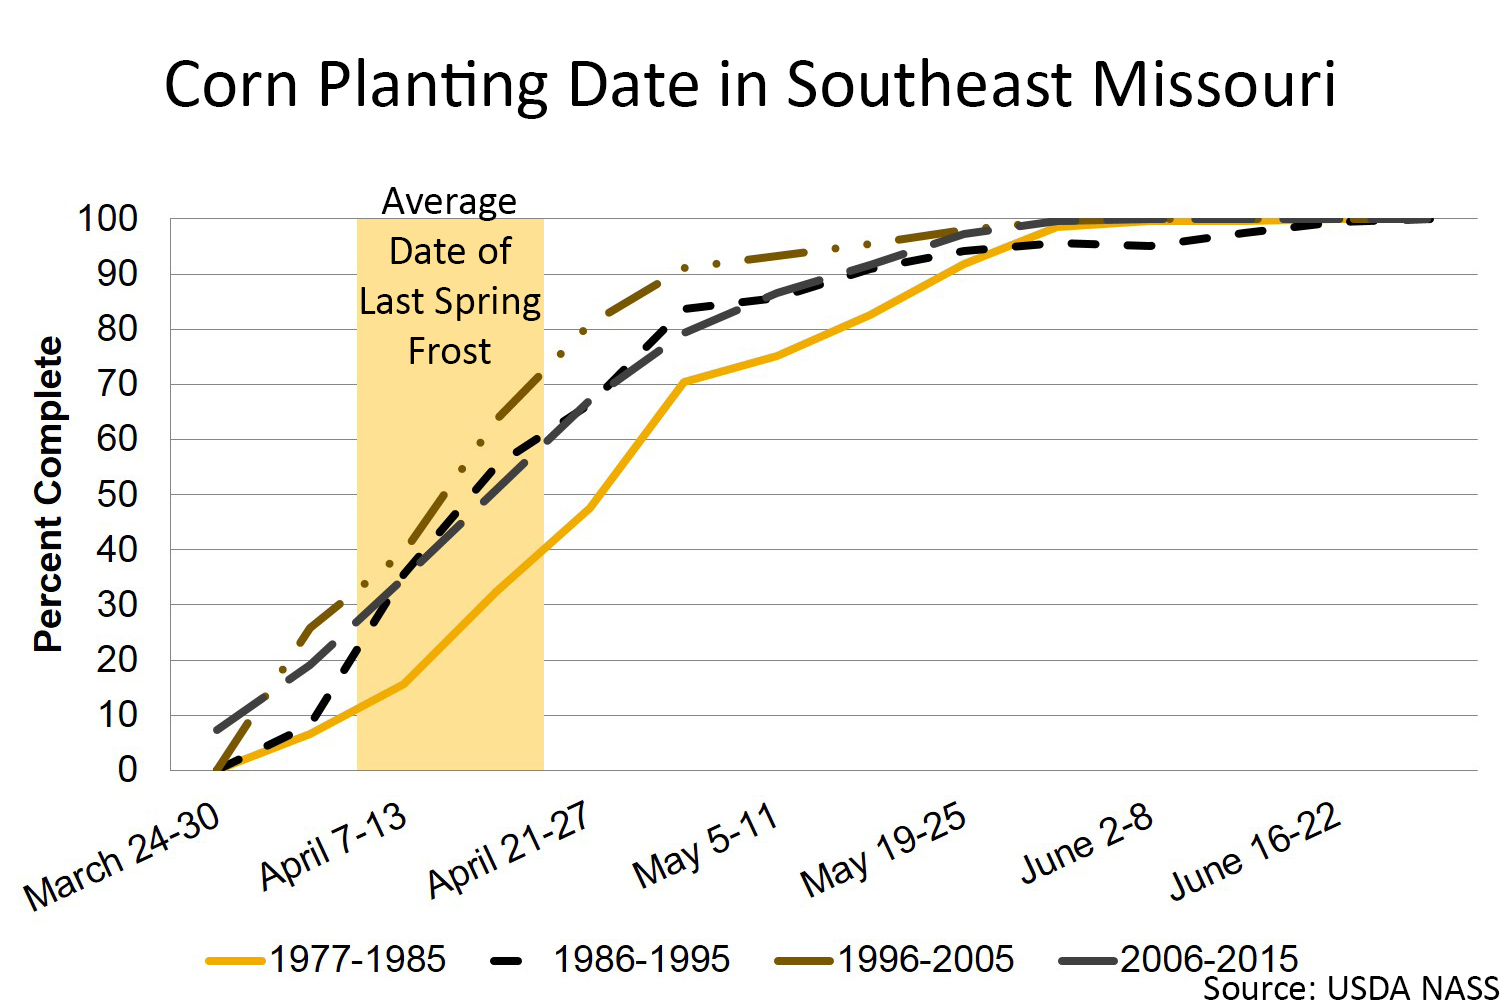
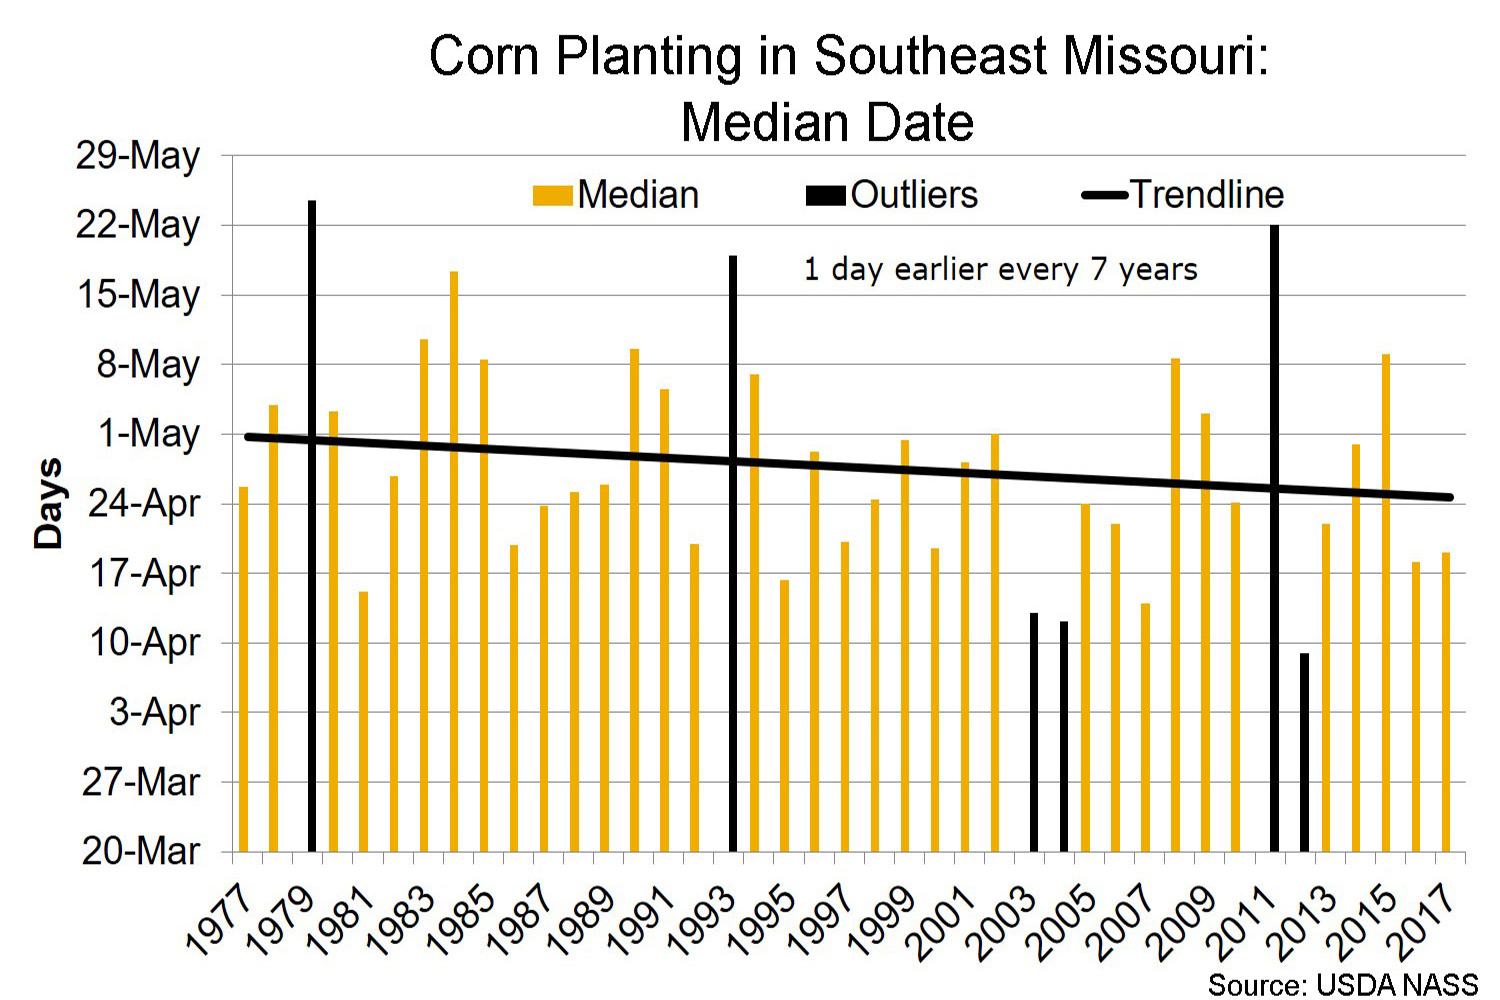
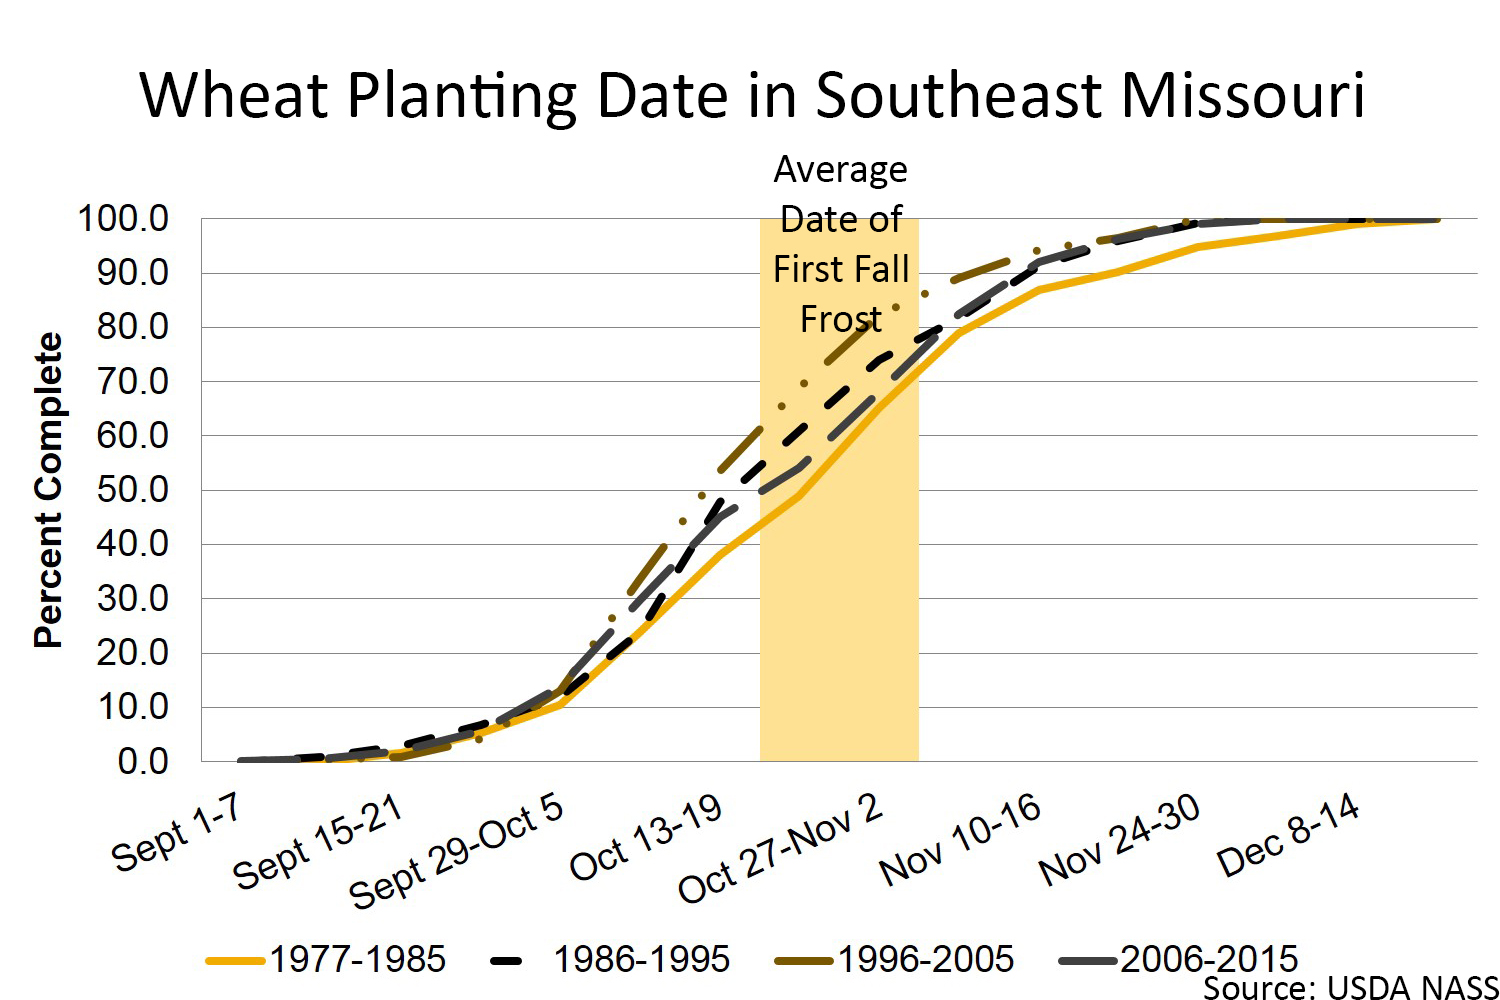
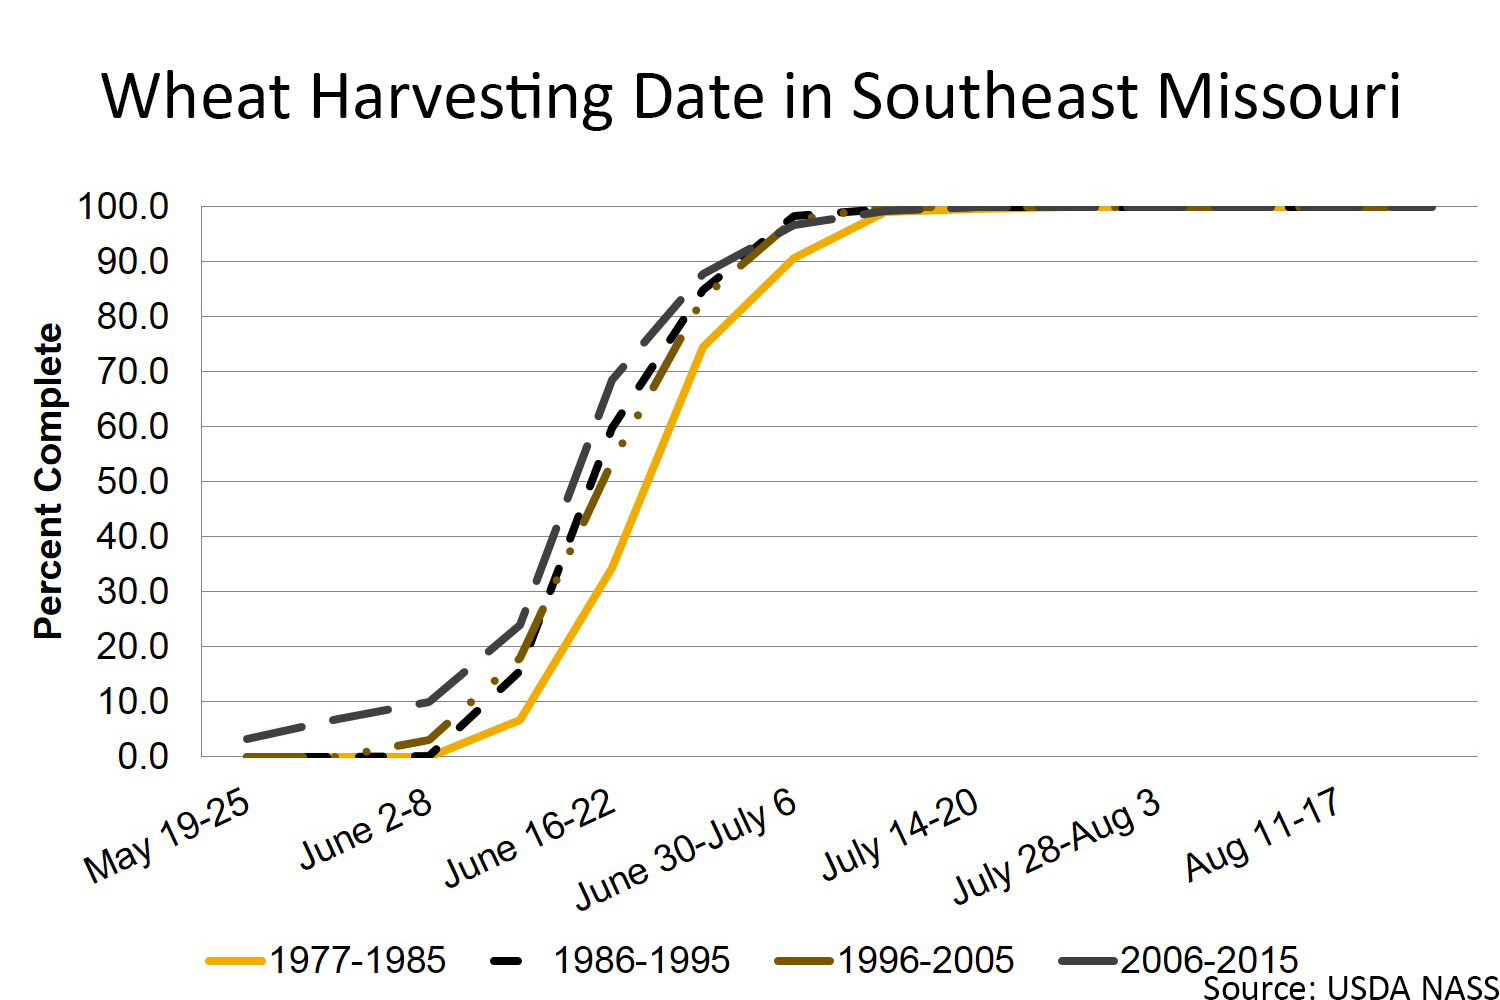
These graphs present the USDA Crop Progress Reports from 1977 to 2015 for the stat of Missouri by district.
Select the graphs to view a larger image.
Soybean
Corn

Wheat
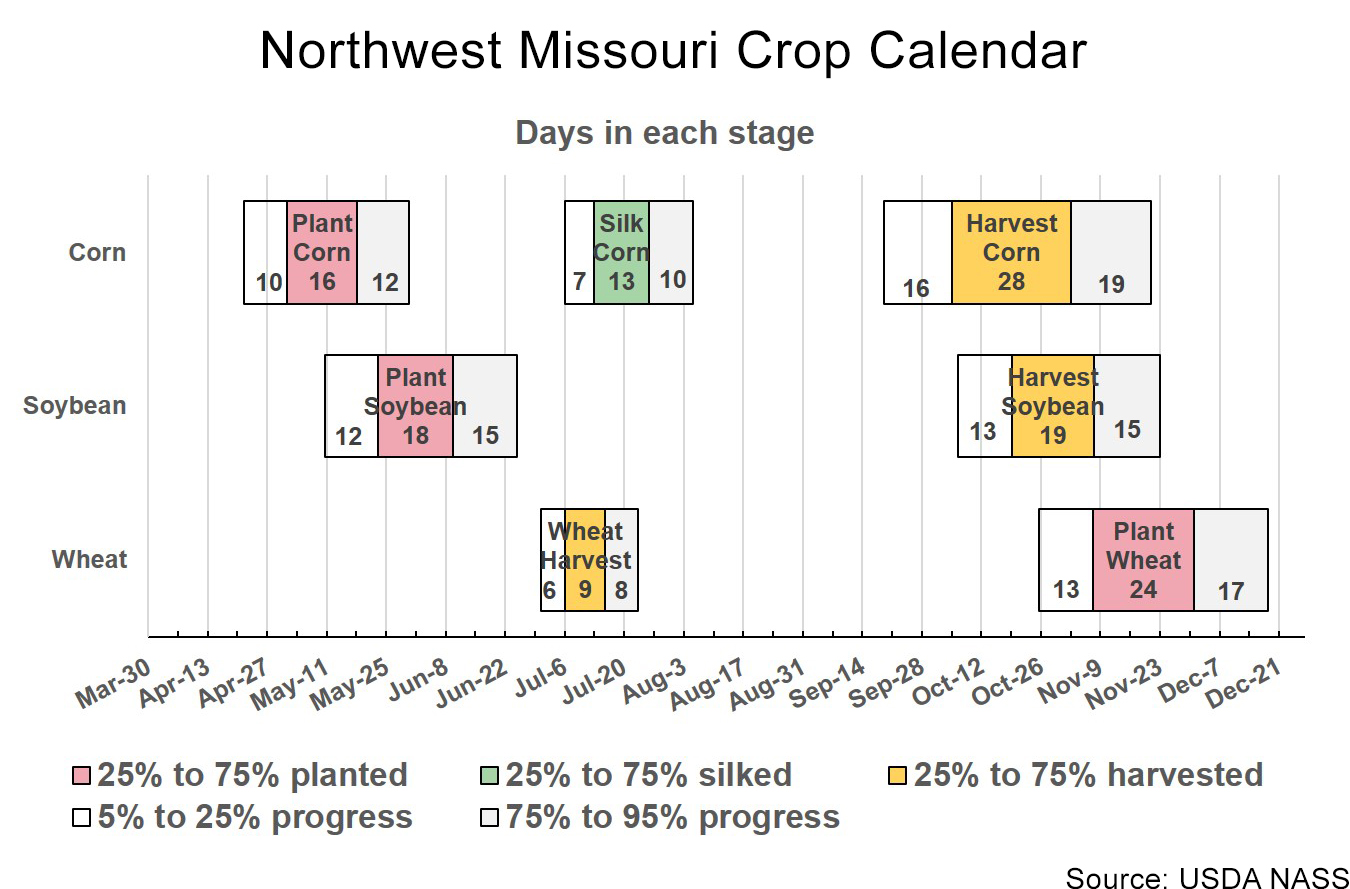
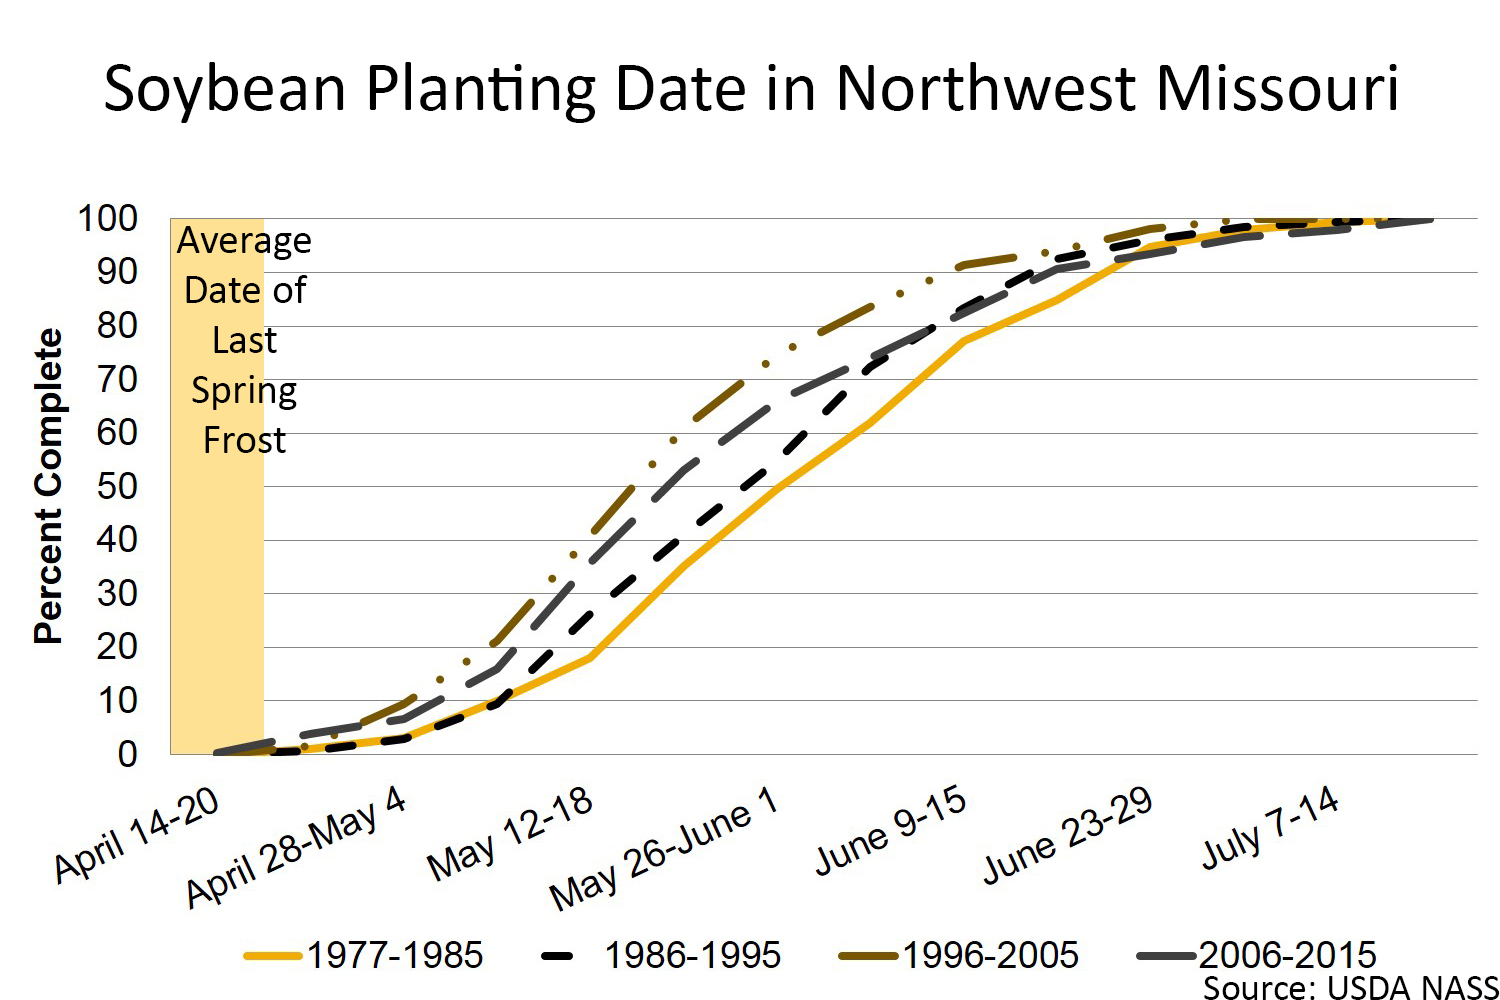
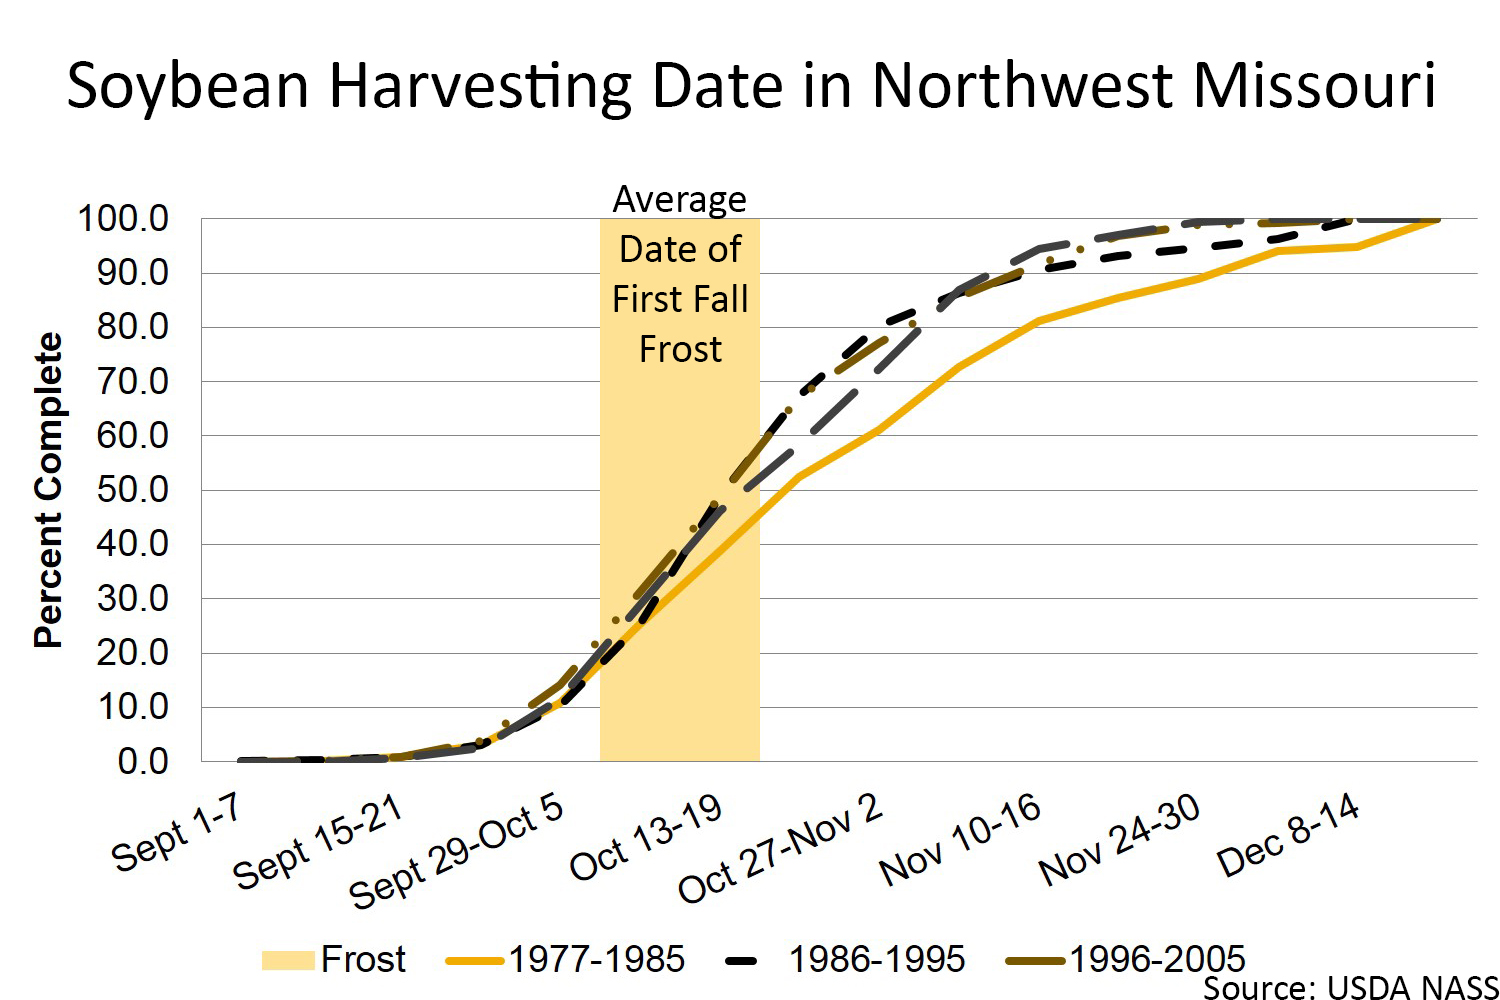
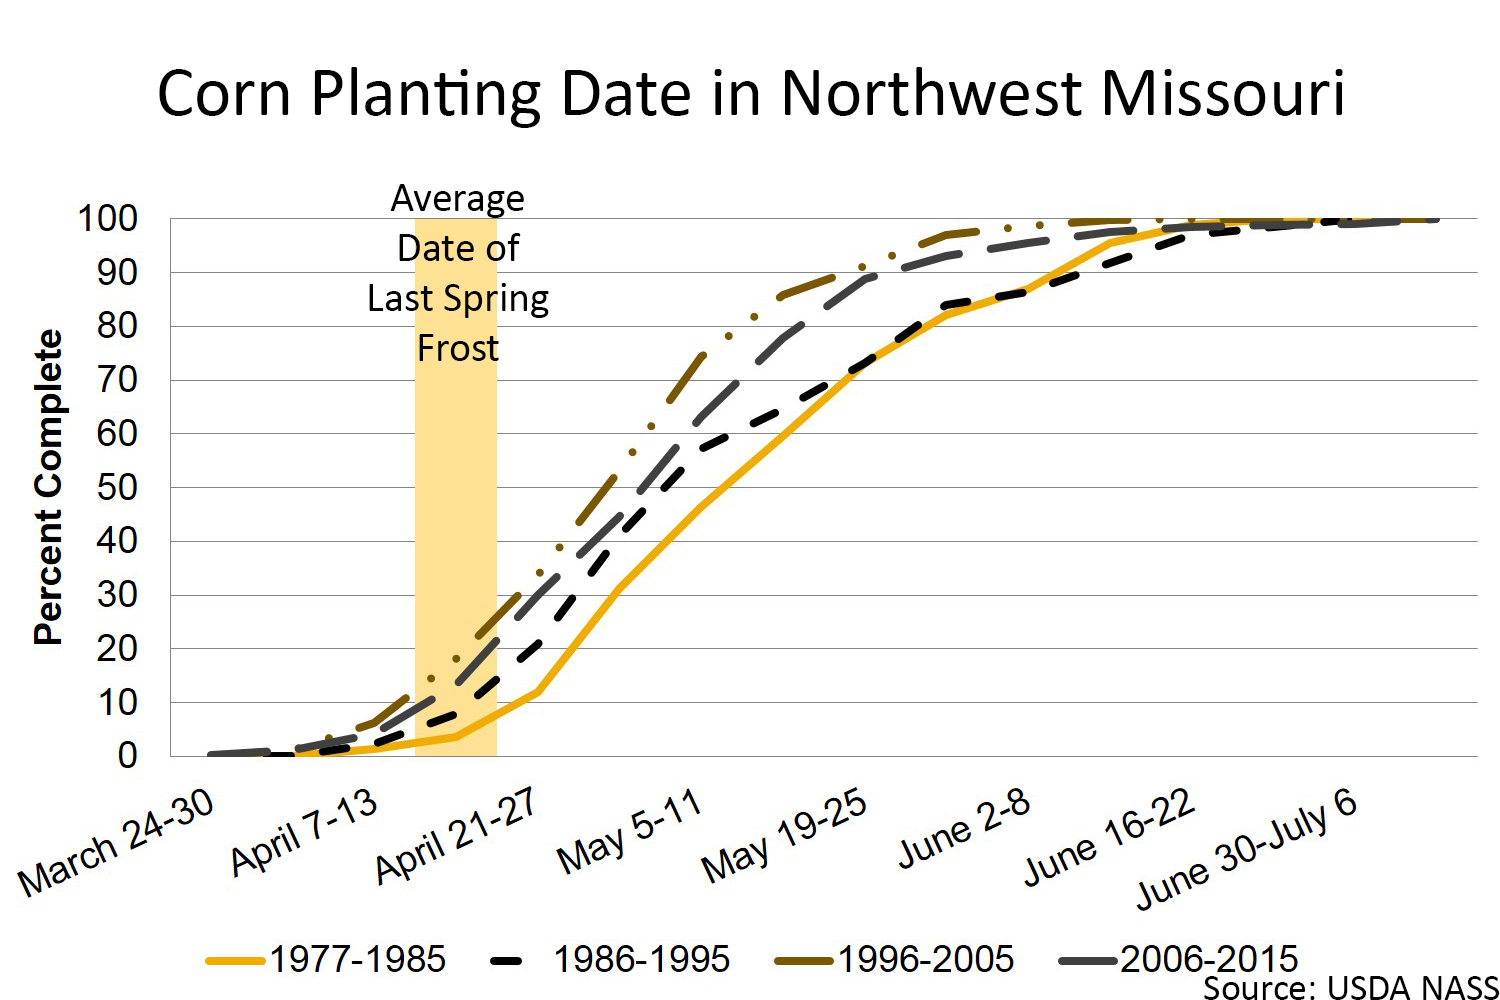
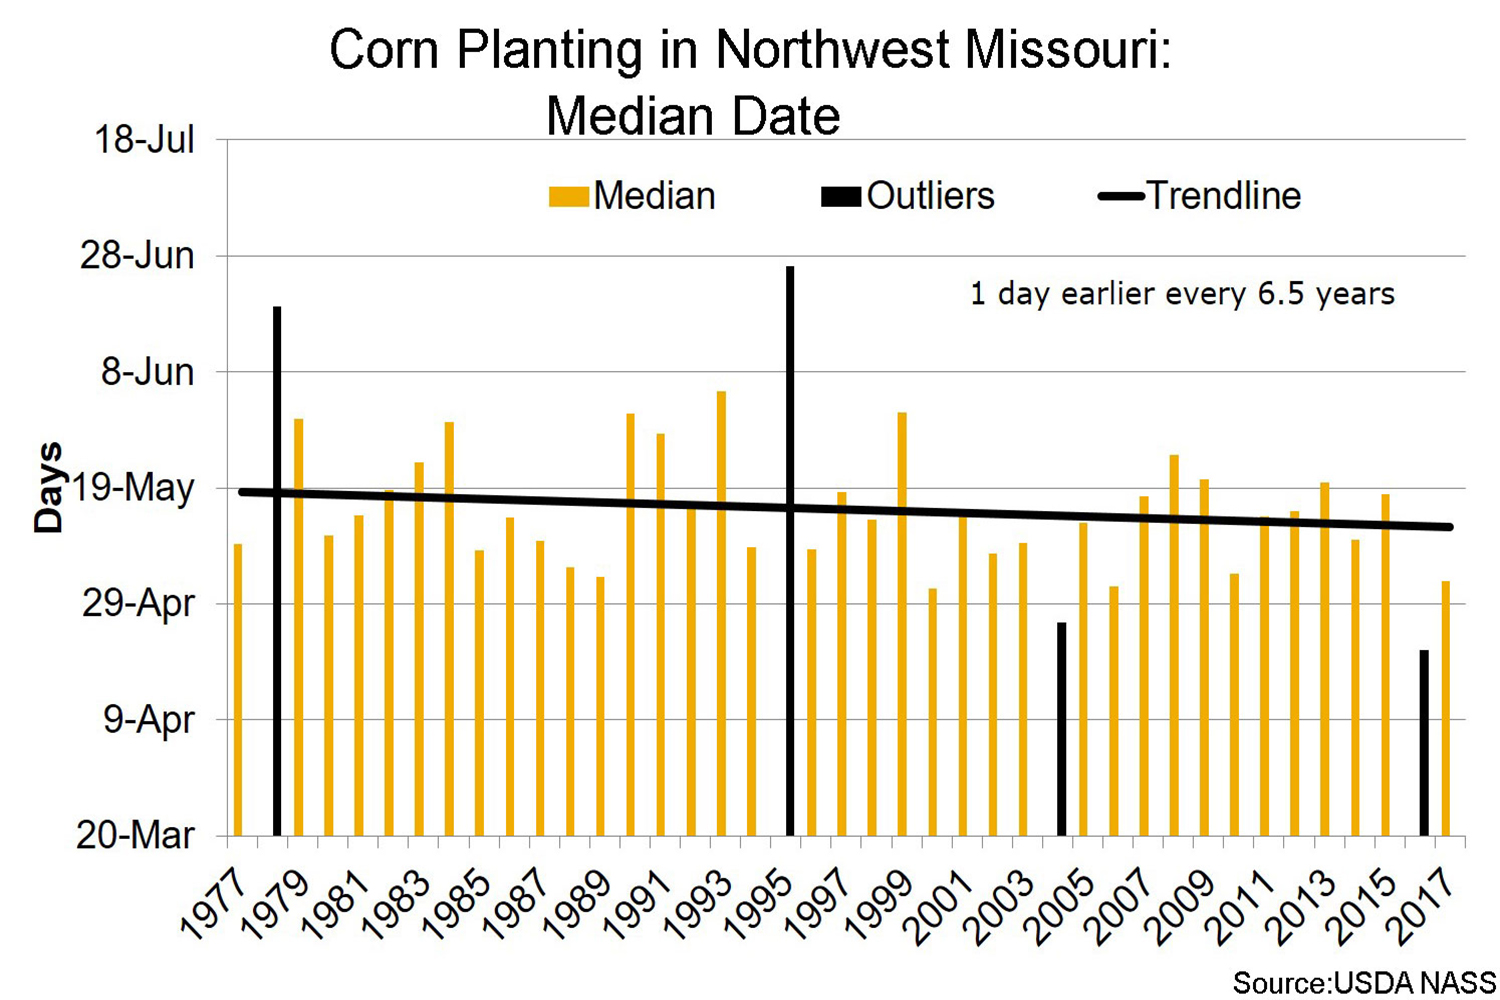
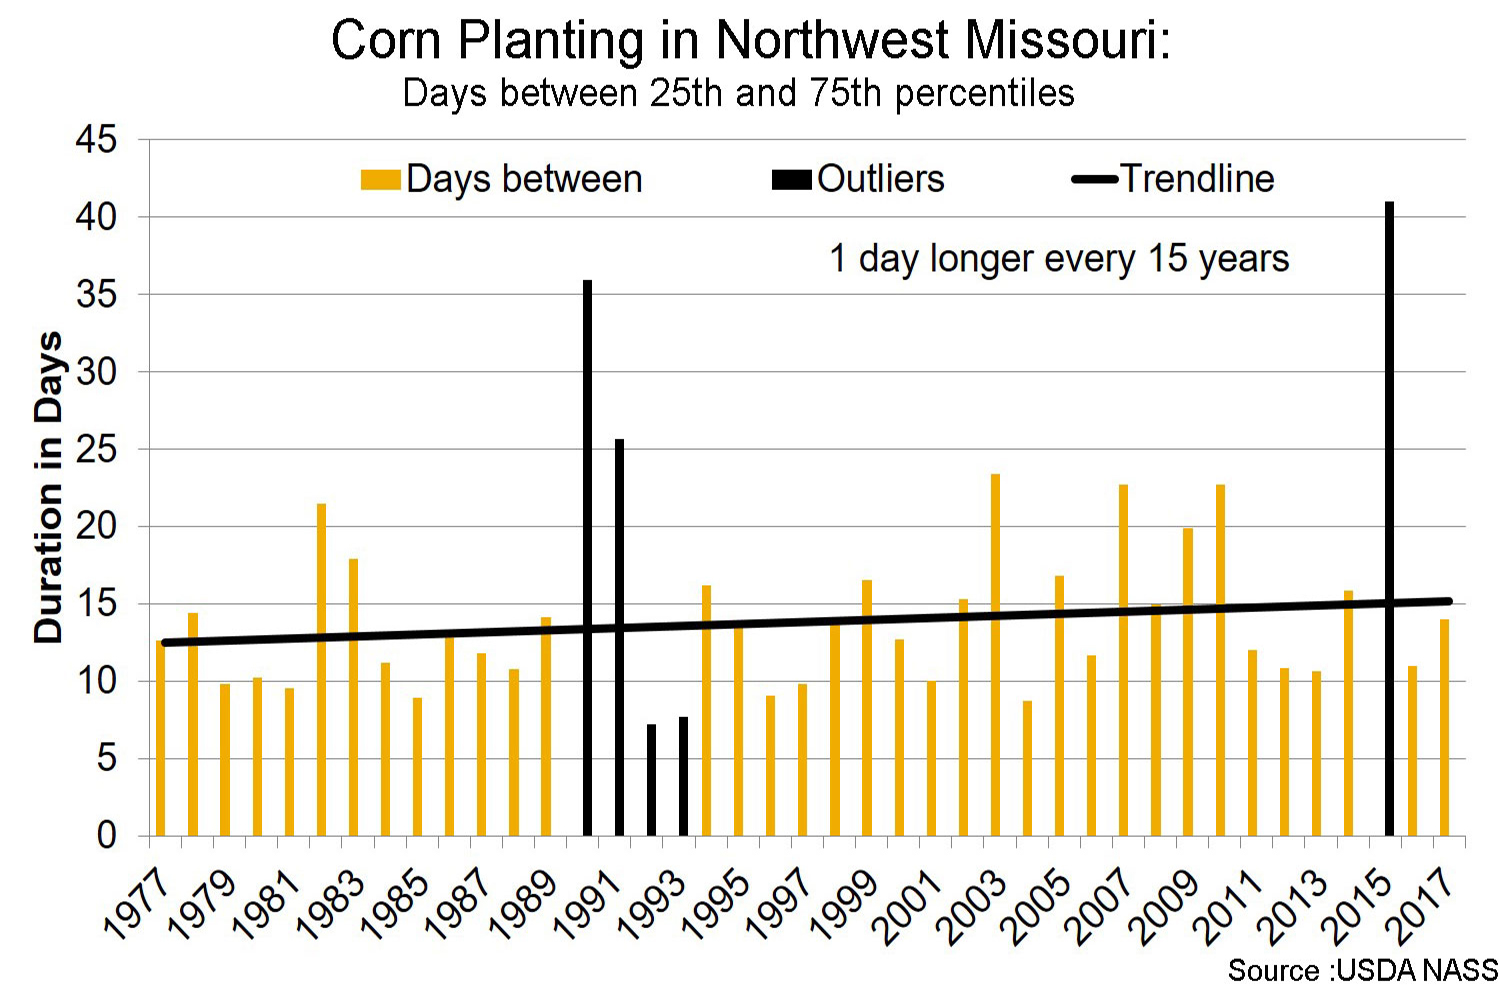
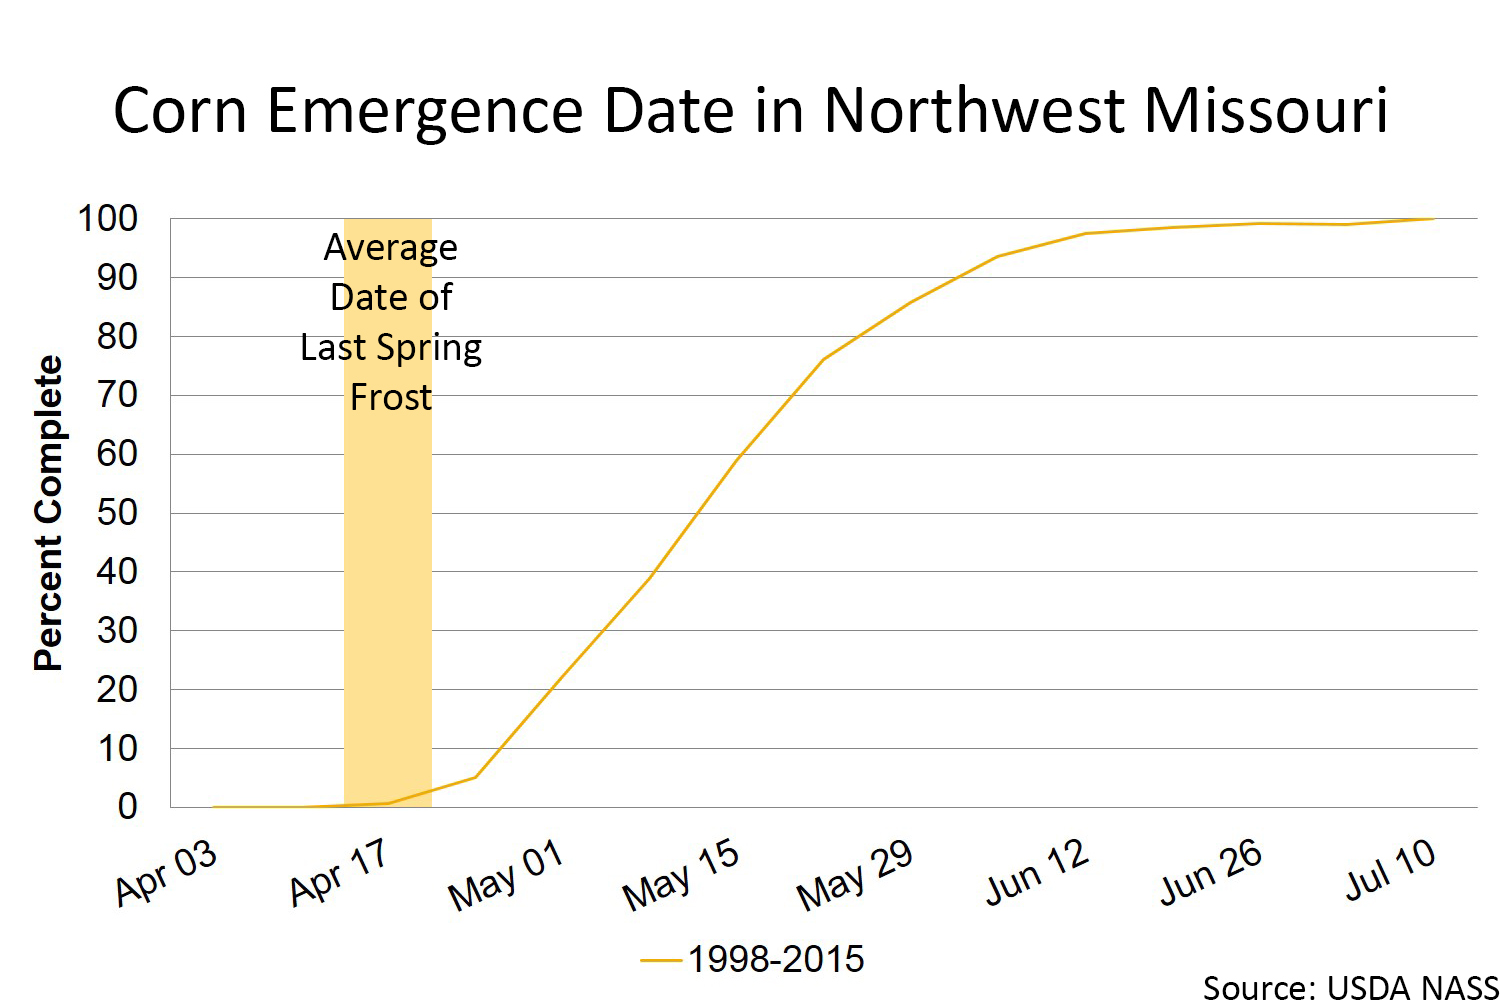
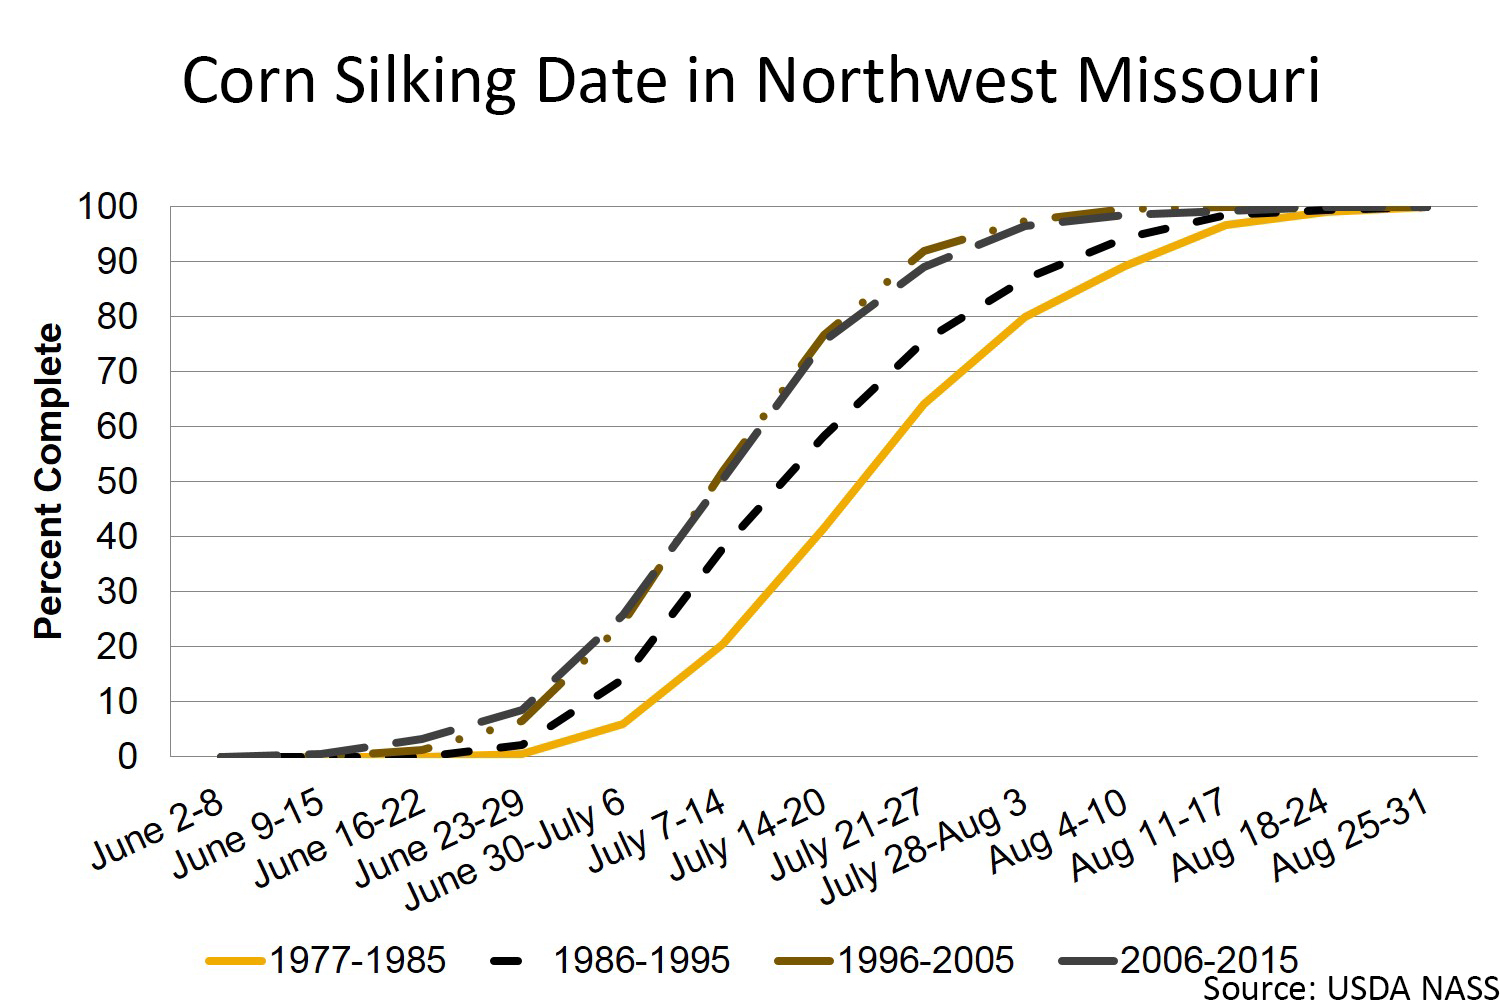
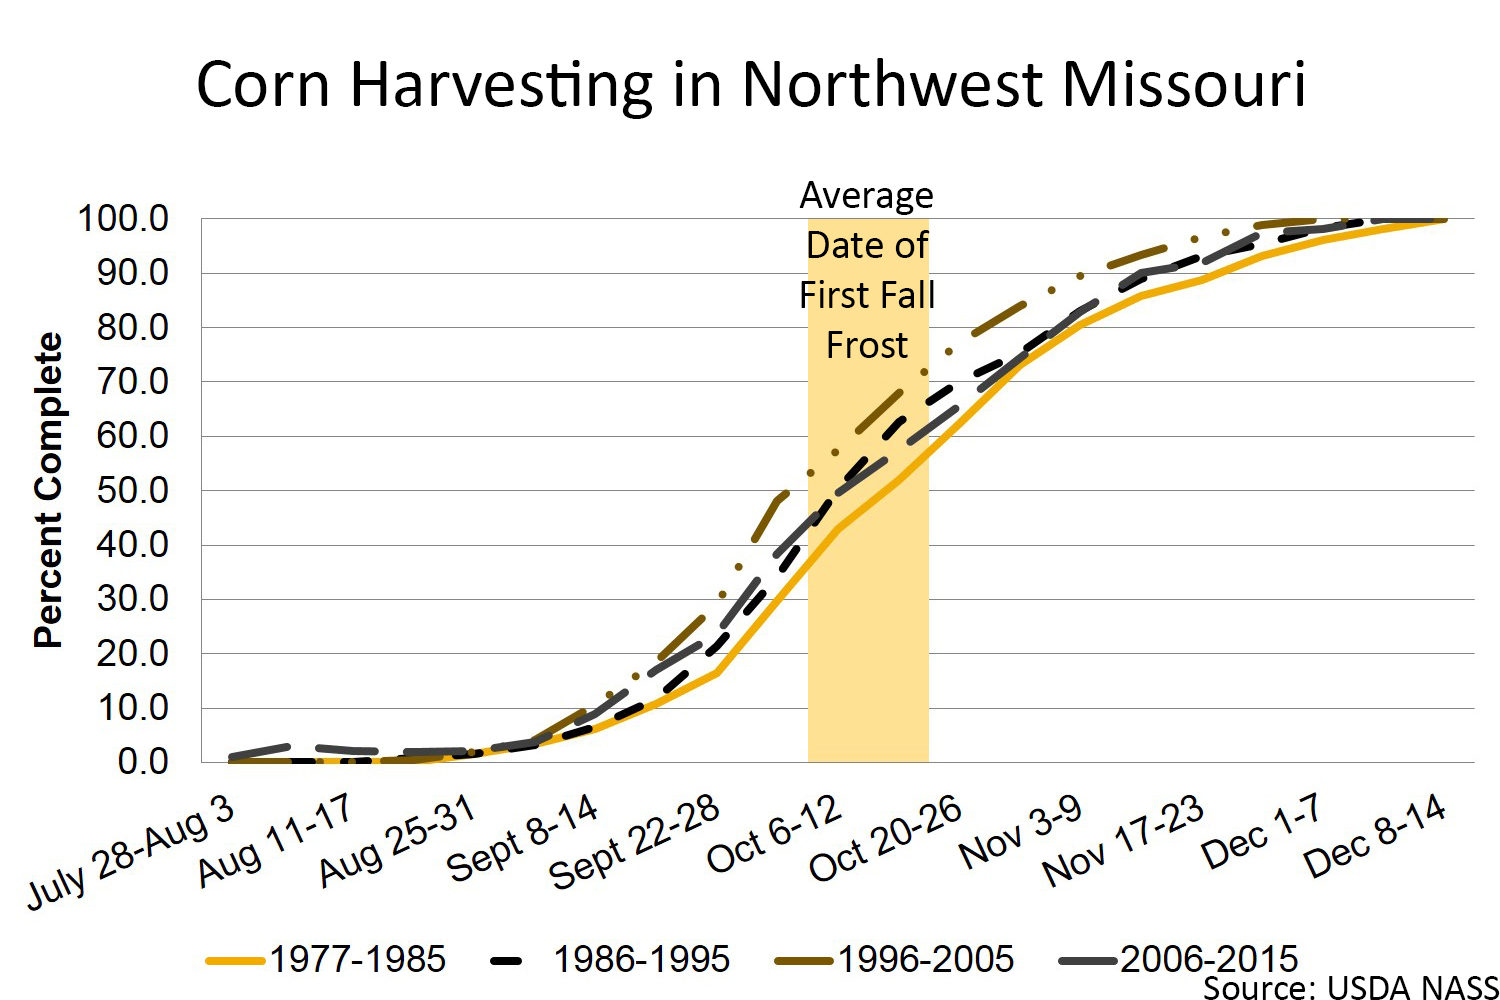
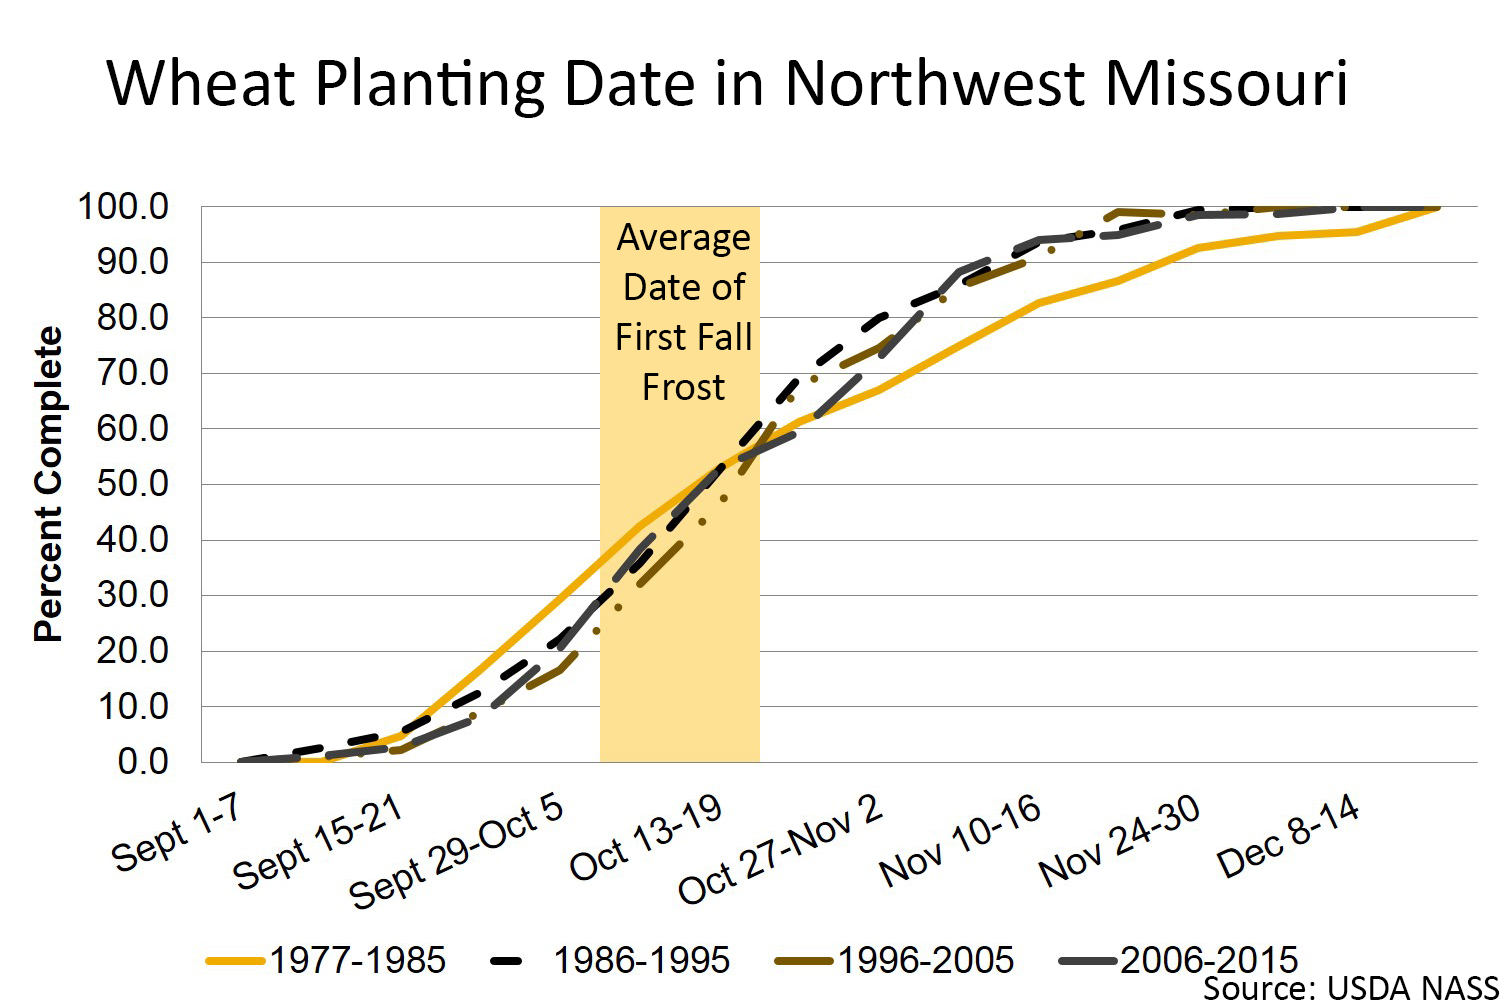
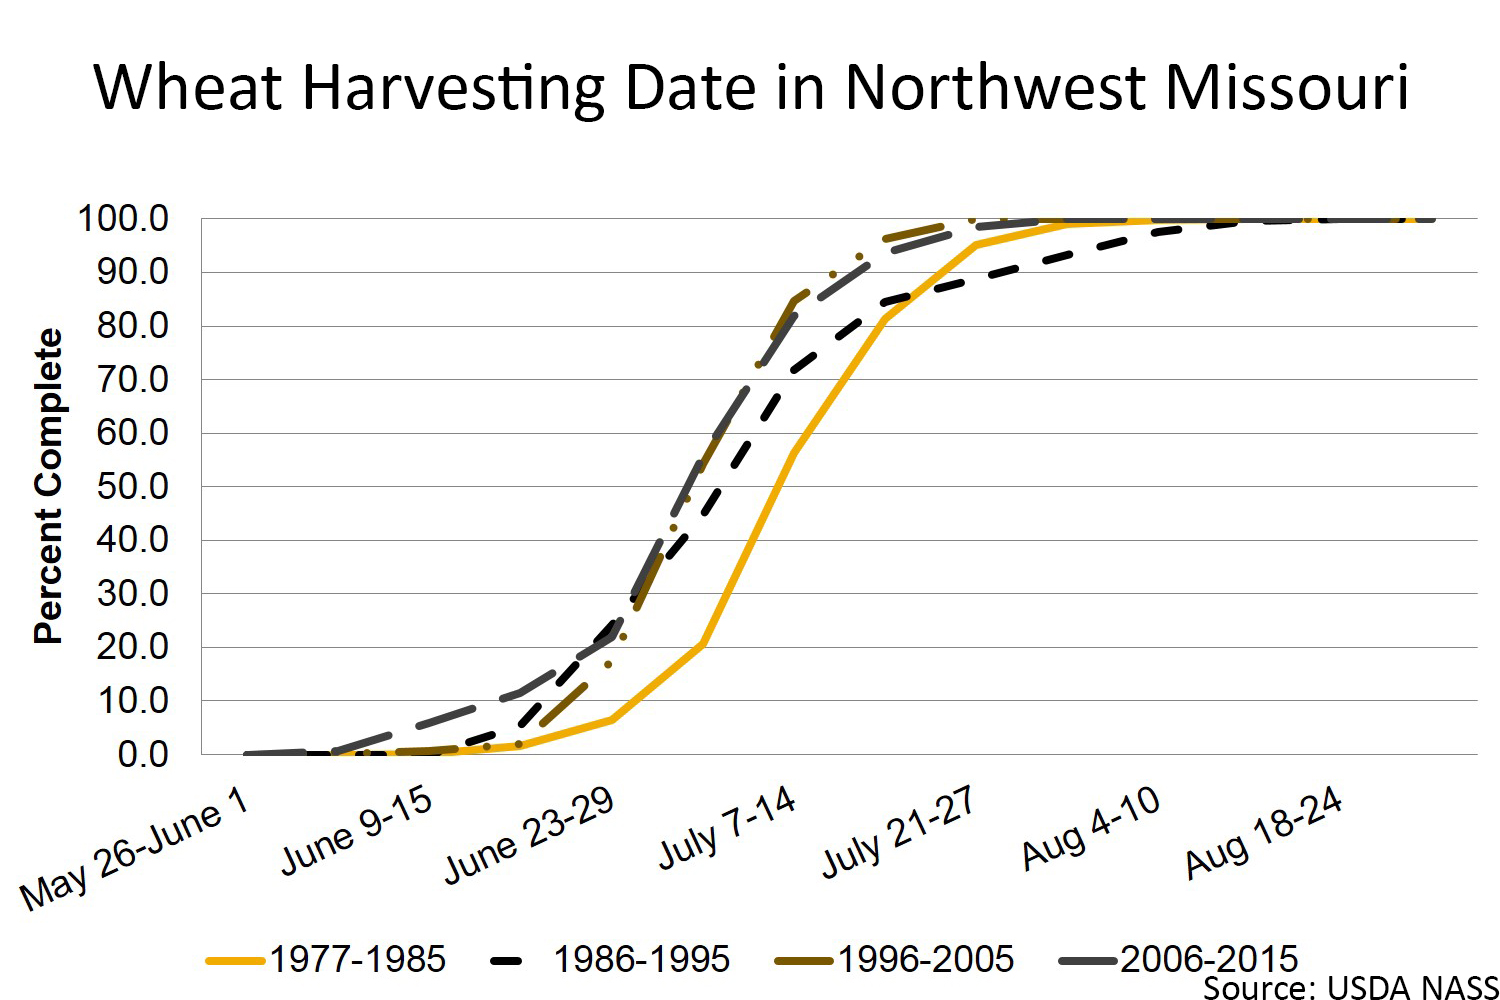
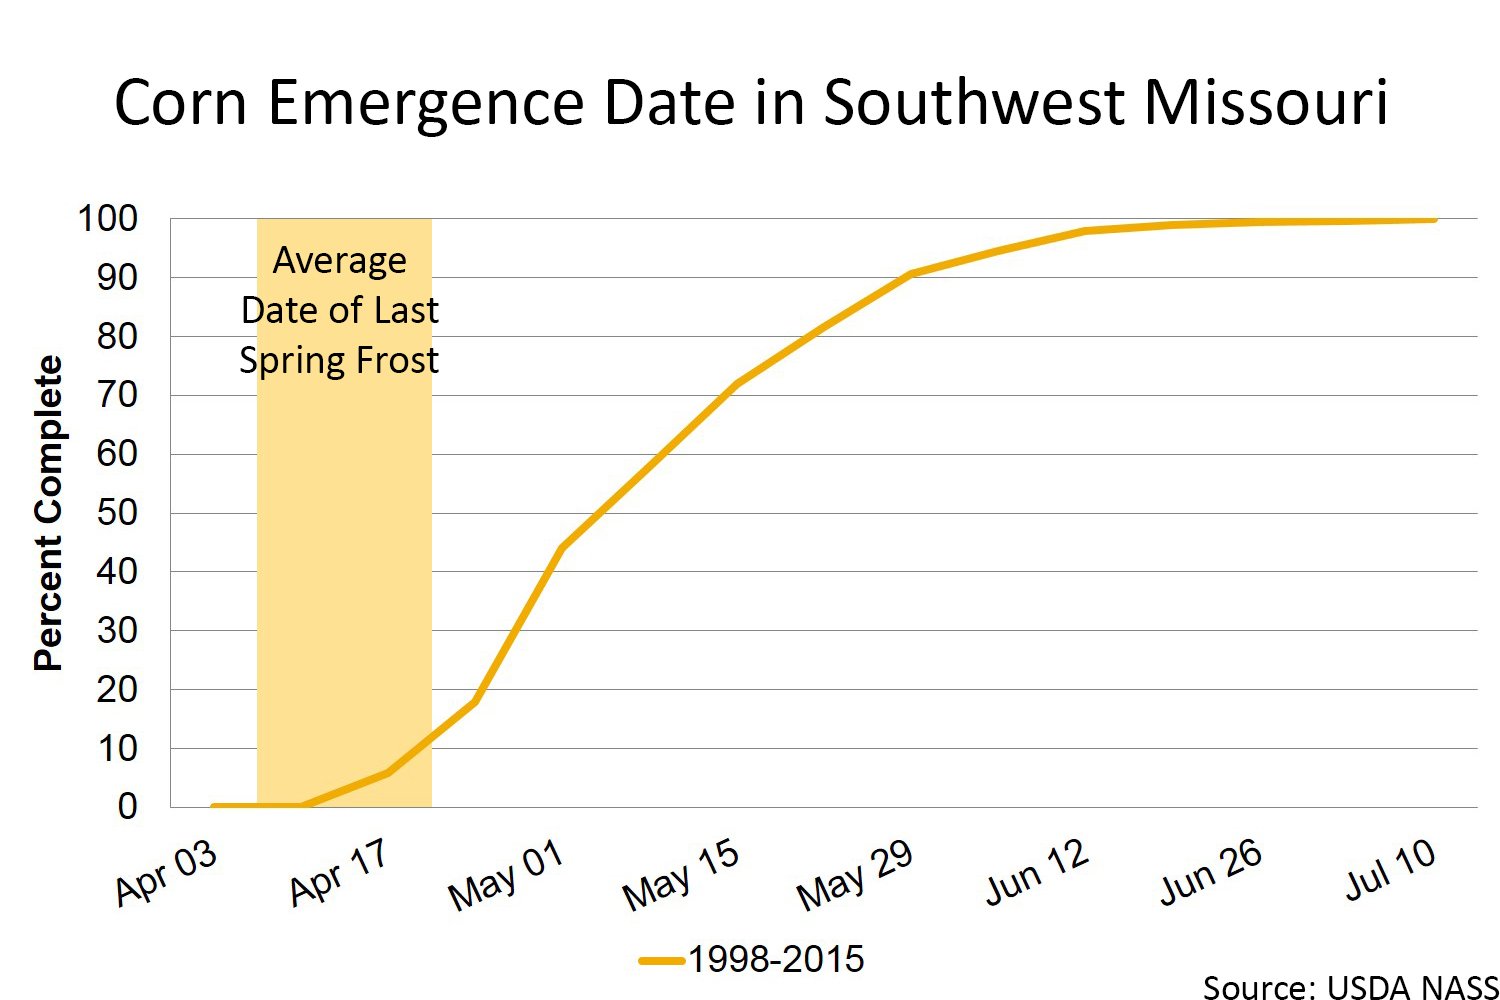
These graphs present the USDA Crop Progress Reports from 1977 to 2015 for the state of Missouri's Northwest (NW) district.
Select the graphs to view a larger image.
Northwest Missouri crop calendar
Soybean
Corn
Wheat
Northwest field working days
| Week Beginning | 25 percentile | 75 percentile range | Average |
|---|---|---|---|
| 28-Mar | 2.2 | 4.2 | 2.9 |
| 4-Apr | 1.7 | 5.2 | 3.4 |
| 11-Apr | 1.7 | 5.2 | 3.3 |
| 18-Apr | 1.8 | 4.5 | 3.1 |
| 25-Apr | 1.5 | 4.7 | 3.2 |
| 2-May | 1.7 | 4.0 | 3.0 |
| 9-May | 1.7 | 4.1 | 3.1 |
| 16-May | 2.0 | 5.5 | 3.6 |
| 23-May | 1.7 | 5.5 | 3.6 |
| 30-May | 2.2 | 5.0 | 3.5 |
| 6-Jun | 2.7 | 5.7 | 4.0 |
| 13-Jun | 2.8 | 6.0 | 4.2 |
| 20-Jun | 3.1 | 5.7 | 4.2 |
| 27-Jun | 3.9 | 5.3 | 4.6 |
| 4-Jul | 3.8 | 6.1 | 4.9 |
| 11-Jul | 3.8 | 6.1 | 4.7 |
| 18-Jul | 4.4 | 6.3 | 5.1 |
| 25-Jul | 3.6 | 6.5 | 5.1 |
| 1-Aug | 3.9 | 6.5 | 5.0 |
| 8-Aug | 4.6 | 6.5 | 5.3 |
| 15-Aug | 3.7 | 5.9 | 4.9 |
| 22-Aug | 4.1 | 6.3 | 4.9 |
| 29-Aug | 4.6 | 6.6 | 5.1 |
| 5-Sep | 4.4 | 6.4 | 5.2 |
| 12-Sep | 4.4 | 6.3 | 5.0 |
| 19-Sep | 4.2 | 5.8 | 4.7 |
| 26-Sep | 4.6 | 6.5 | 5.1 |
| 3-Oct | 4.0 | 6.2 | 4.9 |
| 10-Oct | 4.2 | 6.2 | 5.1 |
| 17-Oct | 3.6 | 6.0 | 4.7 |
| 24-Oct | 2.9 | 5.9 | 4.4 |
| 31-Oct | 2.6 | 6.3 | 4.3 |
| 7-Nov | 2.6 | 6.2 | 4.3 |
| 14-Nov | 2.6 | 5.8 | 4.3 |
| 21-Nov | 2.2 | 4.9 | 3.8 |
| 28-Nov | 3.4 | 4.8 | 4.0 |
| 5-Dec | 1.6 | 3.9 | 2.8 |
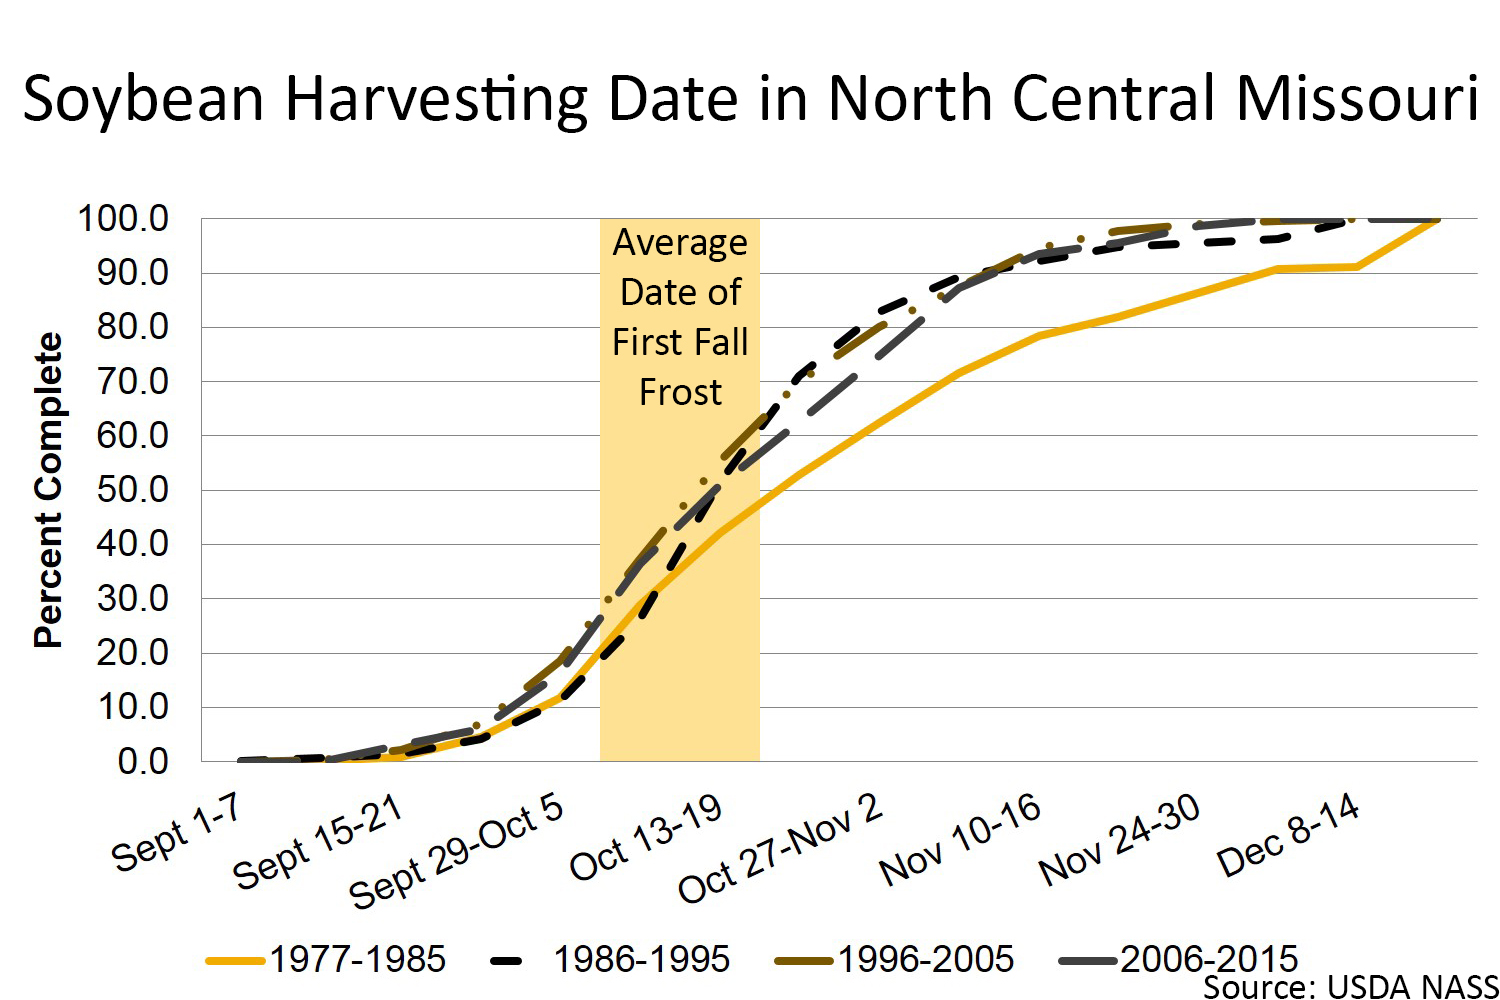
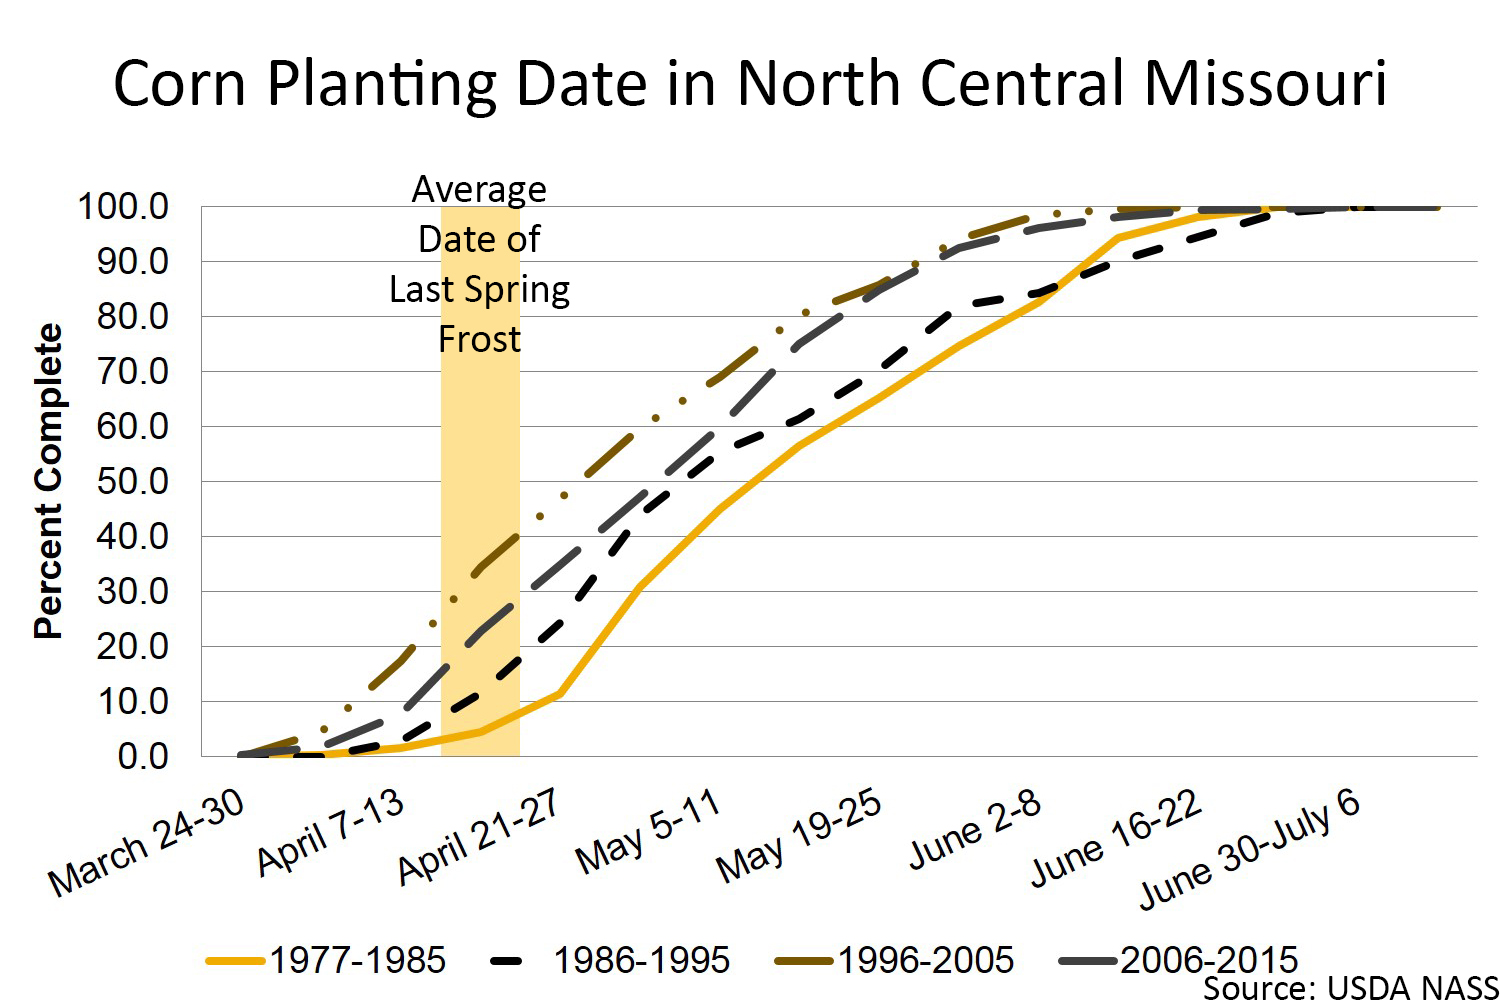
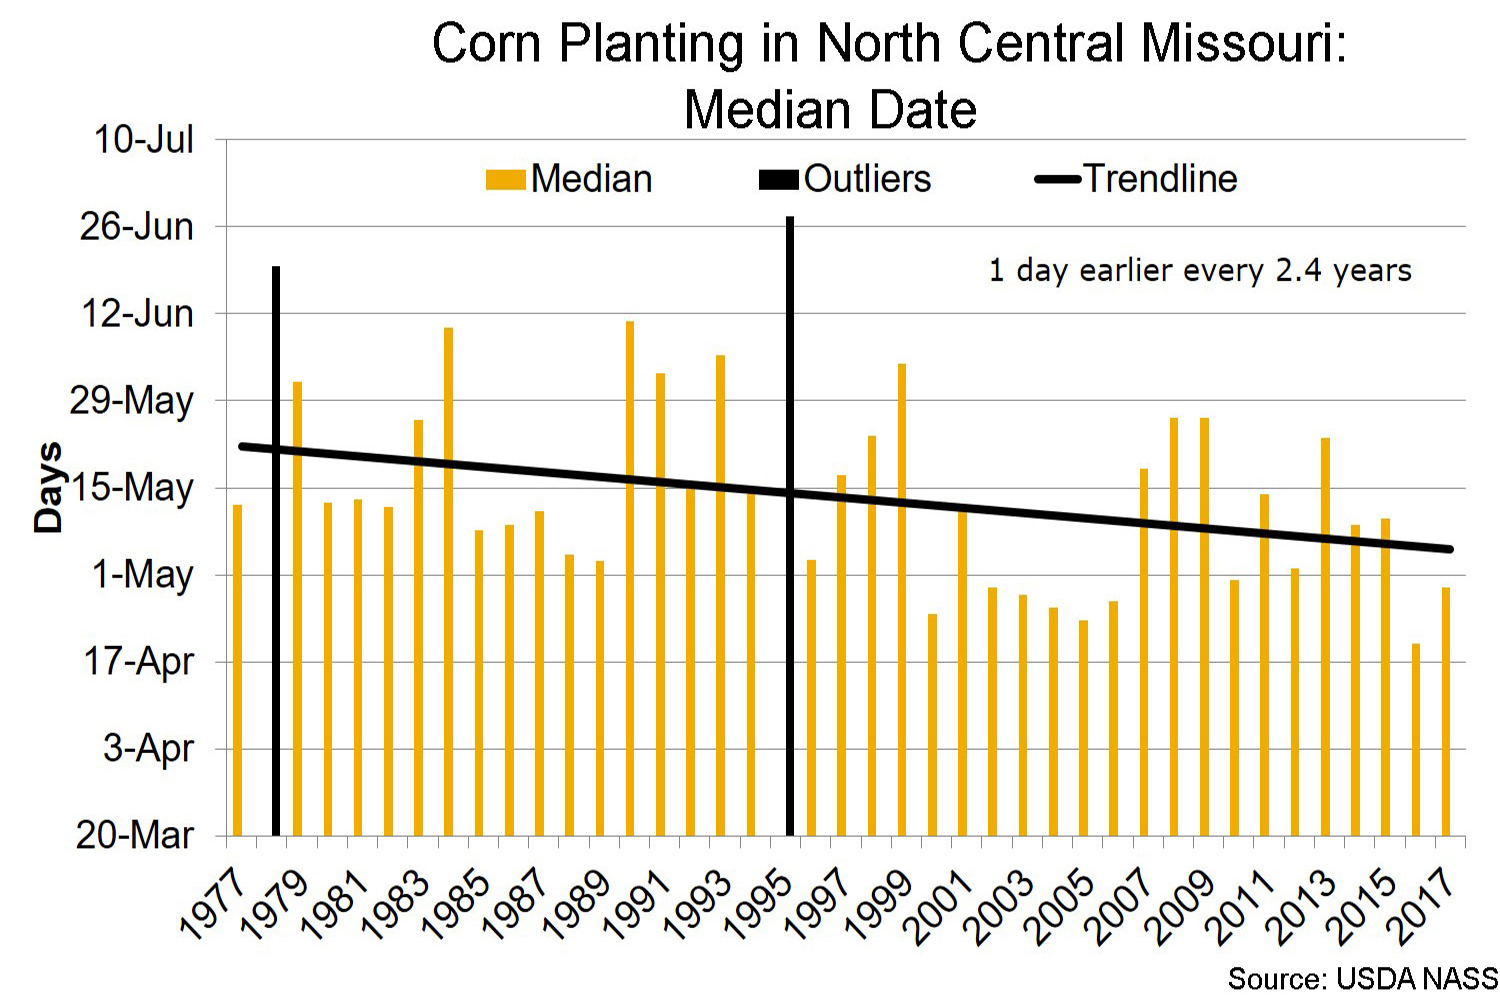
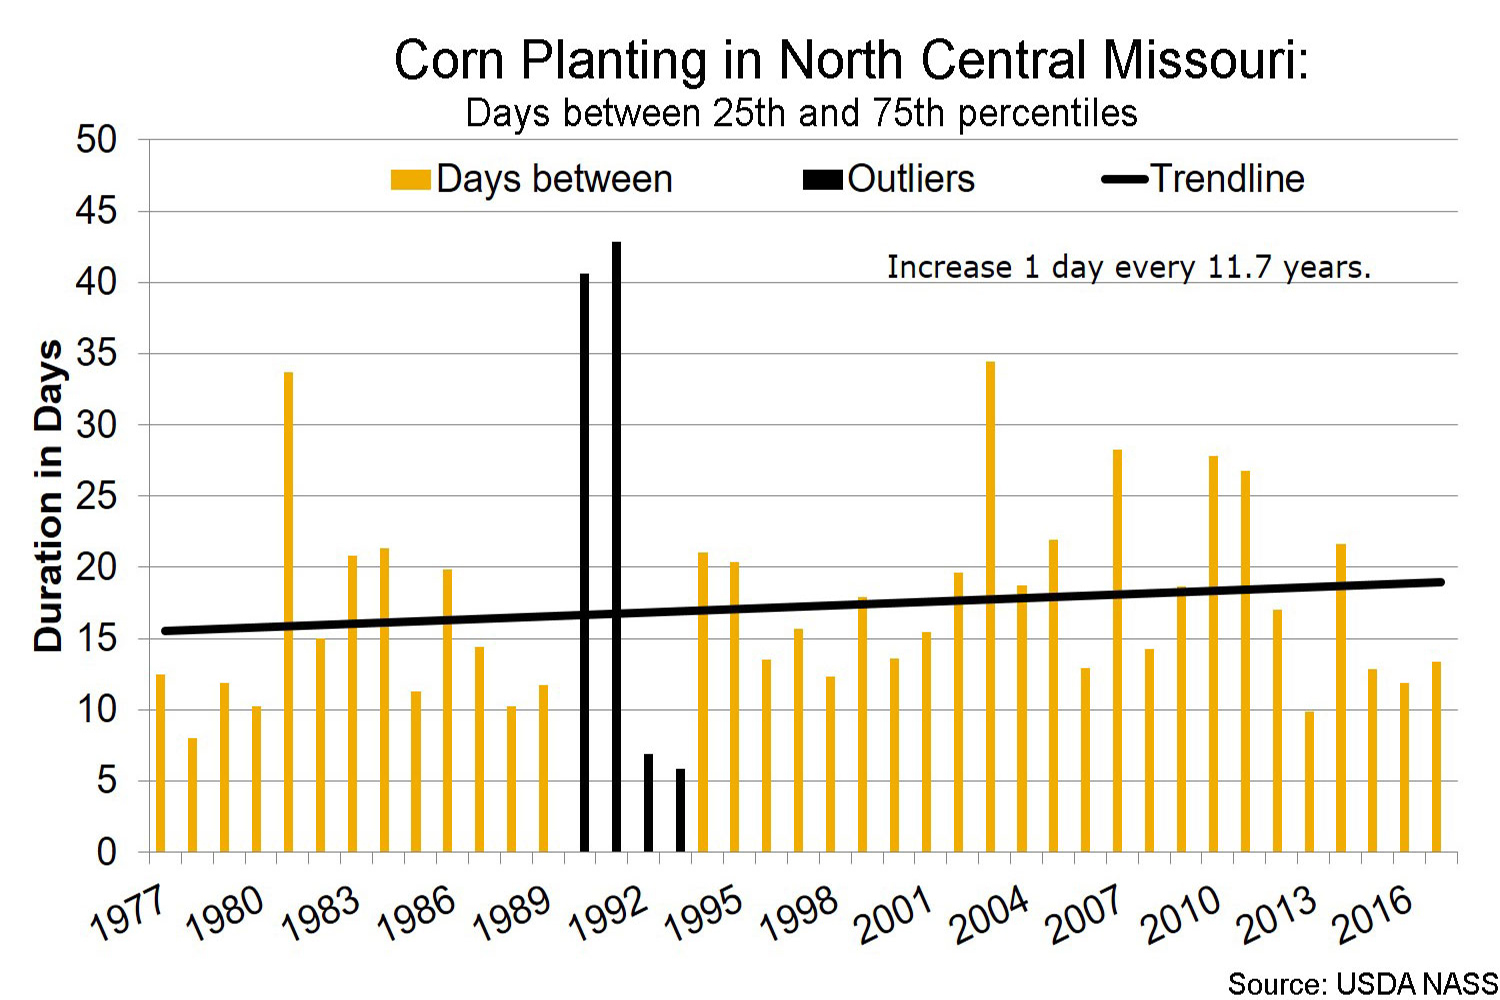
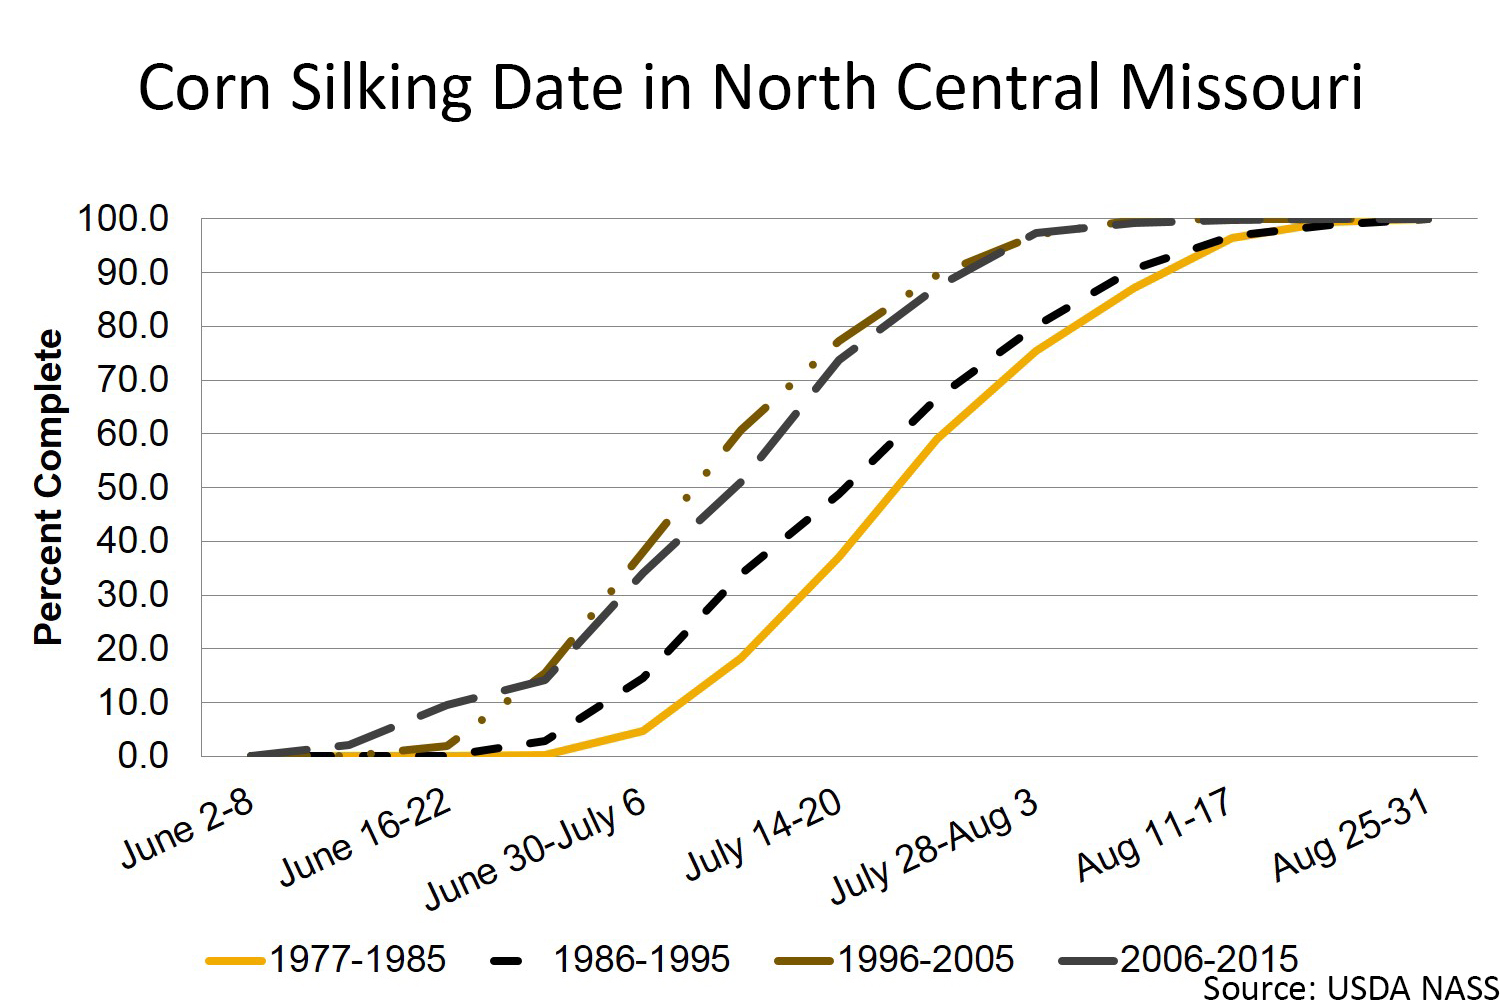
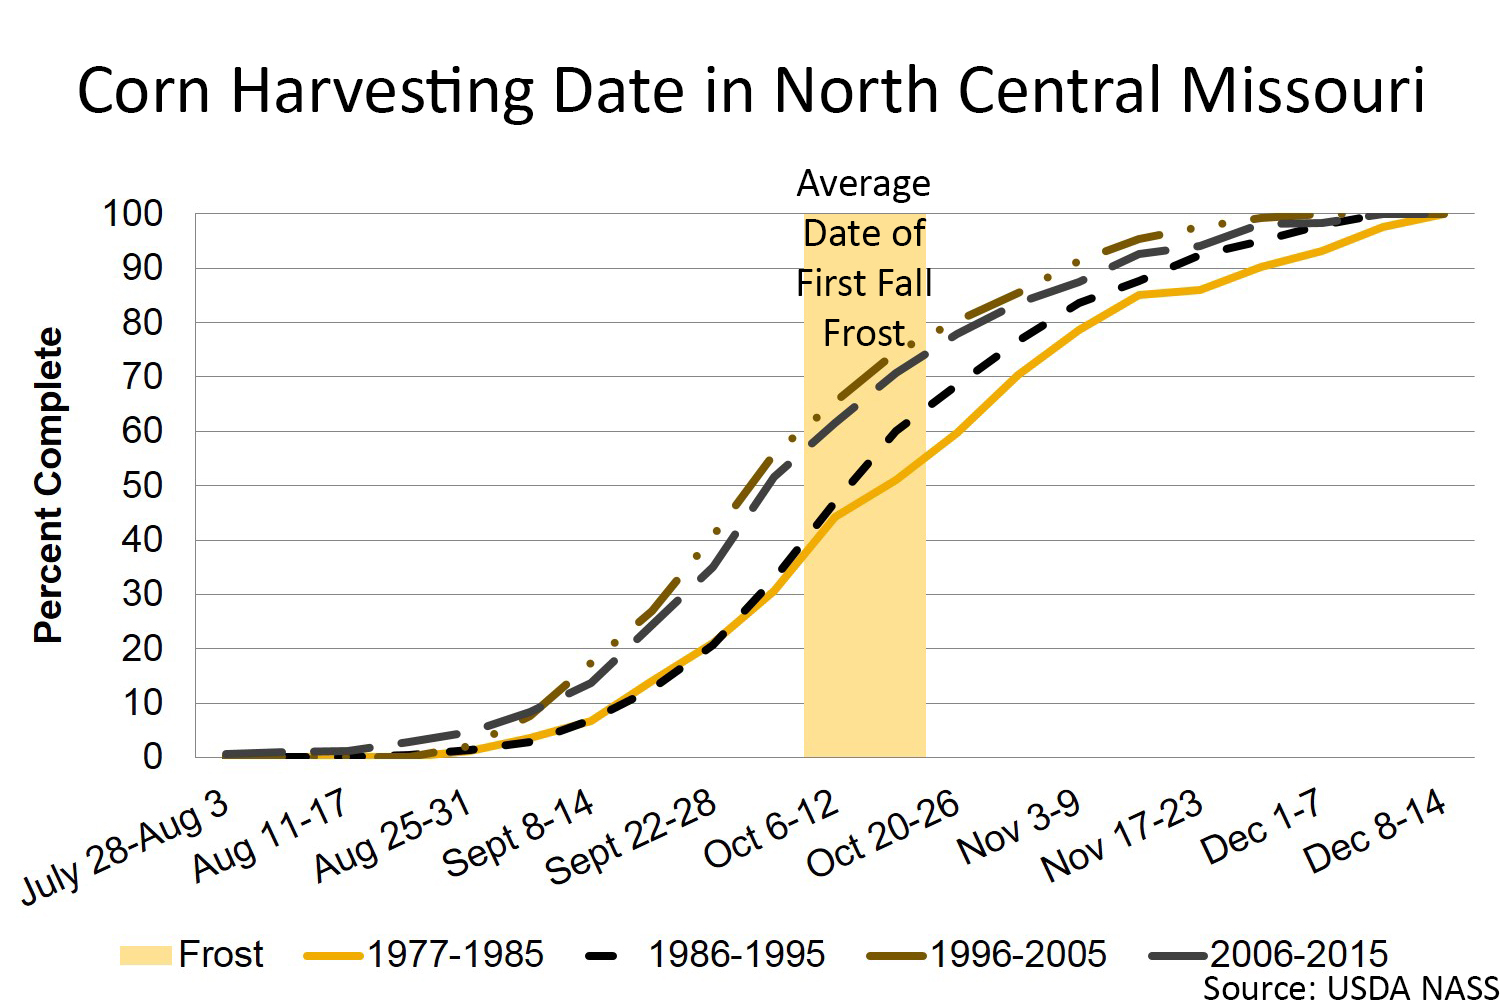
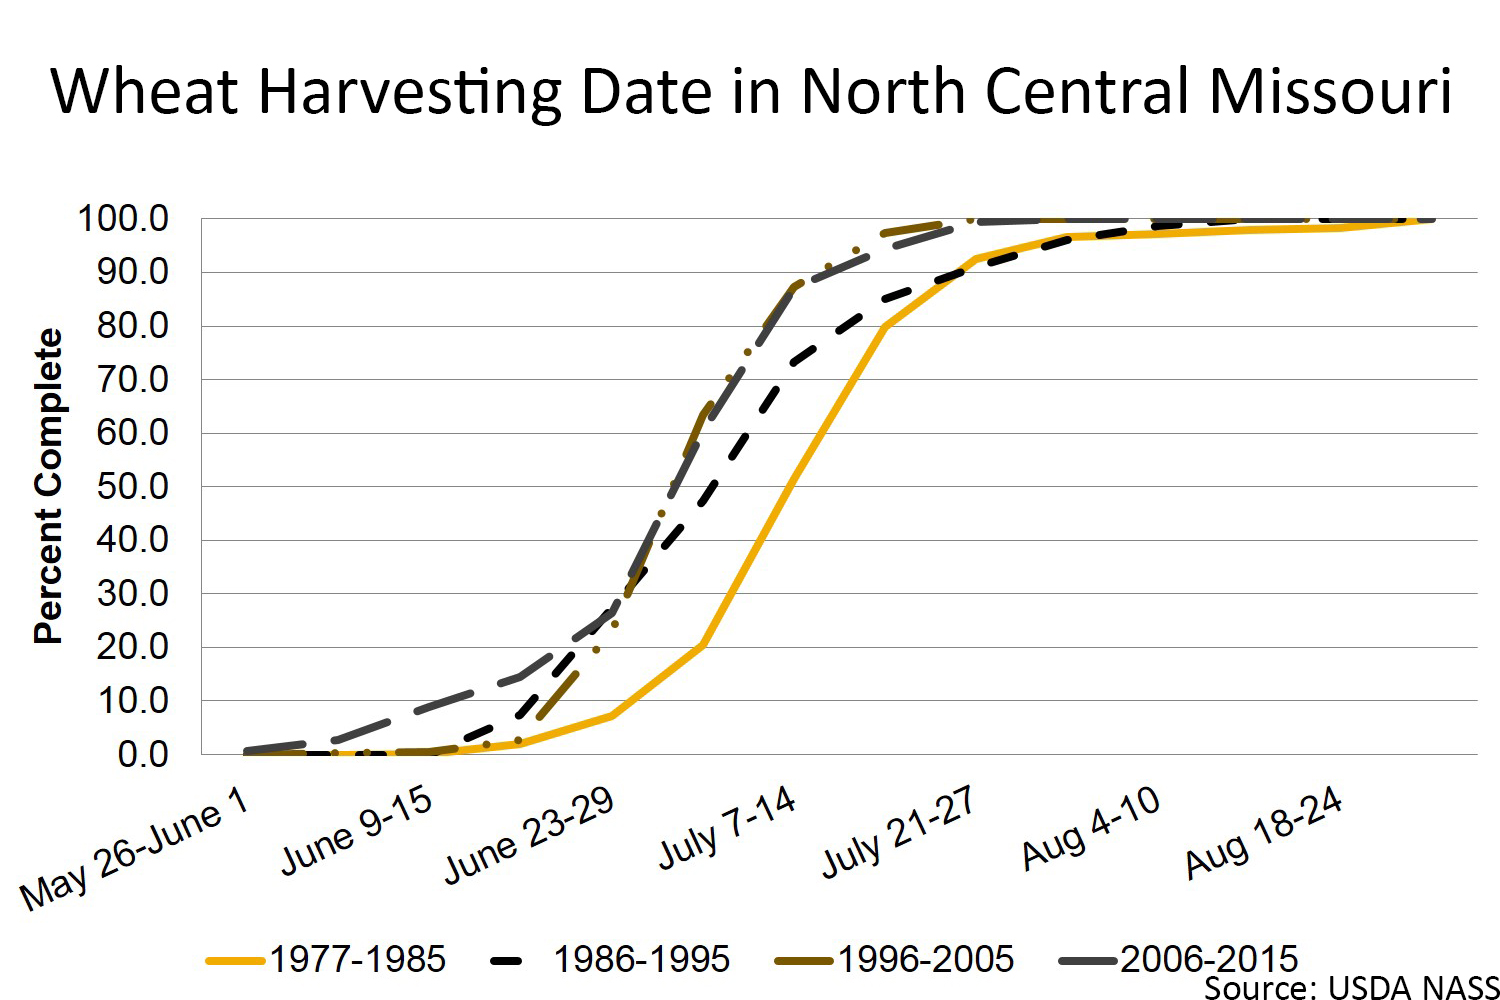
These graphs present the USDA Crop Progress Reports from 1977 to 2015 for the state of Missouri's North Central (NC) district.
North Central Missouri crop calendar
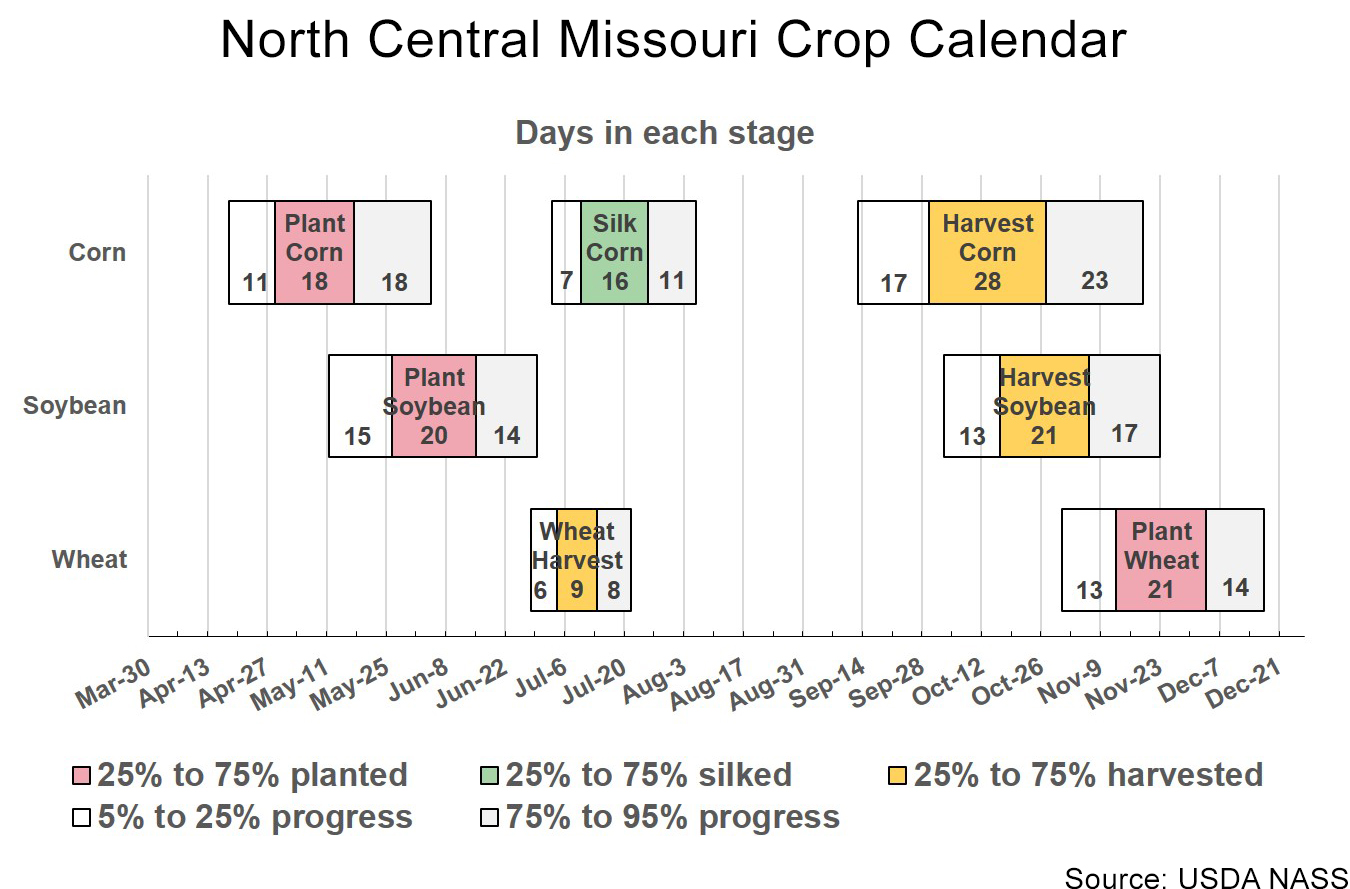
Soybean

Corn

Wheat
North Central field working days
| Week Beginning | 25 percentile | 75 percentile range | Average |
|---|---|---|---|
| 28-Mar | 1.1 | 3.6 | 2.4 |
| 4-Apr | 1.2 | 4.7 | 3.0 |
| 11-Apr | 1.4 | 4.6 | 3.1 |
| 18-Apr | 0.9 | 4.2 | 2.8 |
| 25-Apr | 0.9 | 4.8 | 2.9 |
| 2-May | 1.1 | 4.2 | 2.7 |
| 9-May | 1.7 | 4.2 | 3.0 |
| 16-May | 1.5 | 5.1 | 3.3 |
| 23-May | 1.6 | 4.8 | 3.3 |
| 30-May | 2.5 | 5.3 | 3.5 |
| 6-Jun | 2.4 | 5.2 | 3.8 |
| 13-Jun | 2.2 | 5.2 | 3.8 |
| 20-Jun | 2.5 | 5.6 | 4.3 |
| 27-Jun | 3.7 | 5.2 | 4.4 |
| 4-Jul | 4.0 | 5.9 | 4.9 |
| 11-Jul | 3.1 | 6.1 | 4.8 |
| 18-Jul | 4.9 | 6.4 | 5.3 |
| 25-Jul | 3.9 | 6.1 | 5.0 |
| 1-Aug | 3.1 | 6.6 | 4.9 |
| 8-Aug | 4.4 | 6.6 | 5.3 |
| 15-Aug | 4.2 | 6.2 | 4.9 |
| 22-Aug | 4.2 | 6.2 | 5.0 |
| 29-Aug | 4.4 | 6.6 | 5.2 |
| 5-Sep | 4.6 | 6.2 | 5.2 |
| 12-Sep | 4.1 | 6.3 | 4.9 |
| 19-Sep | 3.4 | 5.8 | 4.5 |
| 26-Sep | 3.9 | 6.4 | 5.0 |
| 3-Oct | 4.3 | 6.2 | 4.9 |
| 10-Oct | 3.6 | 6.0 | 4.9 |
| 17-Oct | 3.7 | 5.9 | 4.6 |
| 24-Oct | 3.2 | 5.9 | 4.5 |
| 31-Oct | 2.3 | 5.6 | 4.0 |
| 7-Nov | 2.4 | 6.1 | 4.0 |
| 14-Nov | 3.1 | 5.3 | 4.0 |
| 21-Nov | 1.4 | 5.1 | 3.3 |
| 28-Nov | 1.5 | 3.9 | 2.8 |
| 5-Dec | 1.0 | 3.0 | 2.2 |
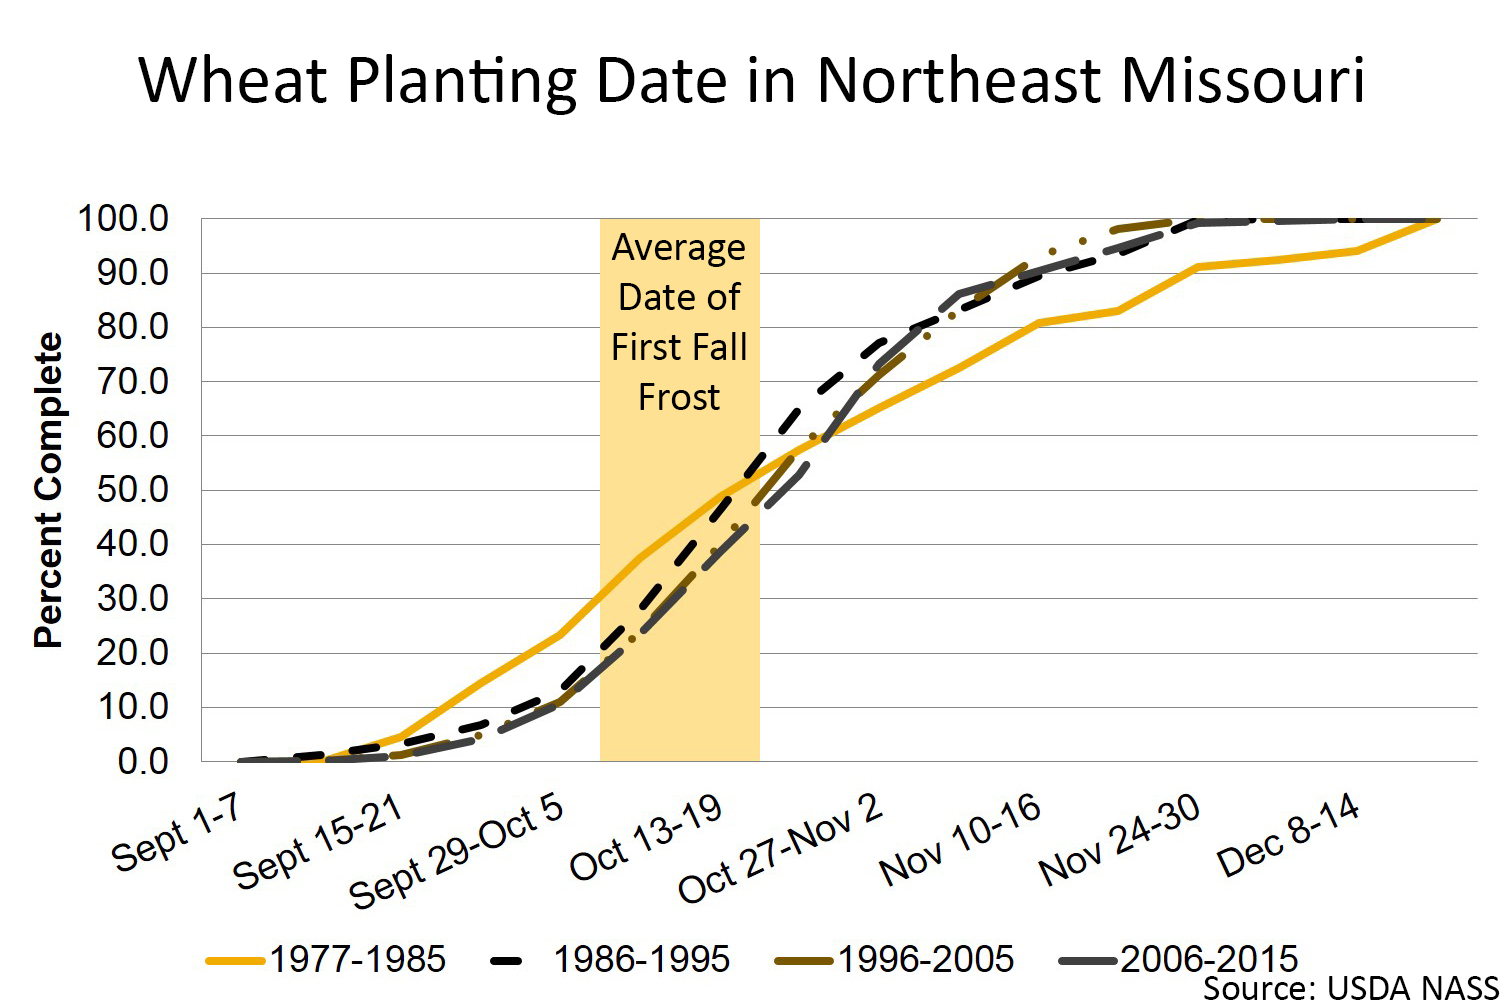
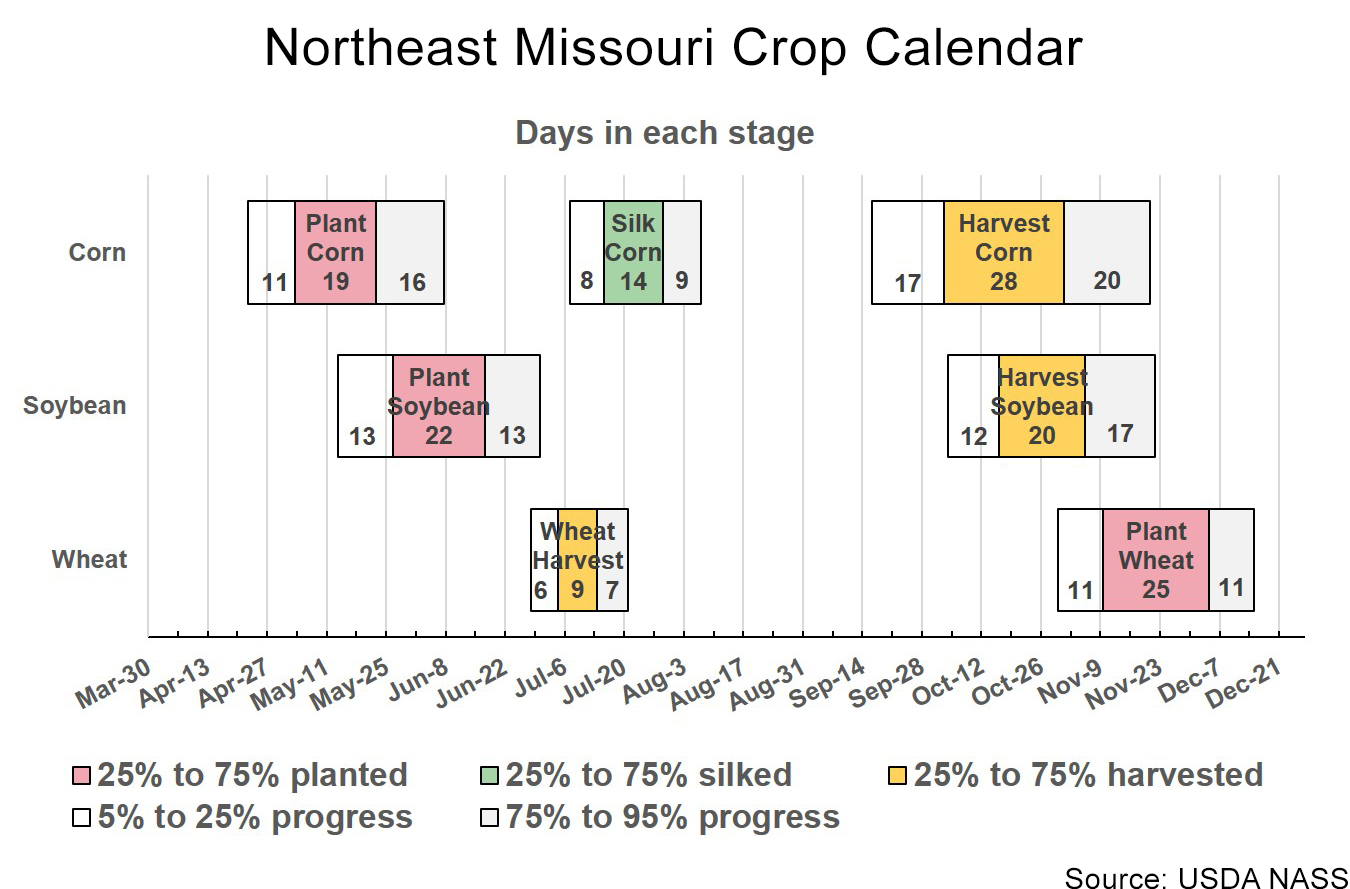
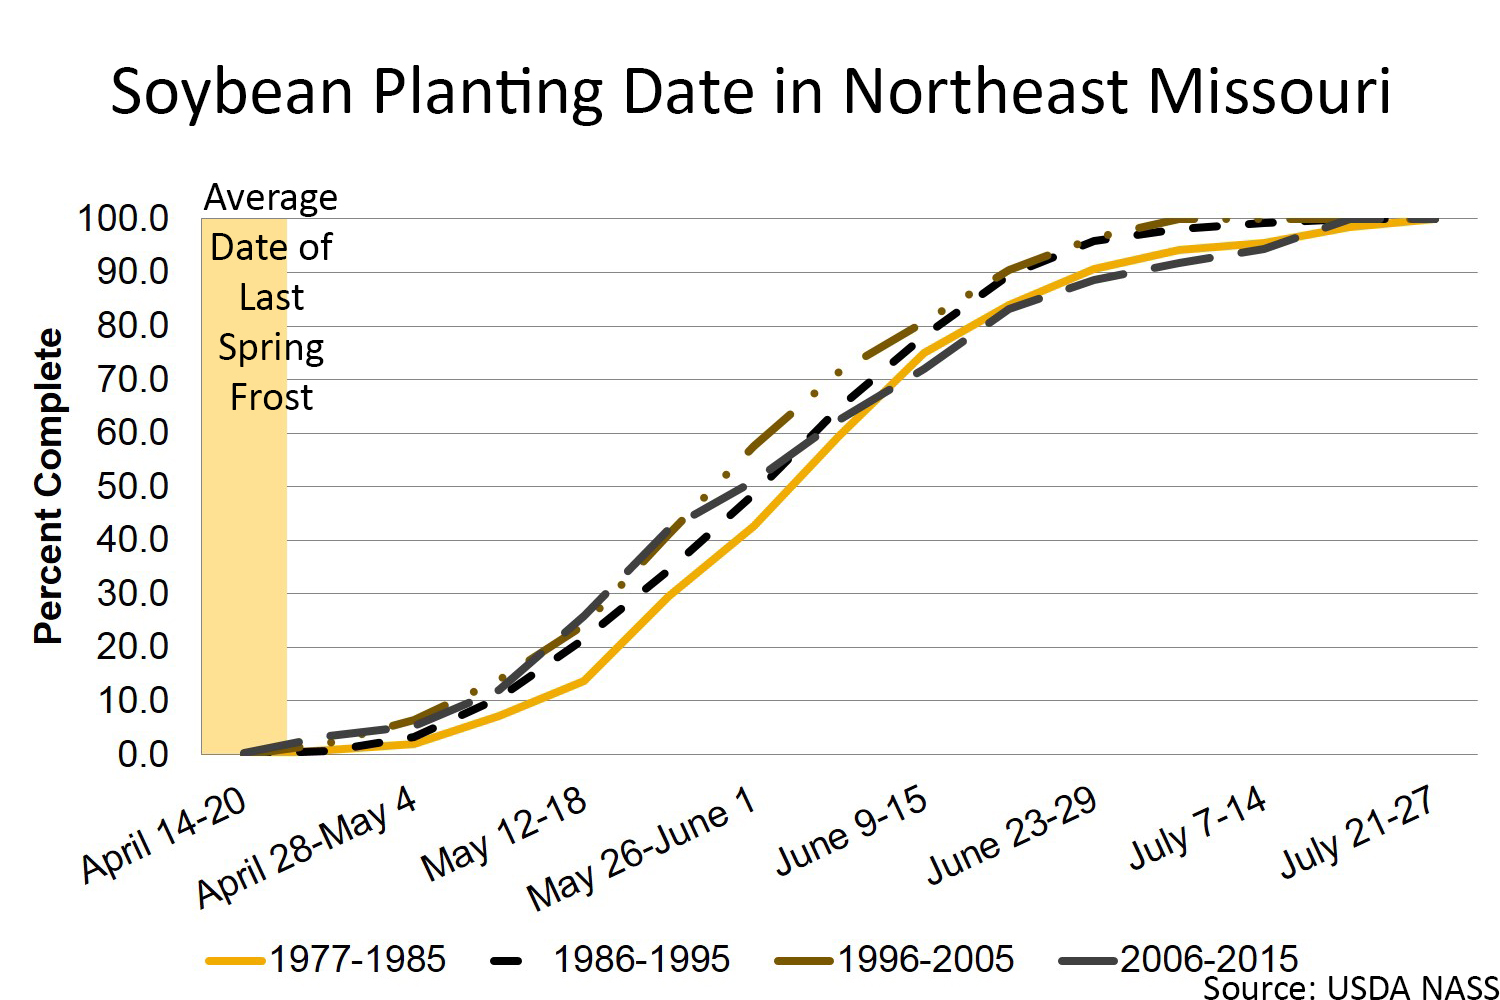
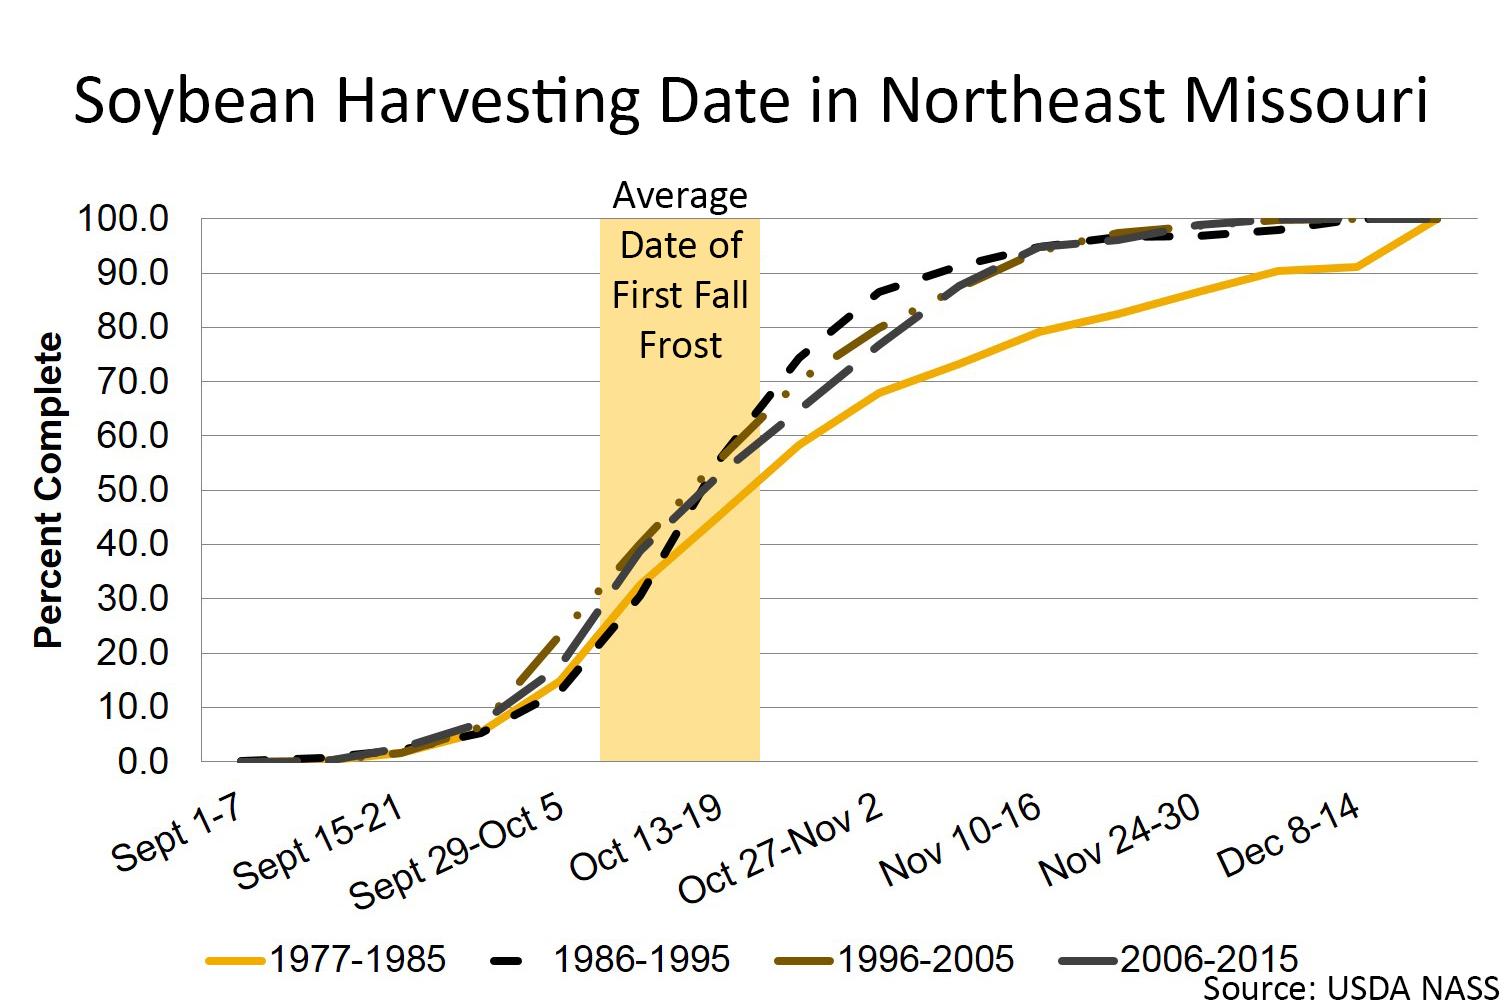
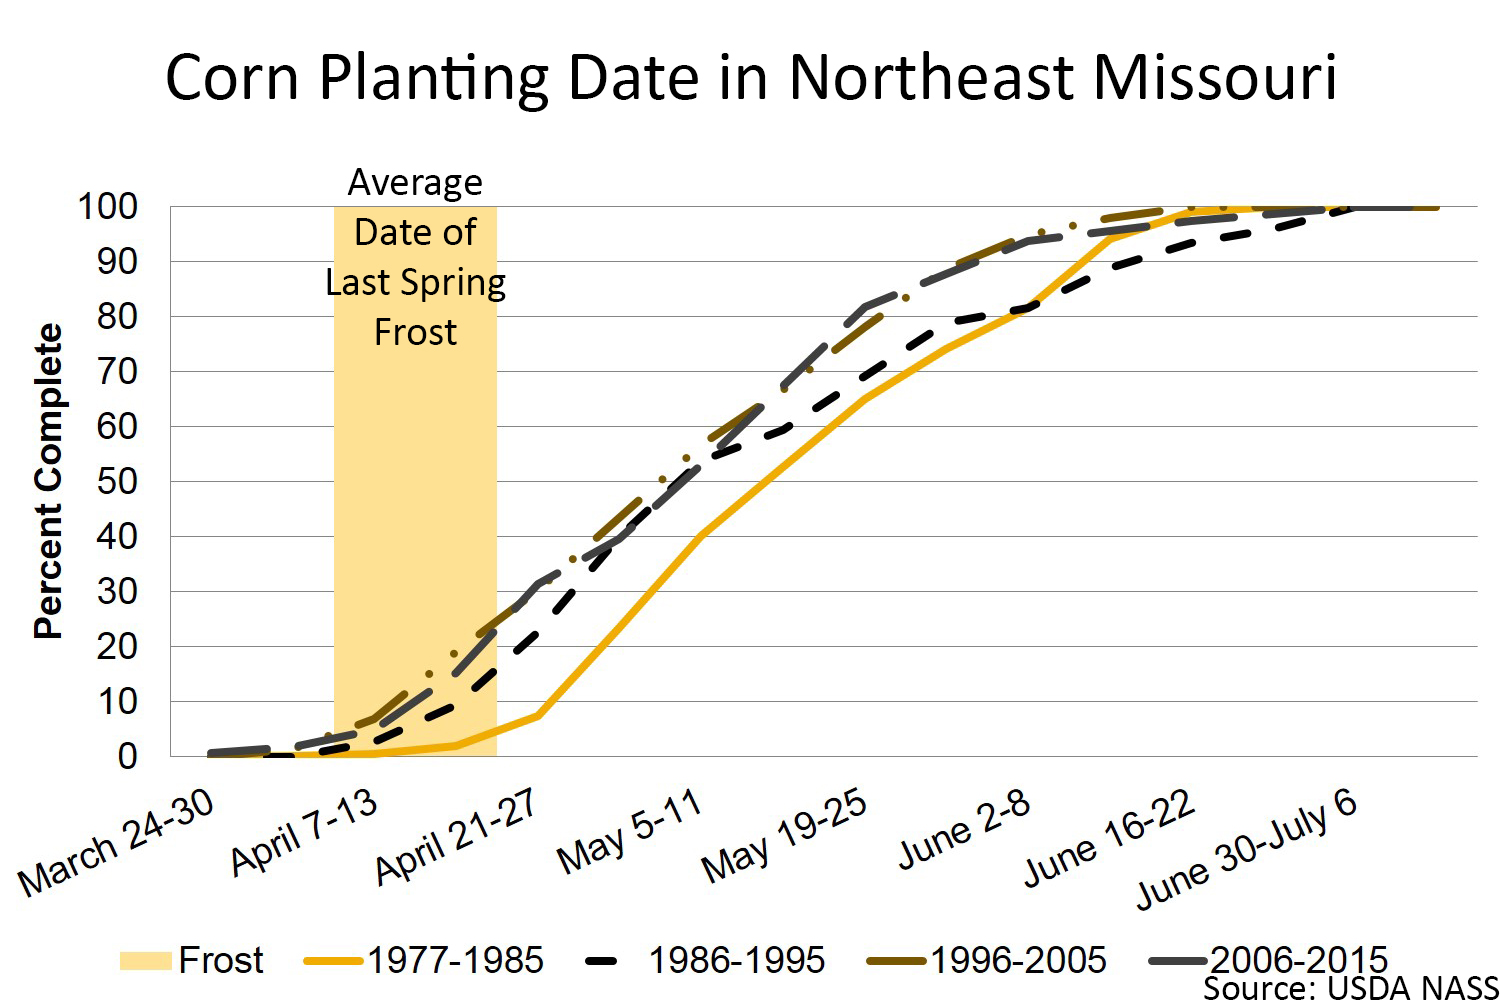
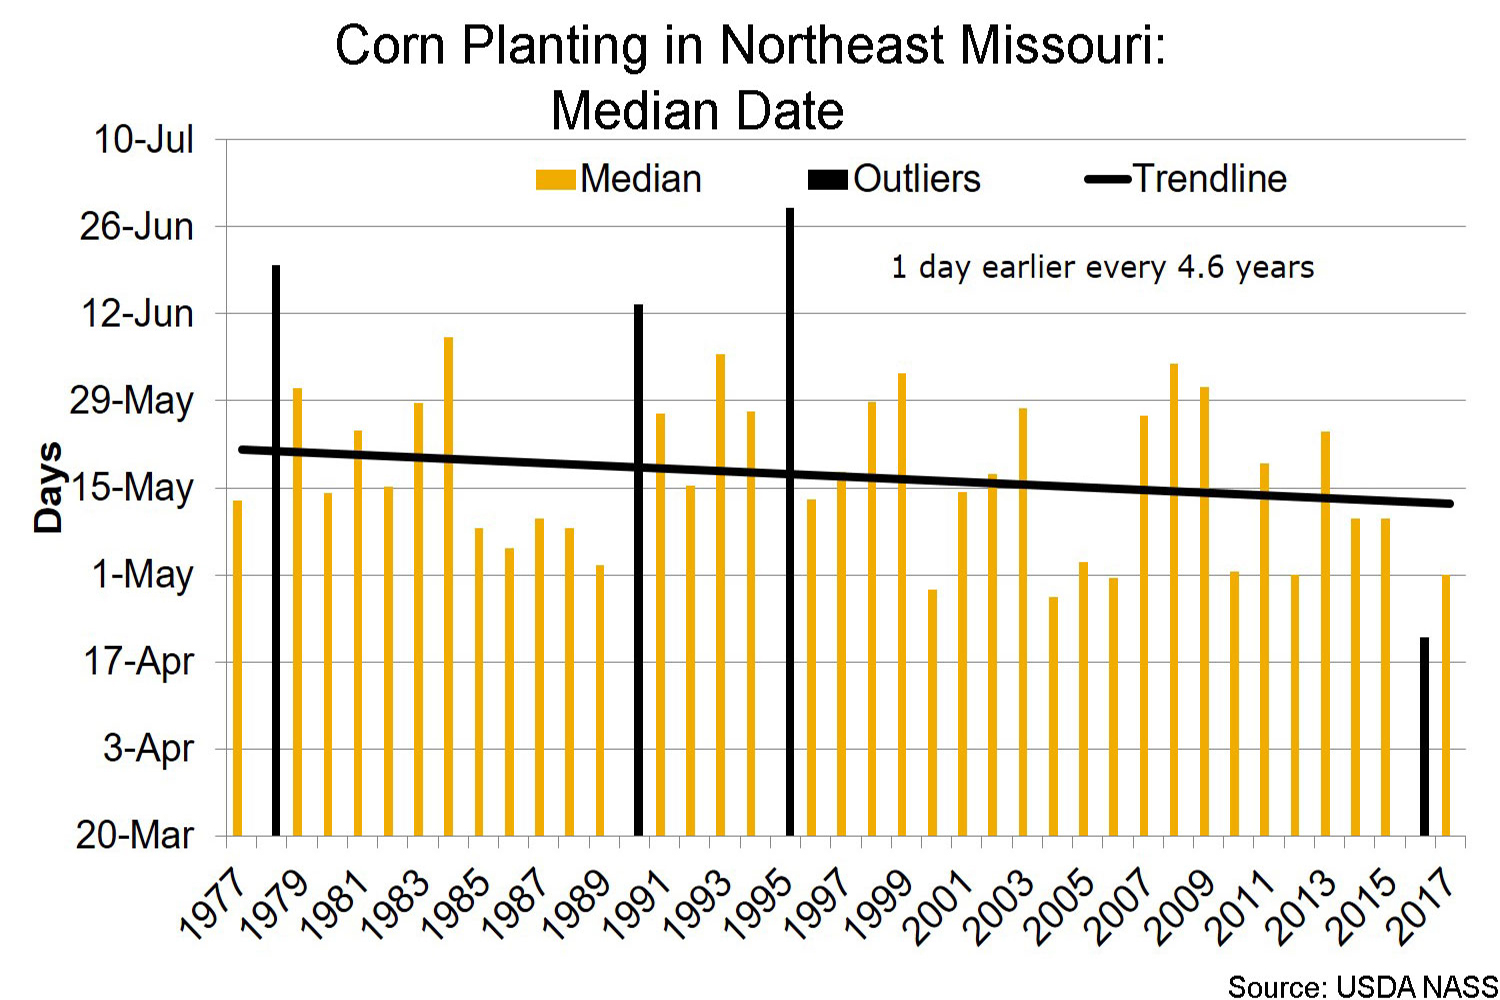
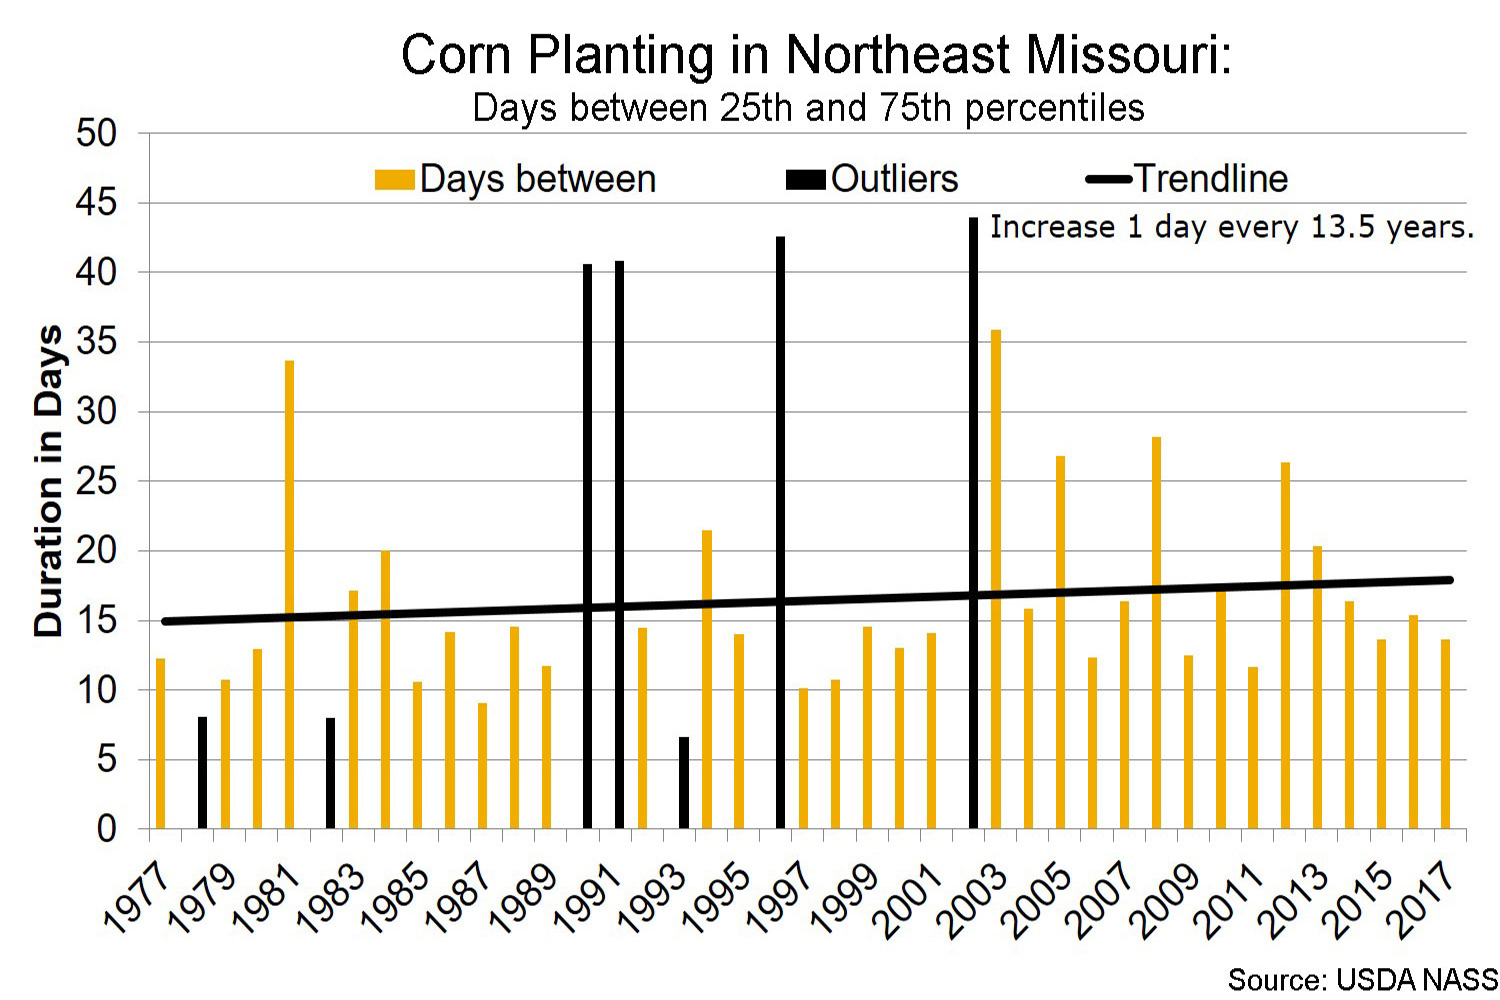
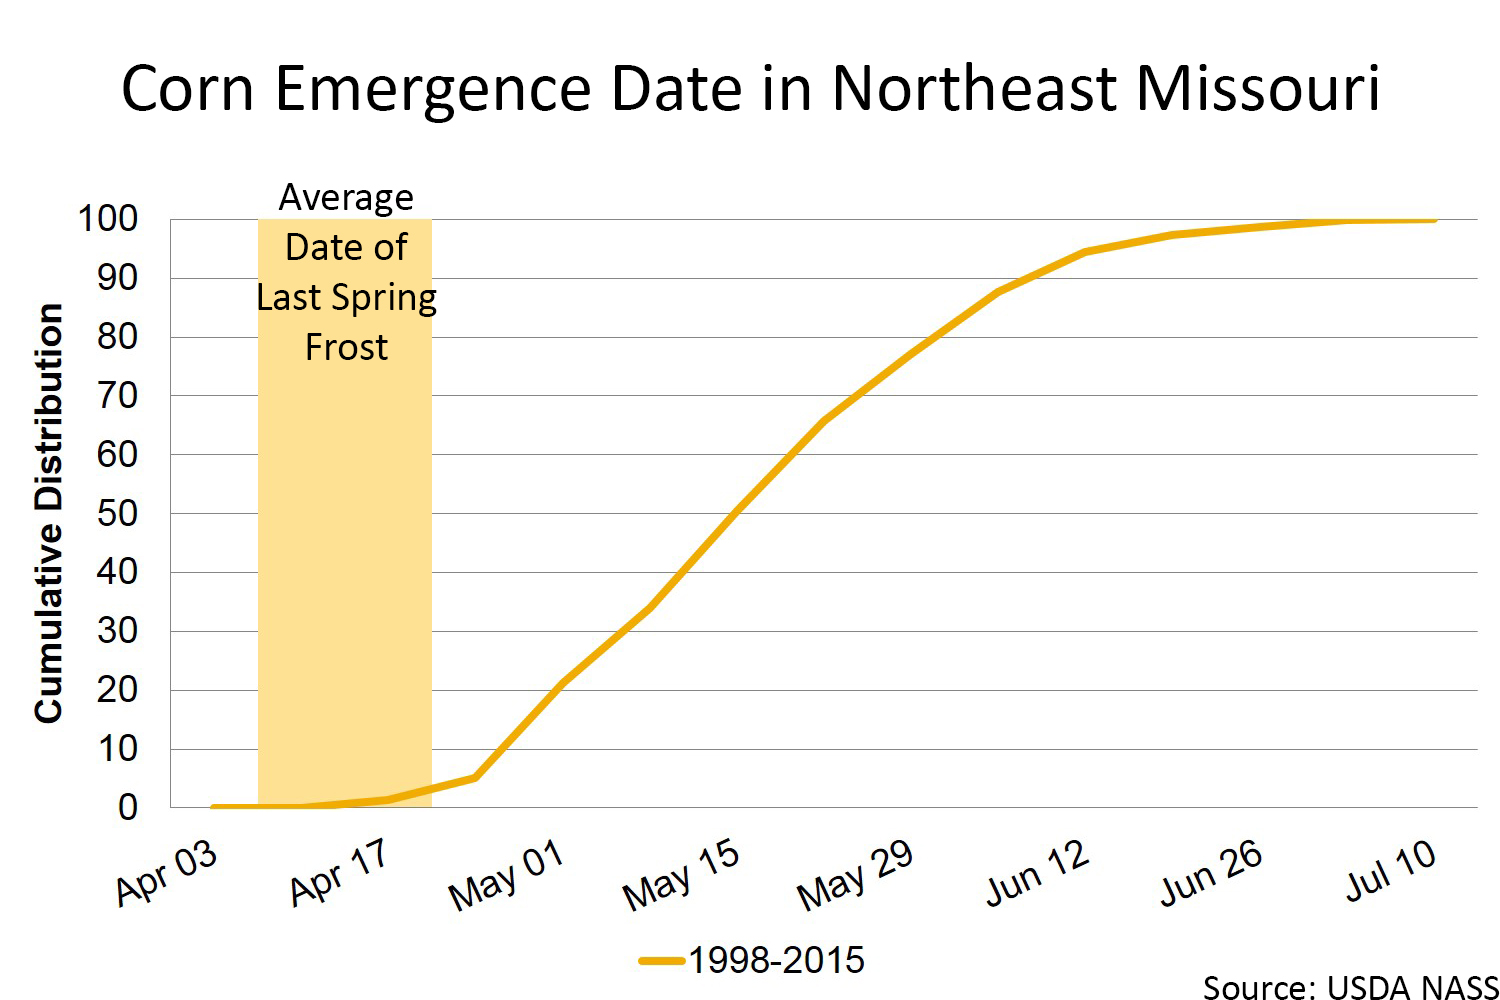
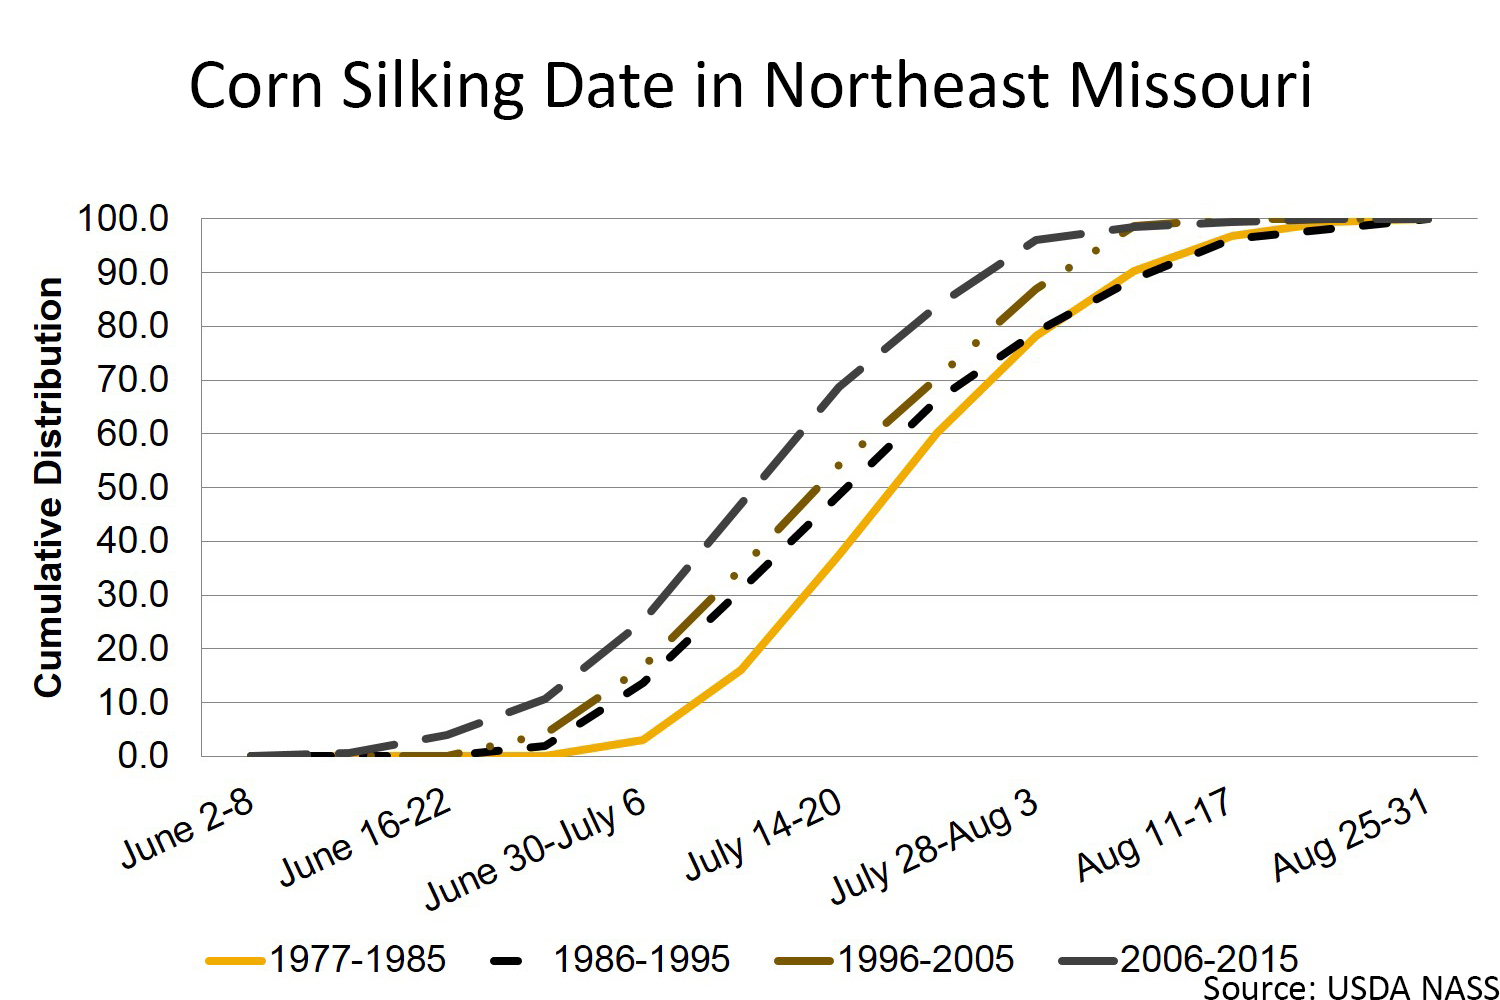
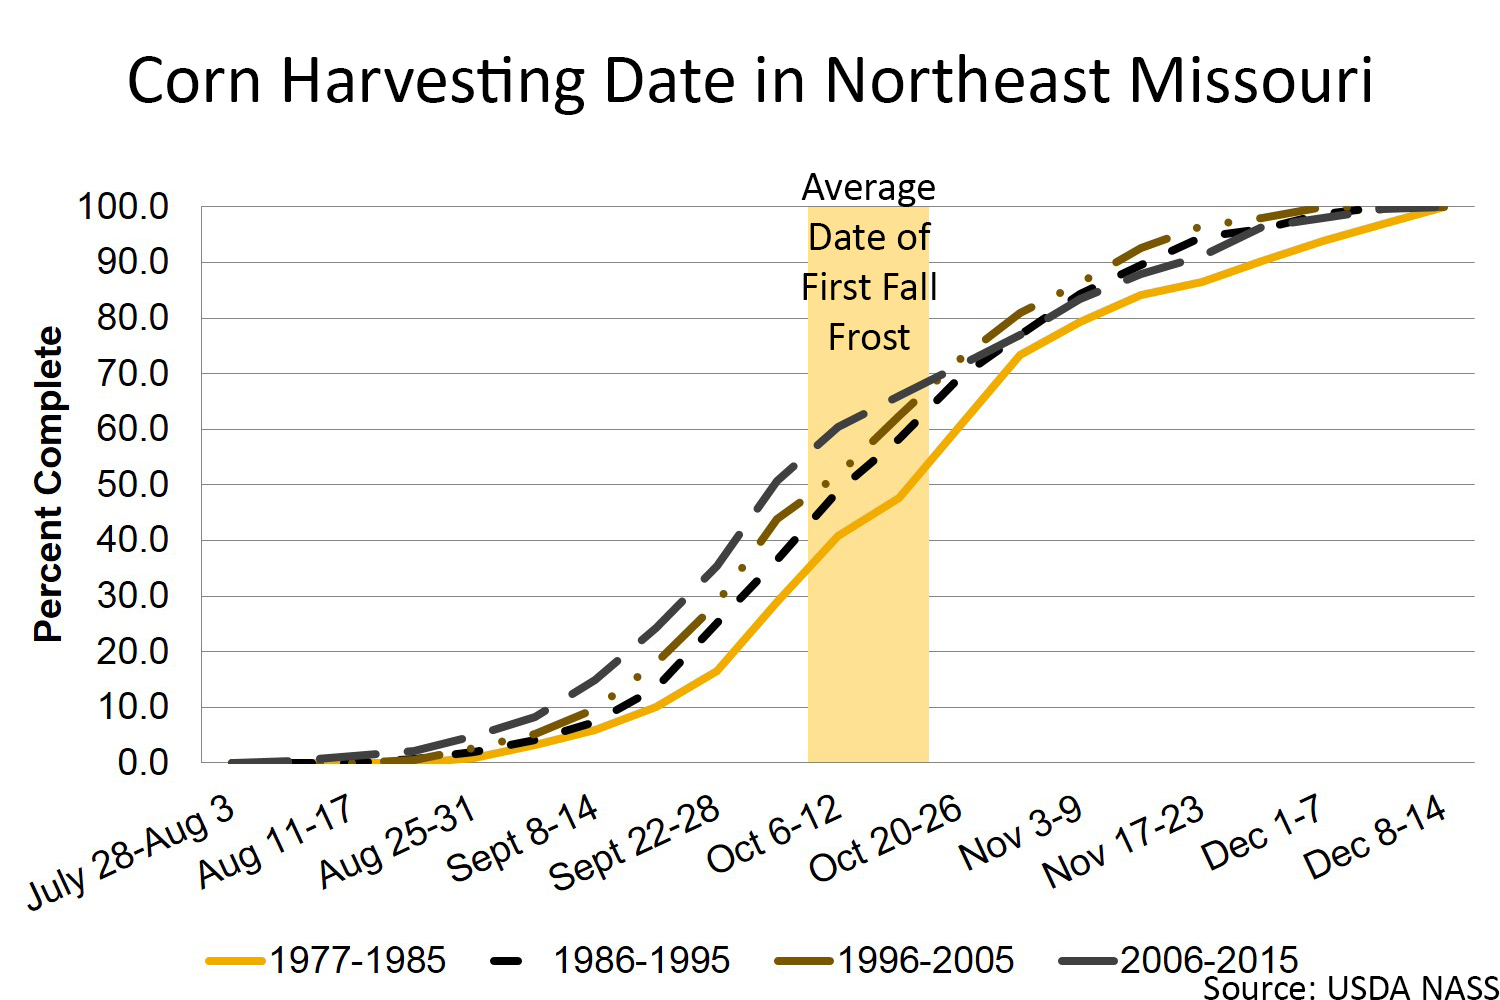
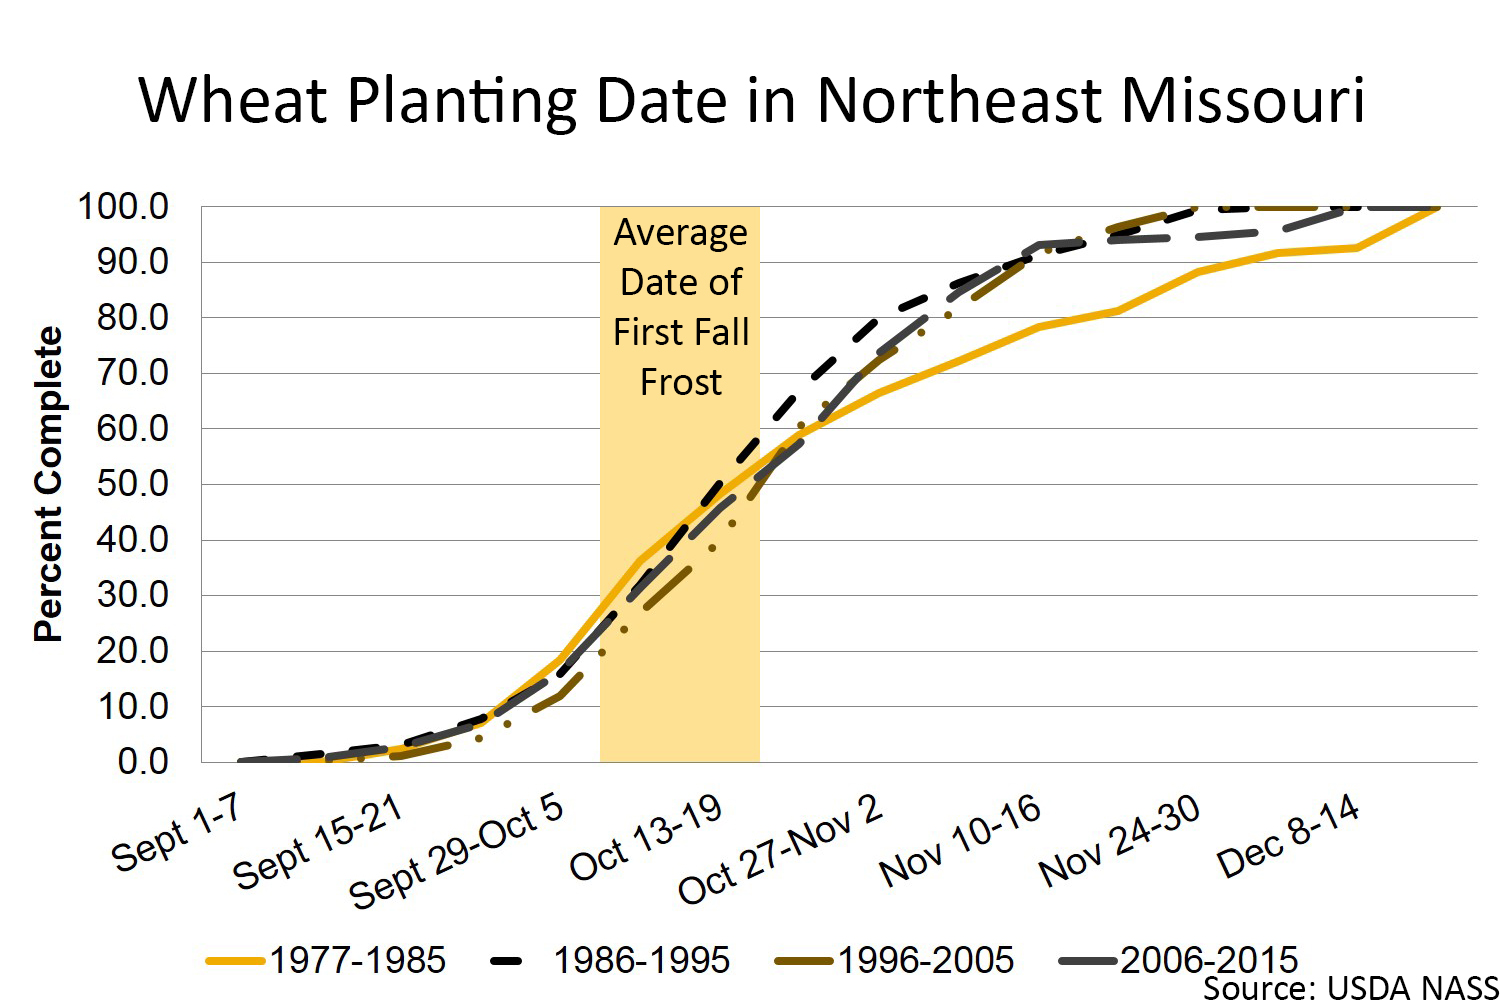
These graphs present the USDA Crop Progress Reports from 1977 to 2015 for the state of Missouri's Northeast (NE) district.
Northeast Missouri crop calendar
Soybean
Corn
Wheat
Northeast field working days
| Week Beginning | 25 percentile | 75 percentile range | Average |
|---|---|---|---|
| 28-Mar | 1.2 | 3.2 | 2.5 |
| 4-Apr | 1.0 | 4.4 | 2.8 |
| 11-Apr | 1.3 | 4.9 | 3.1 |
| 18-Apr | 0.9 | 4.5 | 2.9 |
| 25-Apr | 0.6 | 4.7 | 2.7 |
| 2-May | 0.9 | 4.1 | 2.7 |
| 9-May | 1.6 | 4.4 | 3.1 |
| 16-May | 1.3 | 5.5 | 3.3 |
| 23-May | 2.0 | 5.2 | 3.4 |
| 30-May | 1.7 | 5.2 | 3.5 |
| 6-Jun | 2.3 | 5.4 | 4.0 |
| 13-Jun | 2.4 | 5.7 | 3.9 |
| 20-Jun | 3.9 | 5.9 | 4.7 |
| 27-Jun | 4.2 | 6.1 | 4.9 |
| 4-Jul | 4.1 | 6.3 | 5.0 |
| 11-Jul | 3.5 | 6.4 | 4.9 |
| 18-Jul | 4.8 | 6.2 | 5.3 |
| 25-Jul | 4.7 | 6.4 | 5.1 |
| 1-Aug | 4.2 | 6.6 | 5.2 |
| 8-Aug | 4.5 | 6.5 | 5.4 |
| 15-Aug | 4.7 | 6.4 | 5.4 |
| 22-Aug | 4.1 | 6.5 | 5.1 |
| 29-Aug | 5.0 | 6.5 | 5.5 |
| 5-Sep | 4.5 | 6.5 | 5.5 |
| 12-Sep | 4.8 | 6.6 | 5.3 |
| 19-Sep | 3.6 | 6.3 | 4.9 |
| 26-Sep | 3.7 | 6.5 | 5.1 |
| 3-Oct | 3.9 | 6.1 | 5.0 |
| 10-Oct | 3.5 | 6.1 | 4.9 |
| 17-Oct | 4.2 | 6.0 | 4.8 |
| 24-Oct | 3.2 | 5.9 | 4.7 |
| 31-Oct | 3.1 | 5.9 | 4.4 |
| 7-Nov | 2.1 | 6.2 | 4.2 |
| 14-Nov | 3.5 | 5.4 | 4.2 |
| 21-Nov | 1.6 | 5.2 | 3.4 |
| 28-Nov | 1.4 | 3.3 | 2.5 |
| 5-Dec | 1.4 | 2.9 | 2.5 |
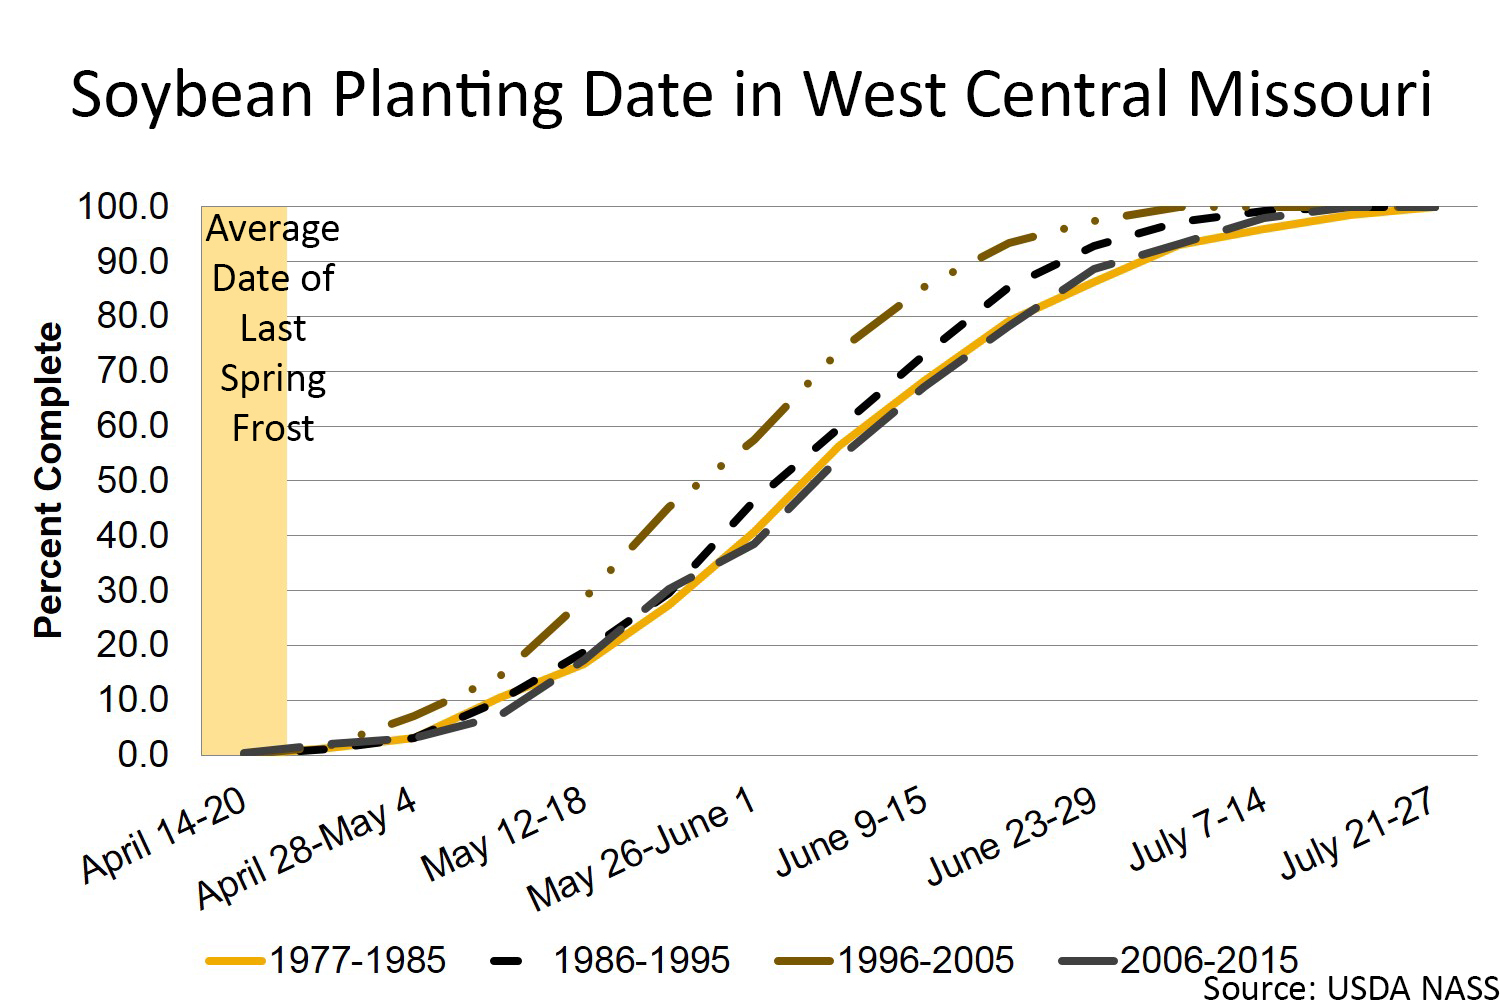
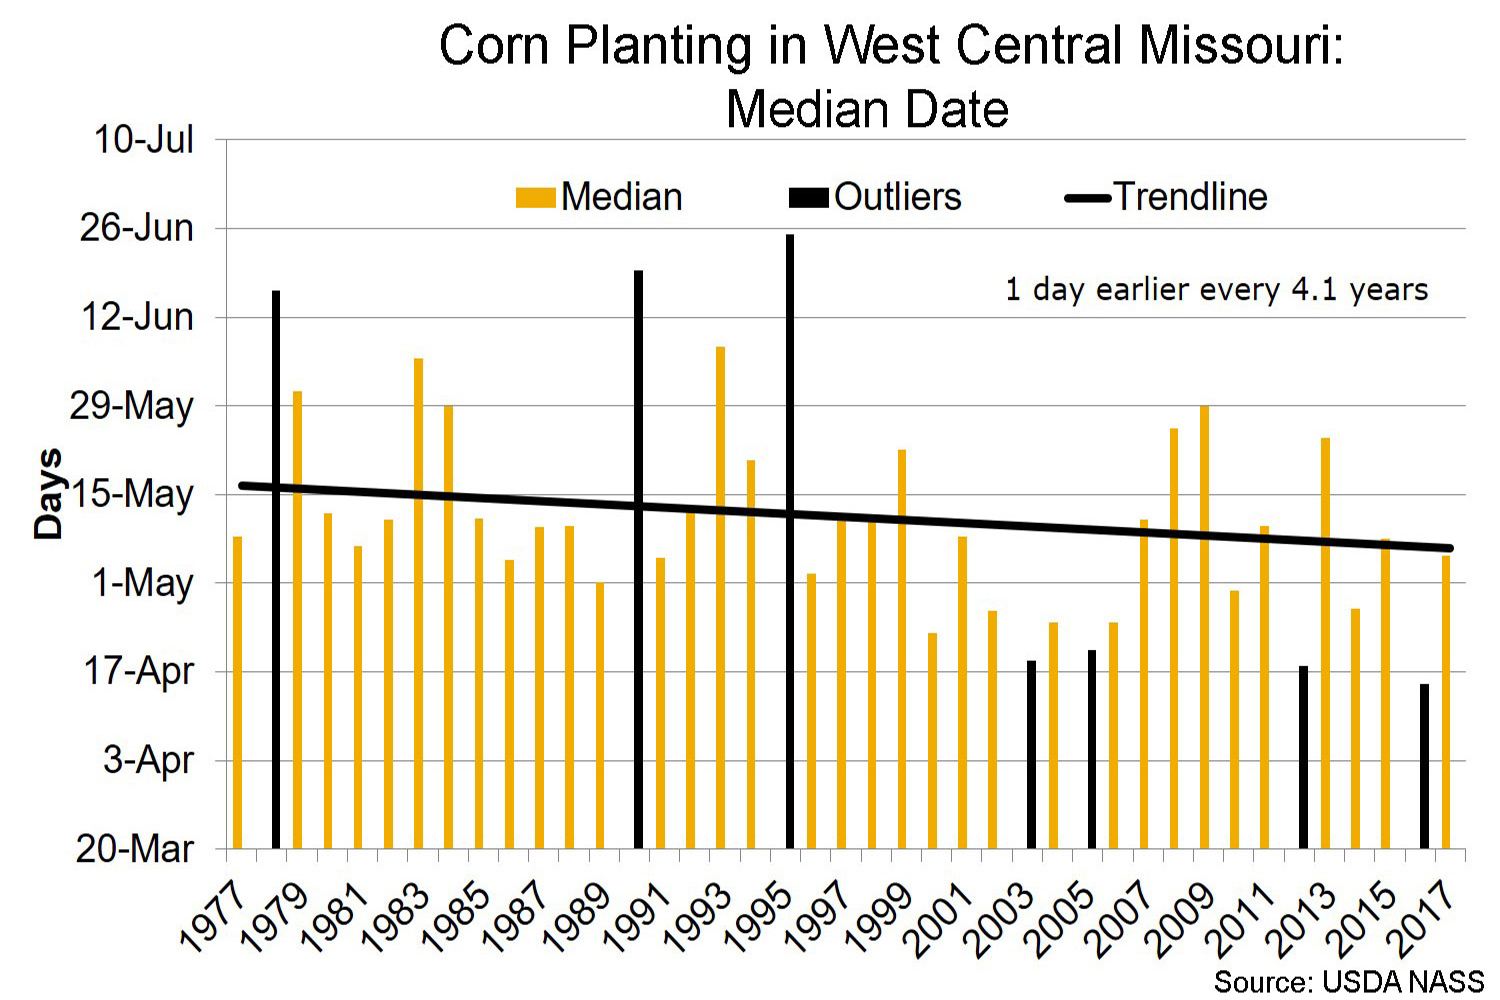
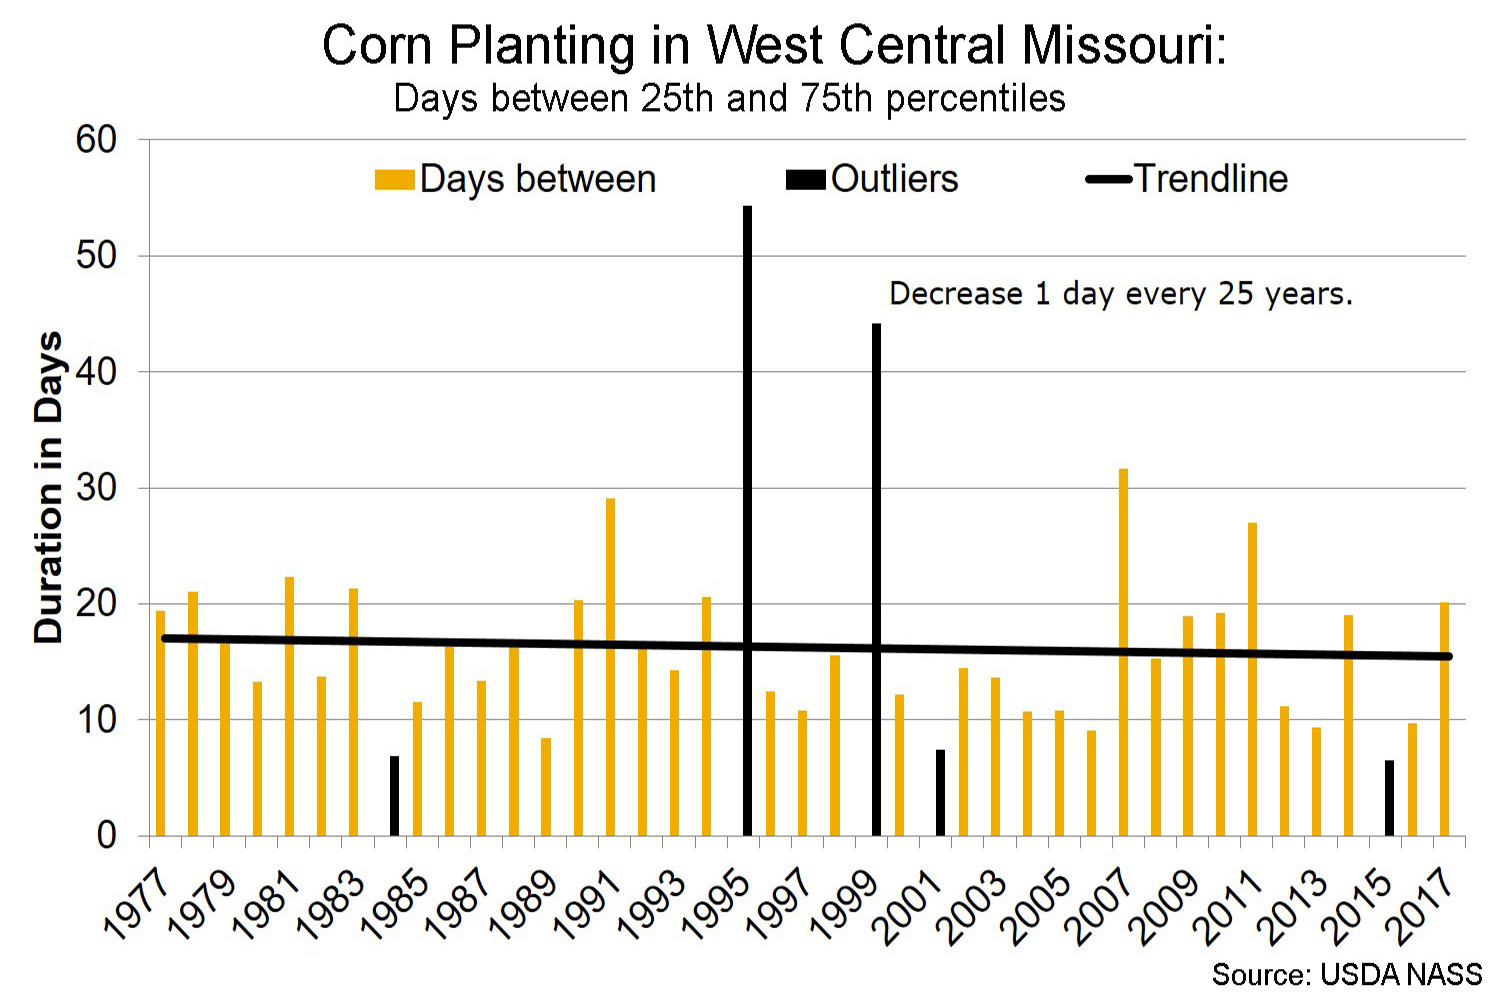
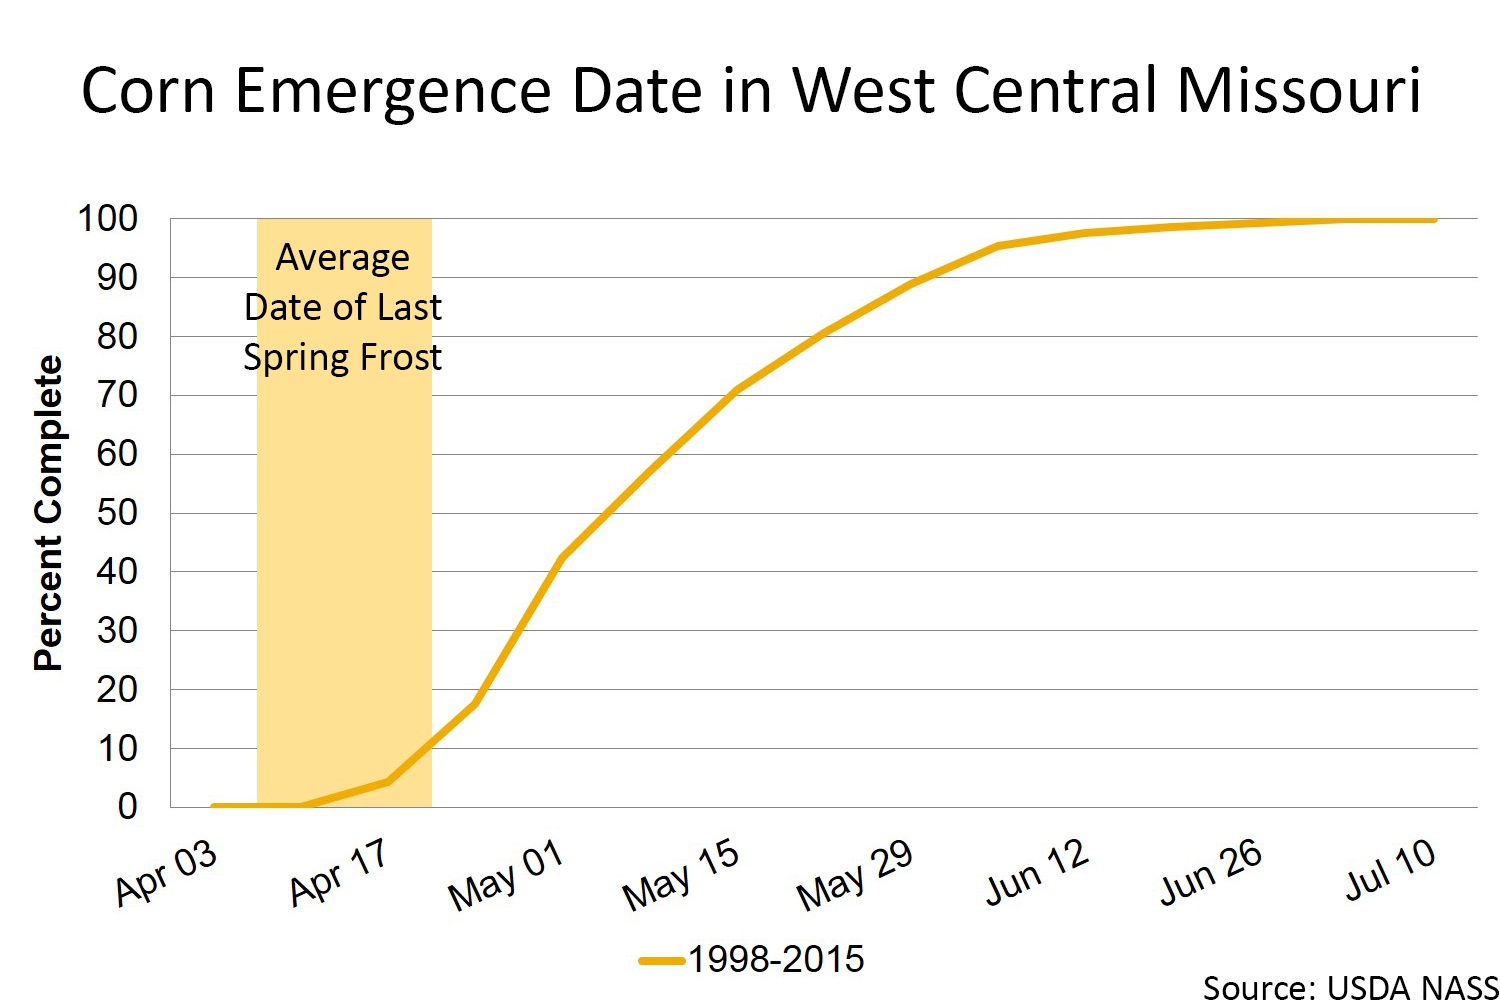
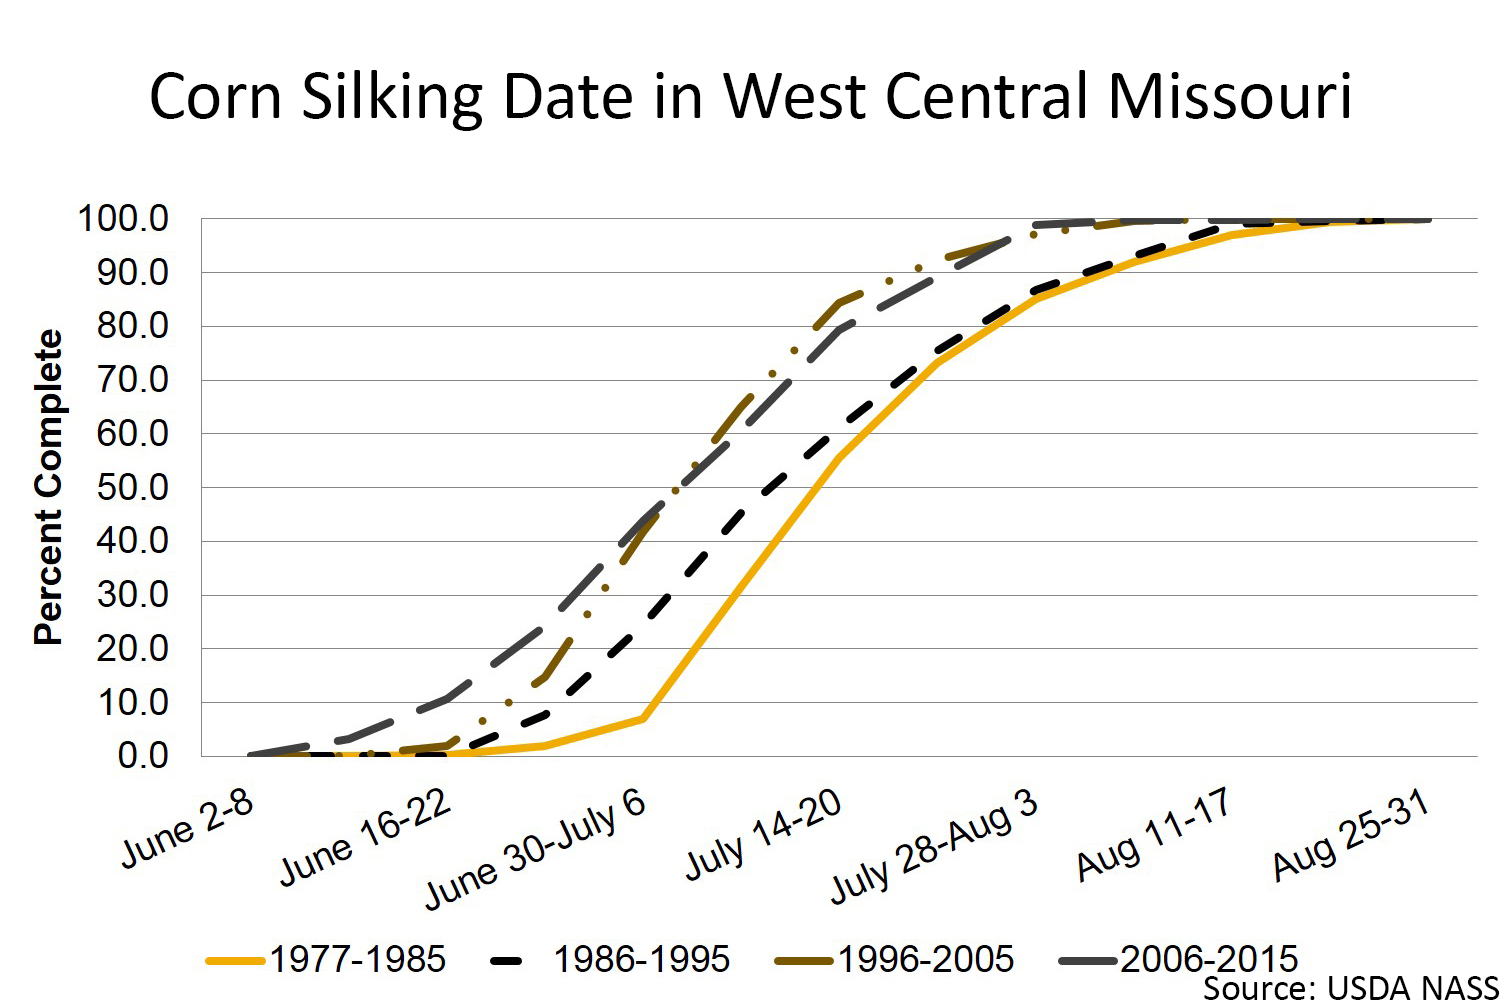
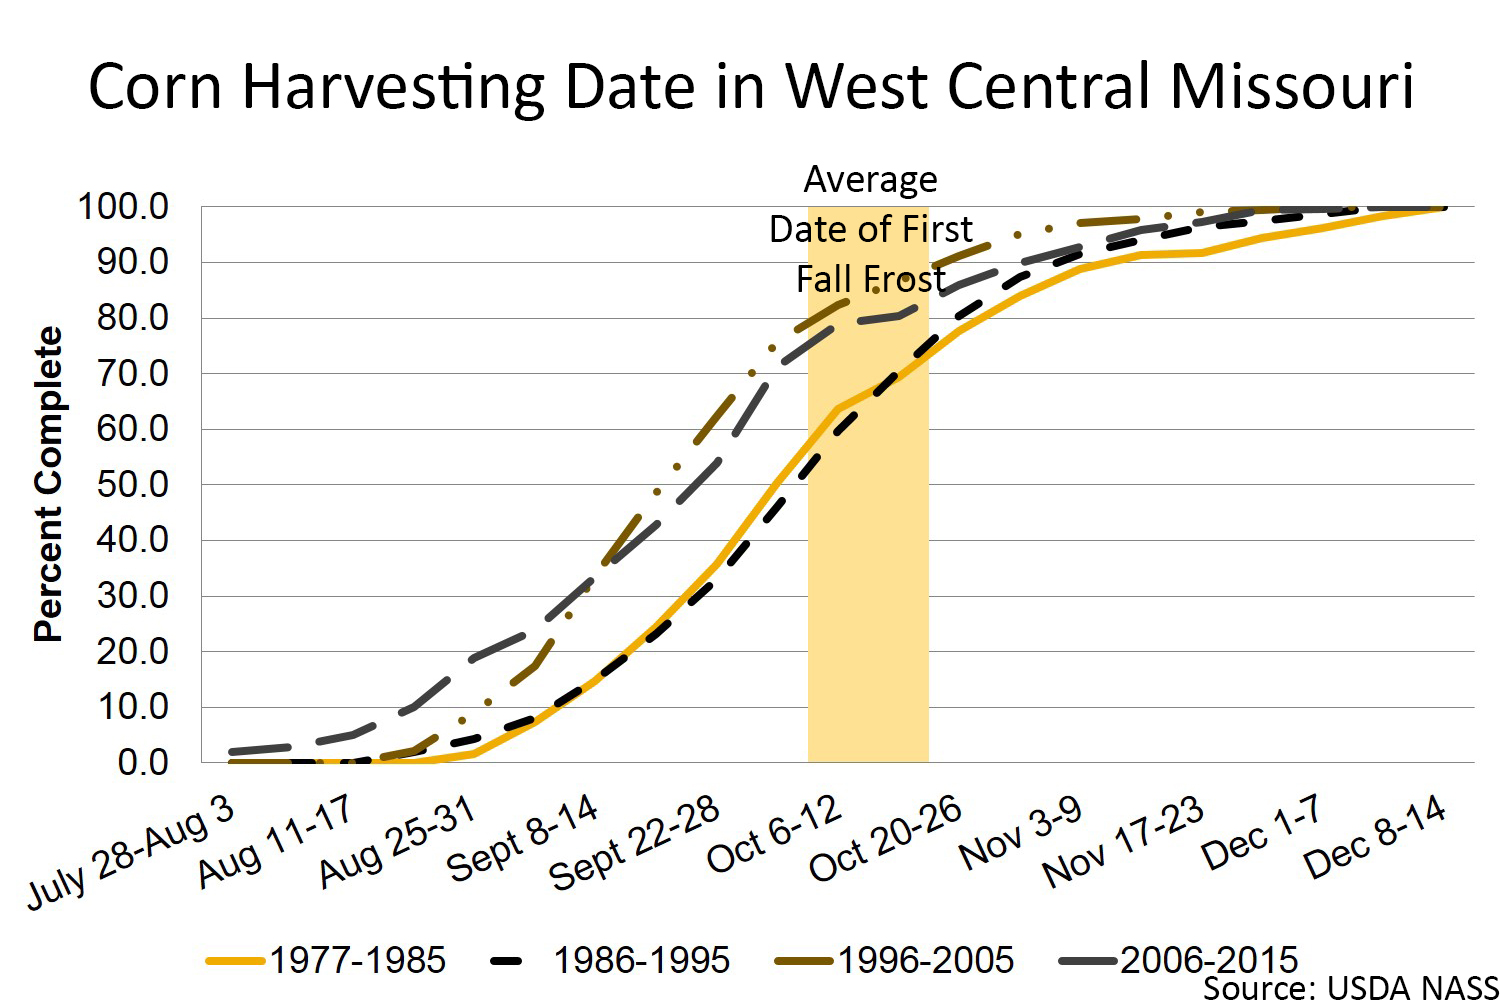
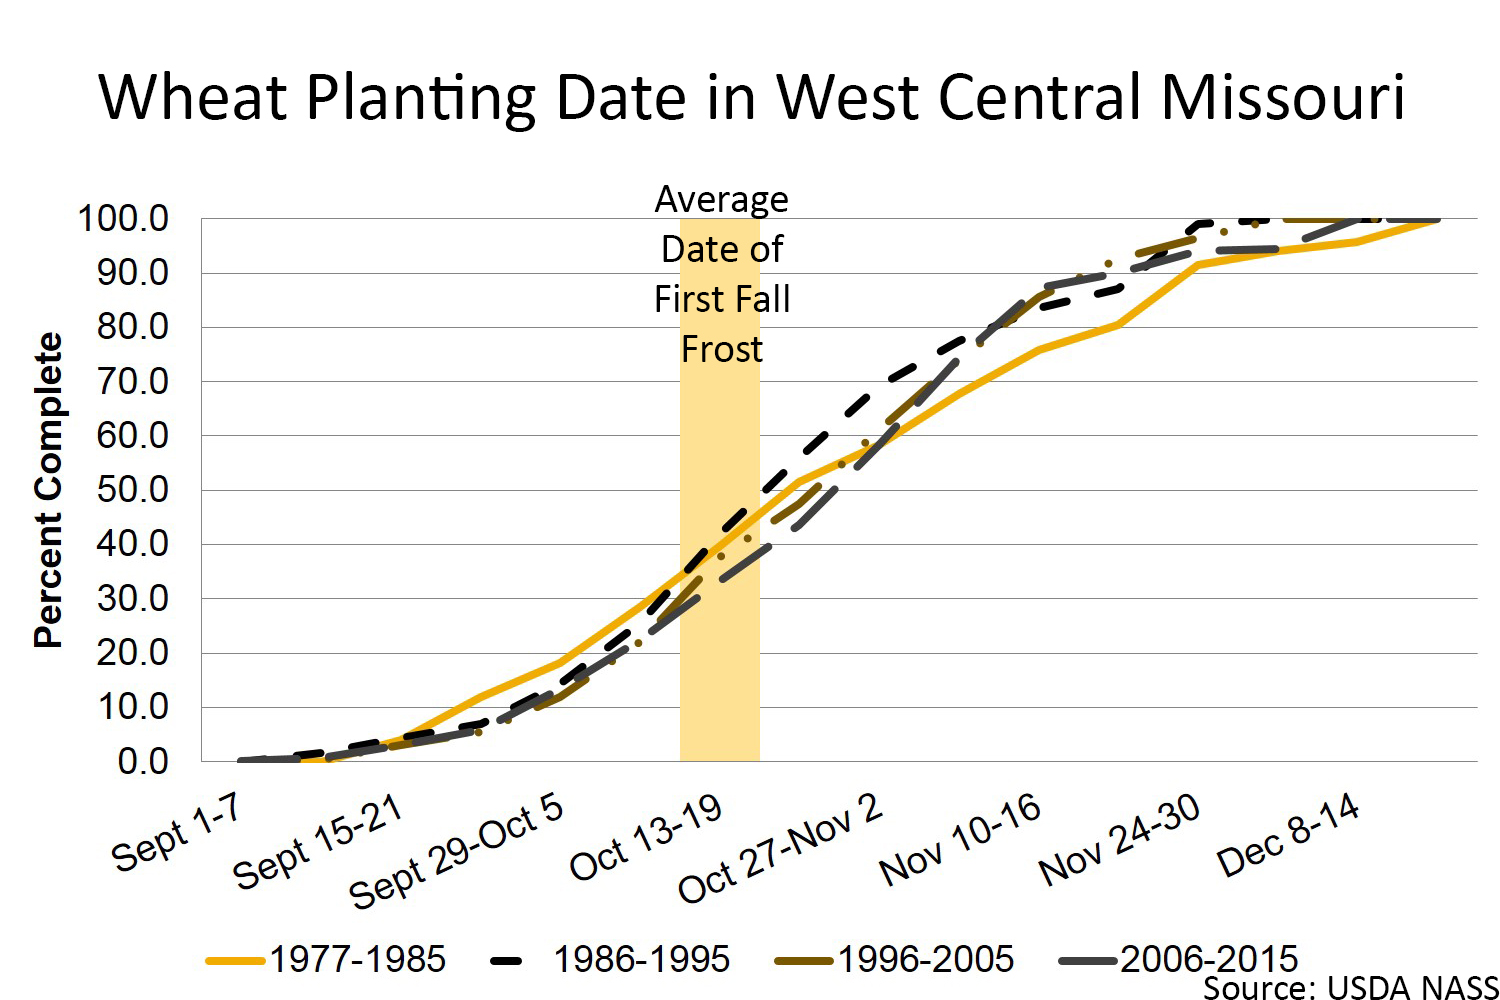
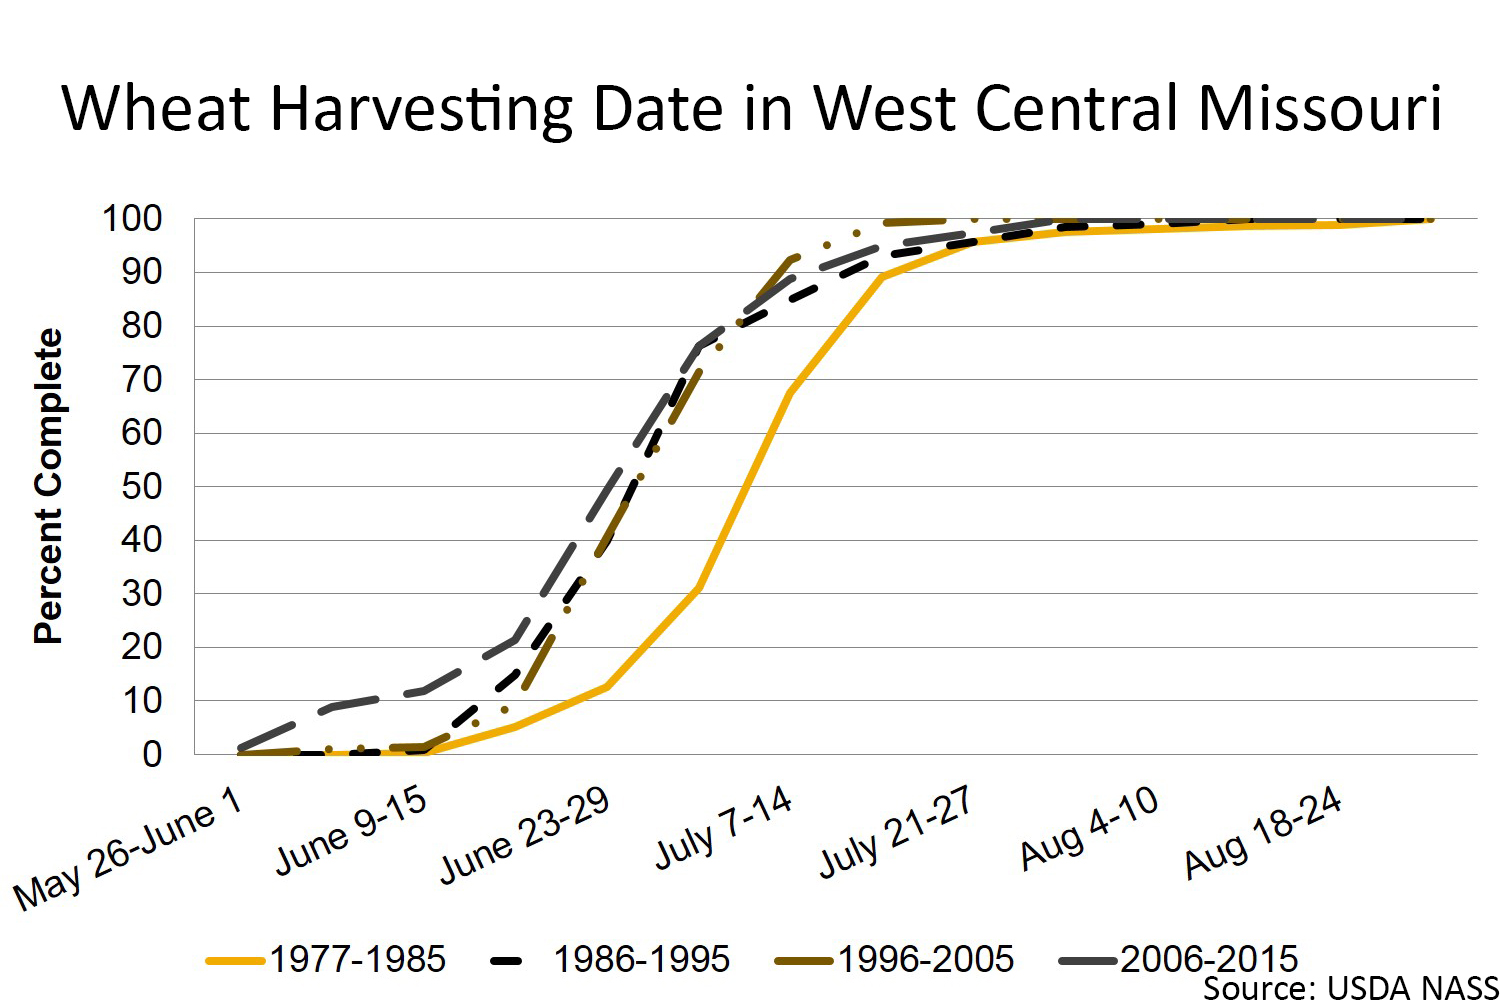
These graphs present the USDA Crop Progress Reports from 1977 to 2015 for the state of Missouri's West Central (WC) district.
West Central Missouri crop calendar
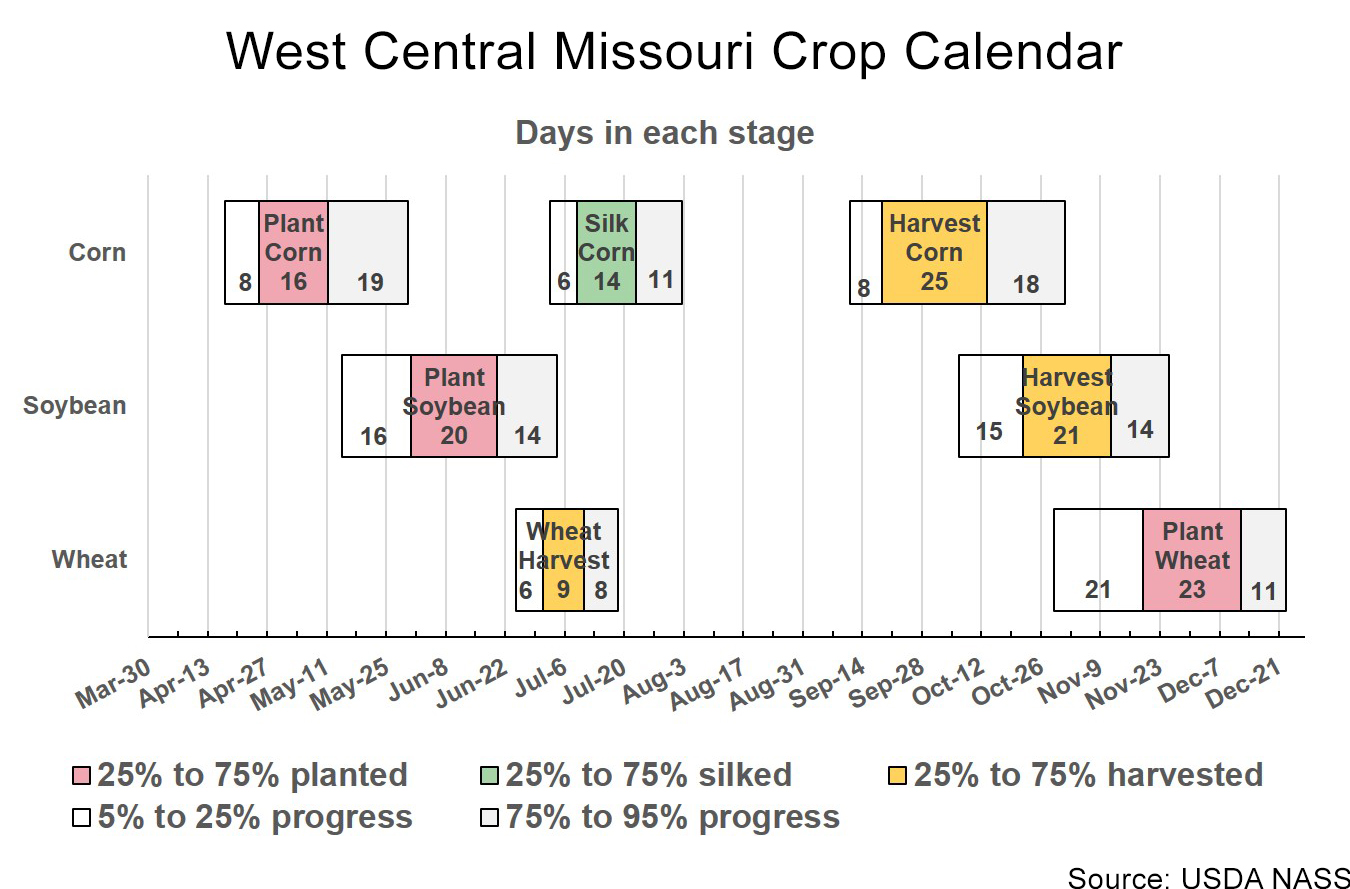
Soybean

Corn

Wheat
West Central field working days
| Week Beginning | 25 percentile | 75 percentile range | Average |
|---|---|---|---|
| 28-Mar | 2.6 | 3.7 | 3.1 |
| 4-Apr | 1.1 | 5.4 | 3.3 |
| 11-Apr | 1.3 | 5.0 | 3.2 |
| 18-Apr | 2.0 | 4.0 | 3.3 |
| 25-Apr | 1.7 | 5.2 | 3.3 |
| 2-May | 1.2 | 4.9 | 2.9 |
| 9-May | 1.2 | 4.7 | 3.2 |
| 16-May | 1.9 | 4.7 | 3.3 |
| 23-May | 1.4 | 4.7 | 3.4 |
| 30-May | 2.1 | 4.6 | 3.4 |
| 6-Jun | 2.1 | 5.3 | 3.9 |
| 13-Jun | 2.5 | 5.8 | 4.0 |
| 20-Jun | 3.1 | 5.9 | 4.5 |
| 27-Jun | 3.6 | 5.9 | 4.6 |
| 4-Jul | 3.9 | 6.3 | 4.9 |
| 11-Jul | 4.2 | 6.1 | 5.0 |
| 18-Jul | 5.0 | 6.7 | 5.7 |
| 25-Jul | 4.8 | 6.6 | 5.4 |
| 1-Aug | 4.1 | 6.6 | 5.2 |
| 8-Aug | 5.2 | 6.6 | 5.6 |
| 15-Aug | 4.9 | 6.5 | 5.4 |
| 22-Aug | 4.8 | 6.4 | 5.4 |
| 29-Aug | 4.4 | 6.6 | 5.3 |
| 5-Sep | 4.8 | 6.5 | 5.5 |
| 12-Sep | 4.2 | 6.3 | 5.1 |
| 19-Sep | 4.1 | 6.1 | 4.9 |
| 26-Sep | 4.3 | 6.4 | 5.2 |
| 3-Oct | 4.0 | 6.3 | 5.0 |
| 10-Oct | 3.8 | 6.2 | 4.9 |
| 17-Oct | 3.7 | 6.1 | 4.7 |
| 24-Oct | 2.9 | 6.1 | 4.6 |
| 31-Oct | 3.0 | 5.8 | 4.2 |
| 7-Nov | 2.8 | 6.1 | 4.3 |
| 14-Nov | 2.8 | 5.4 | 4.0 |
| 21-Nov | 1.9 | 5.4 | 3.3 |
| 28-Nov | 1.9 | 3.6 | 2.9 |
| 5-Dec | 0.8 | 2.0 | 2.1 |
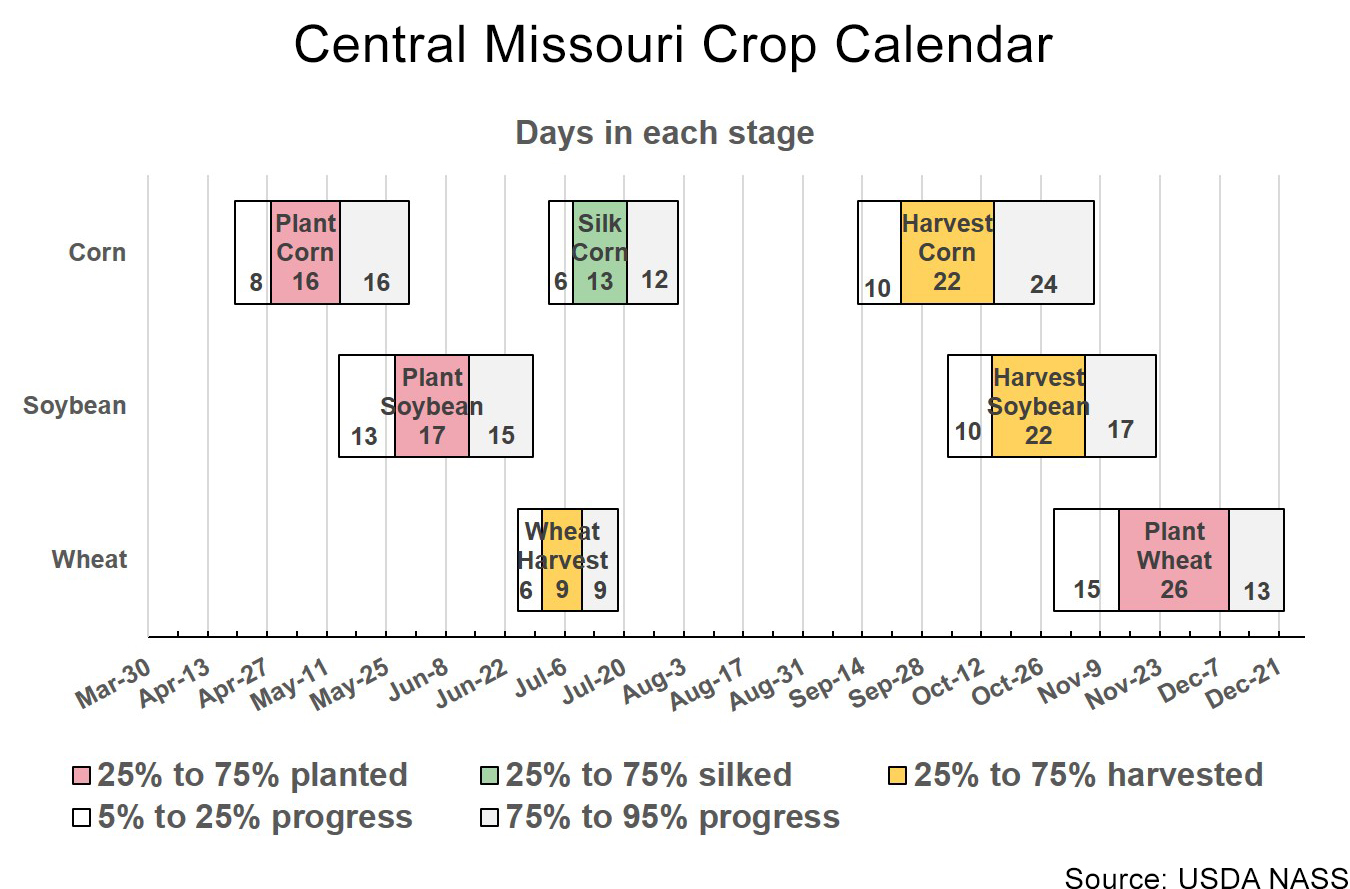
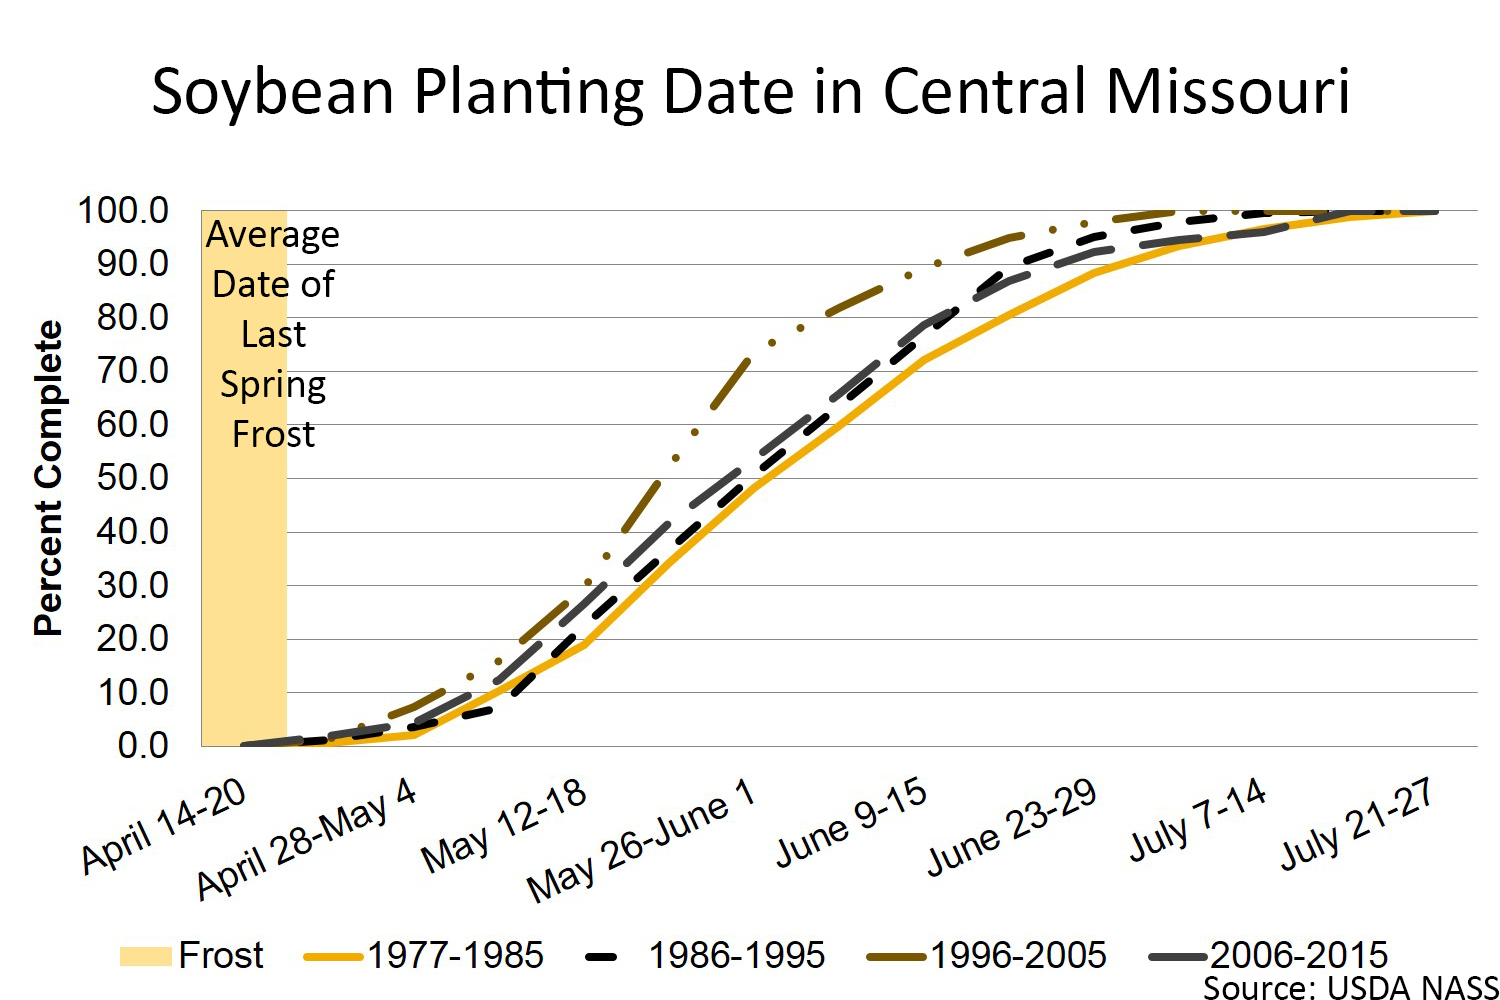
These graphs present the USDA Crop Progress Reports from 1977 to 2015 for the state of Missouri's Central (C) district.
Central Missouri crop calendar
Soybean
Corn
Wheat
Central field working days
| Week Beginning | 25 percentile | 75 percentile range | Average |
|---|---|---|---|
| 28-Mar | 1.6 | 4.3 | 2.9 |
| 4-Apr | 1.5 | 5.3 | 3.3 |
| 11-Apr | 1.3 | 5.1 | 3.4 |
| 18-Apr | 1.7 | 4.8 | 3.3 |
| 25-Apr | 1.7 | 4.7 | 3.3 |
| 2-May | 1.6 | 5.0 | 3.2 |
| 9-May | 2.2 | 4.9 | 3.6 |
| 16-May | 1.7 | 5.4 | 3.5 |
| 23-May | 2.4 | 5.1 | 3.7 |
| 30-May | 2.9 | 5.4 | 4.0 |
| 6-Jun | 2.9 | 5.5 | 4.2 |
| 13-Jun | 2.7 | 5.9 | 4.1 |
| 20-Jun | 3.3 | 6.2 | 4.8 |
| 27-Jun | 4.1 | 5.9 | 4.9 |
| 4-Jul | 4.4 | 6.5 | 5.2 |
| 11-Jul | 4.4 | 6.2 | 5.1 |
| 18-Jul | 4.9 | 6.6 | 5.7 |
| 25-Jul | 4.8 | 6.4 | 5.4 |
| 1-Aug | 4.4 | 6.6 | 5.3 |
| 8-Aug | 4.9 | 6.6 | 5.7 |
| 15-Aug | 4.6 | 6.3 | 5.4 |
| 22-Aug | 4.9 | 6.4 | 5.4 |
| 29-Aug | 4.7 | 6.6 | 5.5 |
| 5-Sep | 4.8 | 6.3 | 5.5 |
| 12-Sep | 4.6 | 6.5 | 5.3 |
| 19-Sep | 4.7 | 6.2 | 5.2 |
| 26-Sep | 3.8 | 6.6 | 5.3 |
| 3-Oct | 4.7 | 6.4 | 5.2 |
| 10-Oct | 3.7 | 6.2 | 4.9 |
| 17-Oct | 4.1 | 6.2 | 4.9 |
| 24-Oct | 3.9 | 6.2 | 4.8 |
| 31-Oct | 3.2 | 5.6 | 4.4 |
| 7-Nov | 2.9 | 6.2 | 4.5 |
| 14-Nov | 3.0 | 5.6 | 4.2 |
| 21-Nov | 1.7 | 4.8 | 3.4 |
| 28-Nov | 1.8 | 3.4 | 2.5 |
| 5-Dec | 0.9 | 2.3 | 2.1 |
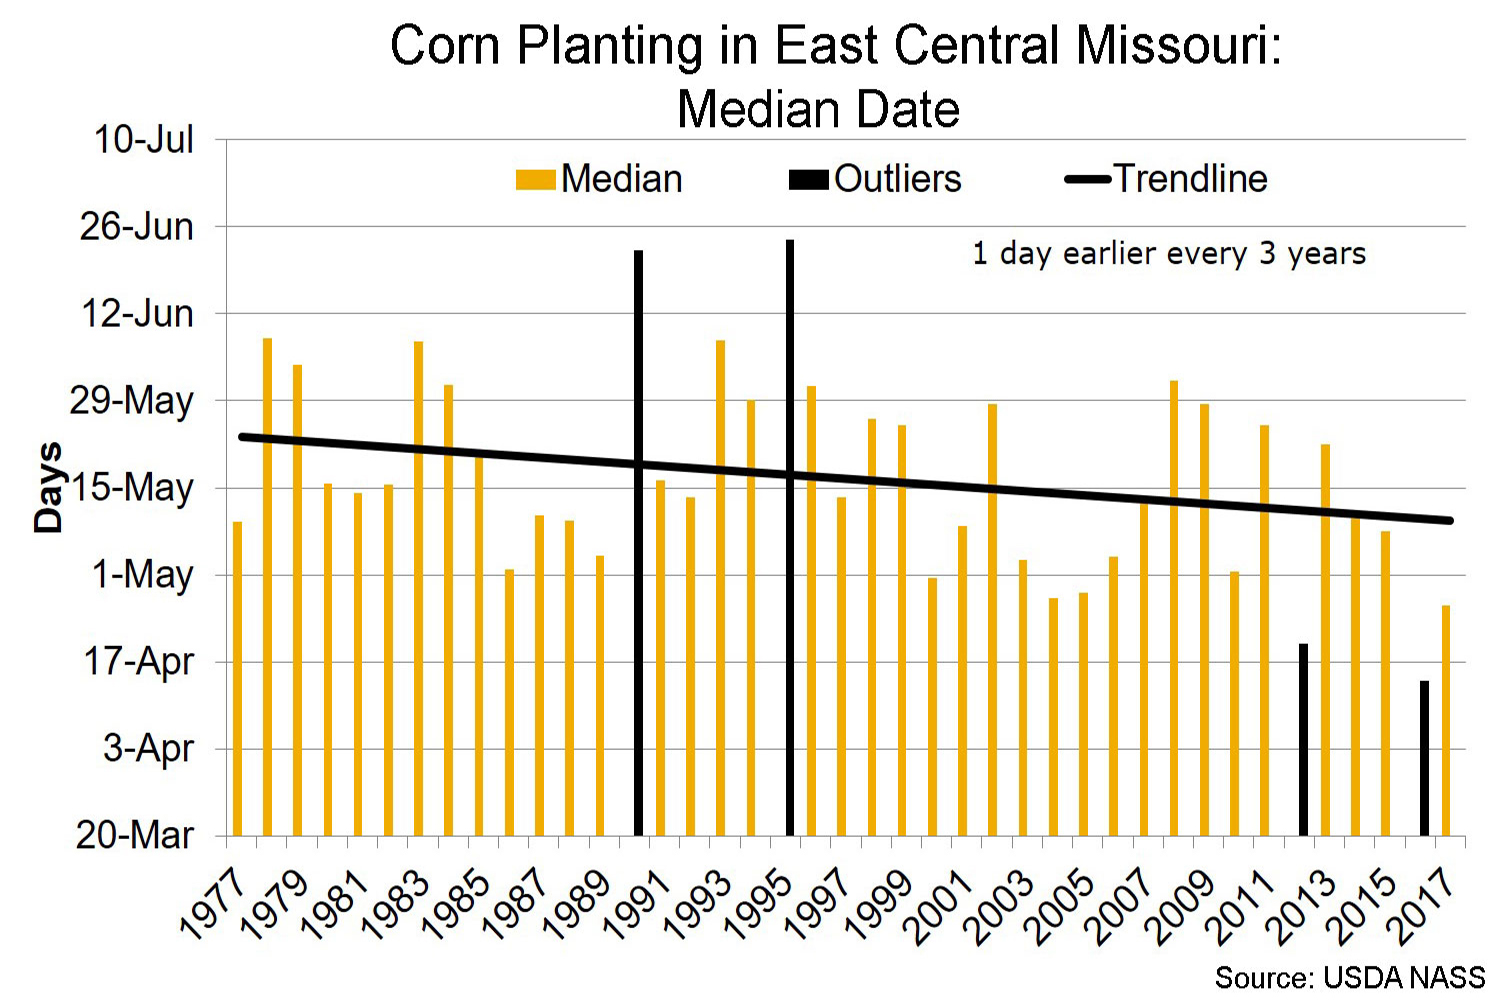
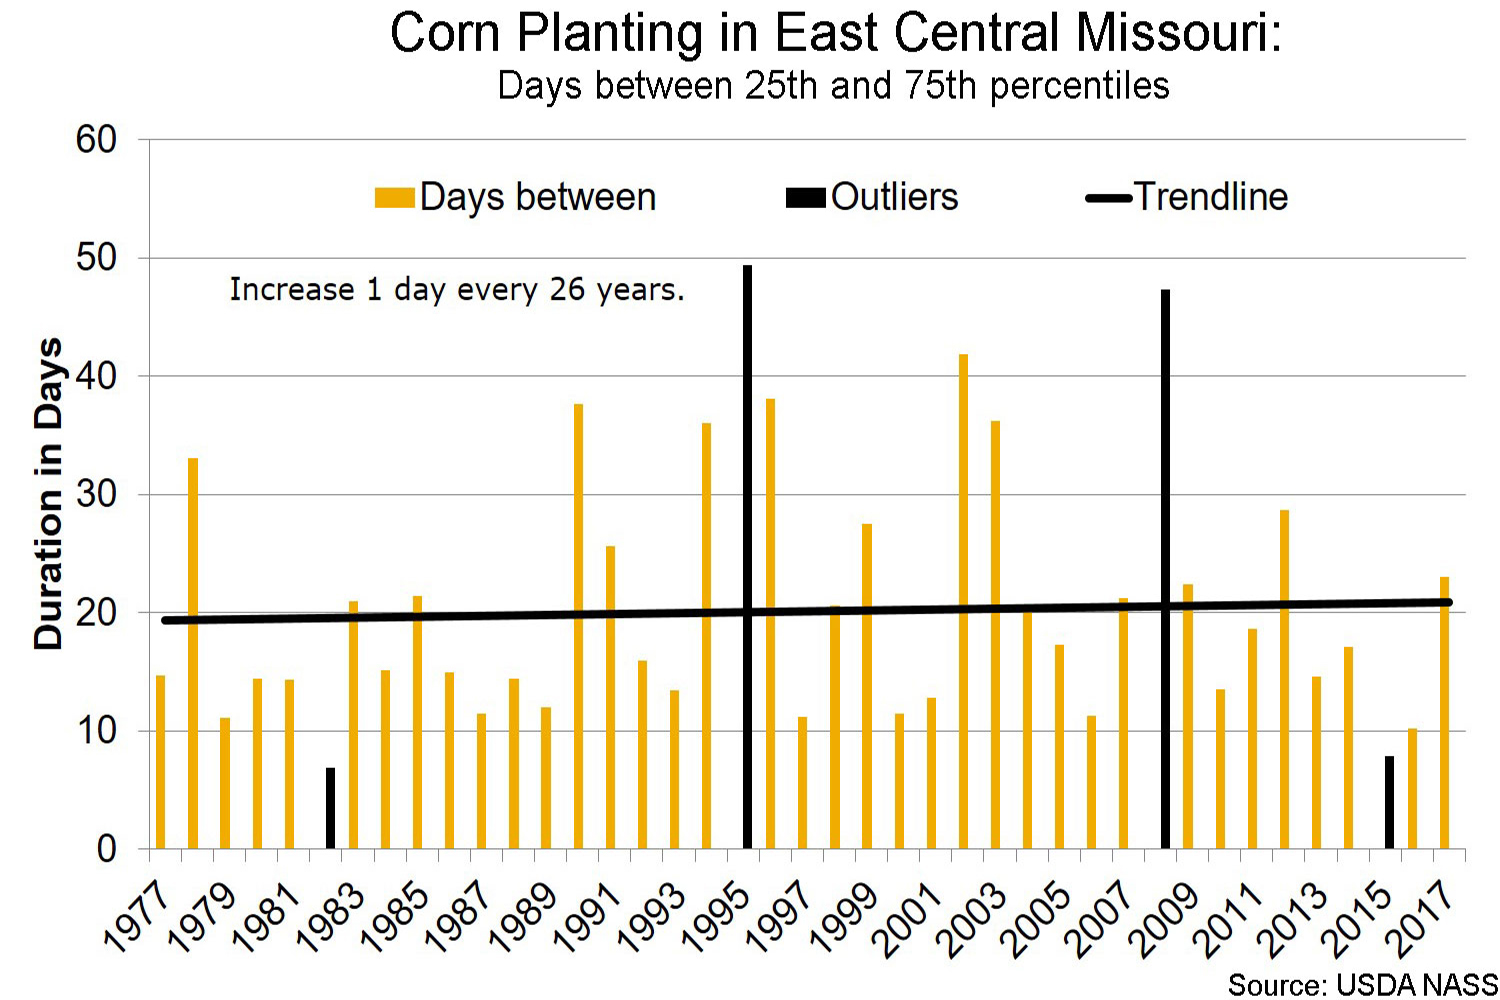
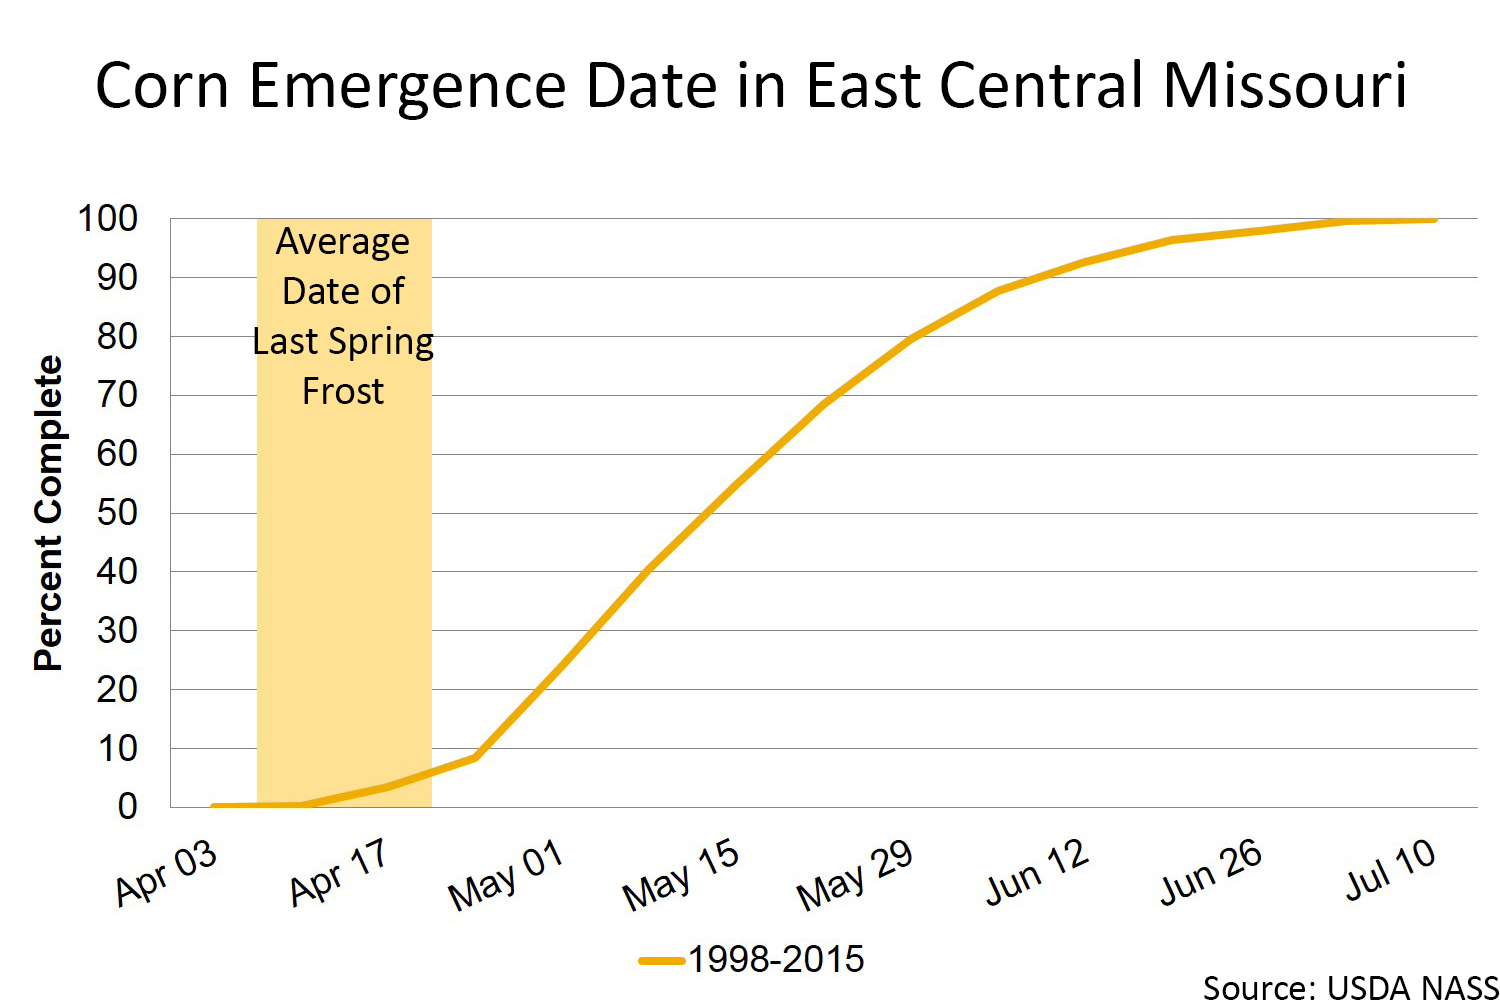
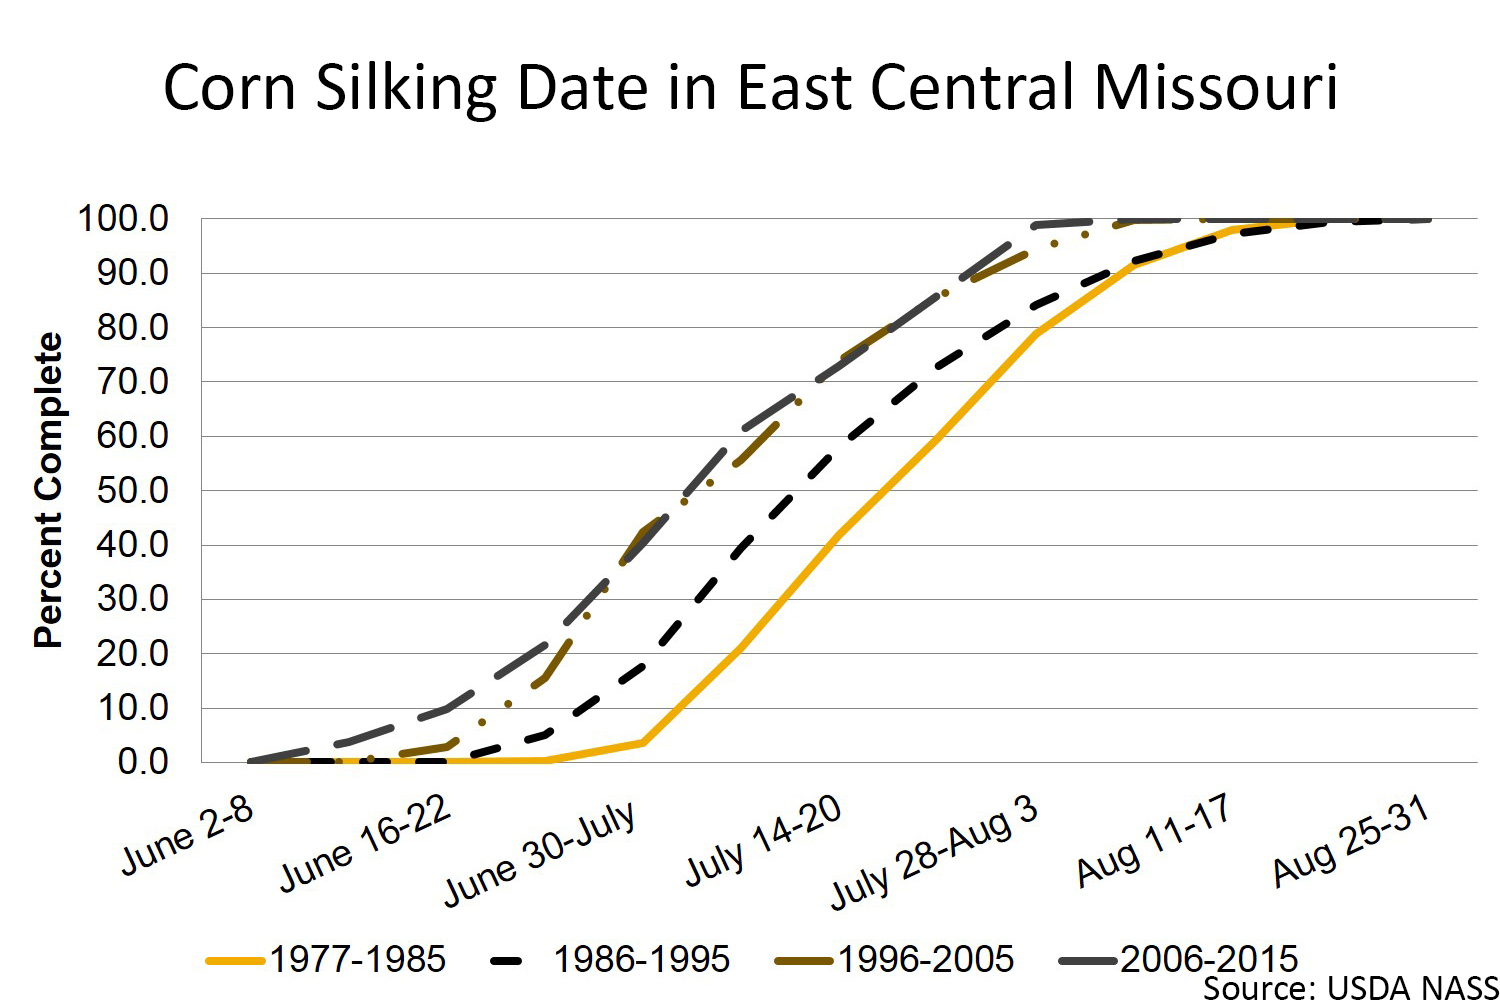
These graphs present the USDA Crop Progress Reports from 1977 to 2015 for the state of Missouri's East Central (EC) district.
East Central Missouri crop calendar

Soybean
Corn
Wheat

East Central field working days
| Week Beginning | 25 percentile | 75 percentile range | Average |
|---|---|---|---|
| 28-Mar | 1.3 | 3.7 | 2.5 |
| 4-Apr | 1.5 | 4.5 | 2.9 |
| 11-Apr | 2.1 | 4.8 | 3.3 |
| 18-Apr | 1.7 | 4.6 | 3.3 |
| 25-Apr | 2.3 | 4.4 | 3.3 |
| 2-May | 1.9 | 4.9 | 3.3 |
| 9-May | 1.9 | 5.0 | 3.5 |
| 16-May | 1.9 | 5.4 | 3.6 |
| 23-May | 3.1 | 5.3 | 3.9 |
| 30-May | 3.0 | 5.1 | 4.0 |
| 6-Jun | 3.0 | 5.6 | 4.4 |
| 13-Jun | 2.9 | 5.9 | 4.2 |
| 20-Jun | 3.6 | 6.0 | 4.8 |
| 27-Jun | 4.3 | 6.3 | 5.1 |
| 4-Jul | 4.4 | 6.0 | 5.1 |
| 11-Jul | 4.5 | 5.9 | 5.1 |
| 18-Jul | 5.0 | 6.3 | 5.5 |
| 25-Jul | 4.3 | 6.4 | 5.2 |
| 1-Aug | 4.3 | 6.1 | 5.2 |
| 8-Aug | 5.0 | 6.1 | 5.5 |
| 15-Aug | 4.9 | 6.4 | 5.5 |
| 22-Aug | 5.0 | 6.4 | 5.5 |
| 29-Aug | 5.0 | 6.5 | 5.5 |
| 5-Sep | 4.8 | 6.4 | 5.5 |
| 12-Sep | 4.8 | 6.5 | 5.4 |
| 19-Sep | 4.6 | 6.1 | 5.2 |
| 26-Sep | 4.1 | 6.5 | 5.1 |
| 3-Oct | 5.0 | 6.2 | 5.3 |
| 10-Oct | 3.9 | 6.2 | 5.0 |
| 17-Oct | 4.3 | 5.9 | 4.8 |
| 24-Oct | 4.0 | 5.6 | 4.6 |
| 31-Oct | 3.9 | 5.5 | 4.3 |
| 7-Nov | 2.6 | 5.8 | 4.3 |
| 14-Nov | 2.8 | 5.1 | 3.9 |
| 21-Nov | 1.8 | 4.4 | 3.1 |
| 28-Nov | 0.8 | 2.5 | 1.8 |
| 5-Dec | 1.0 | 3.0 | 2.3 |
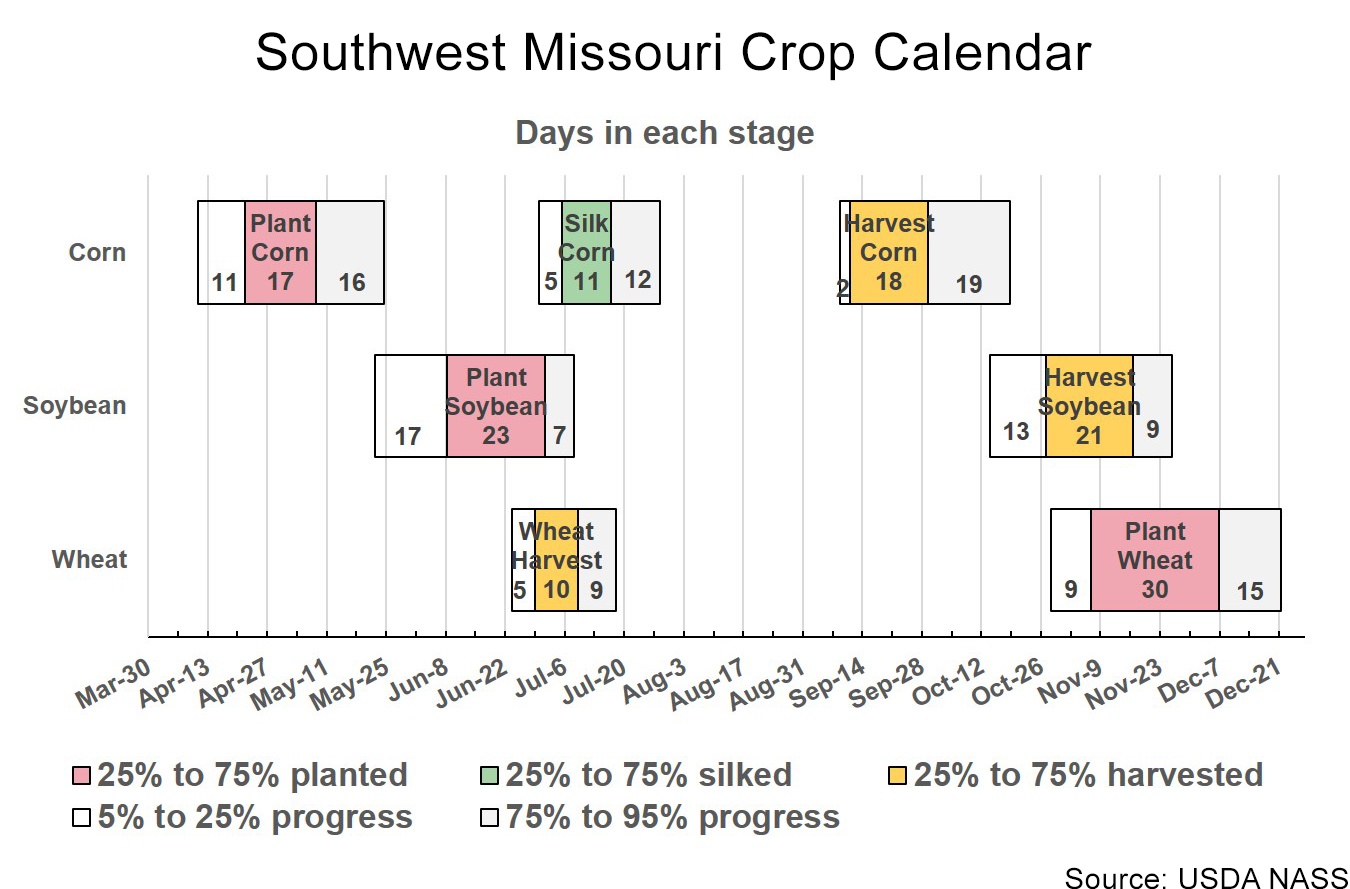
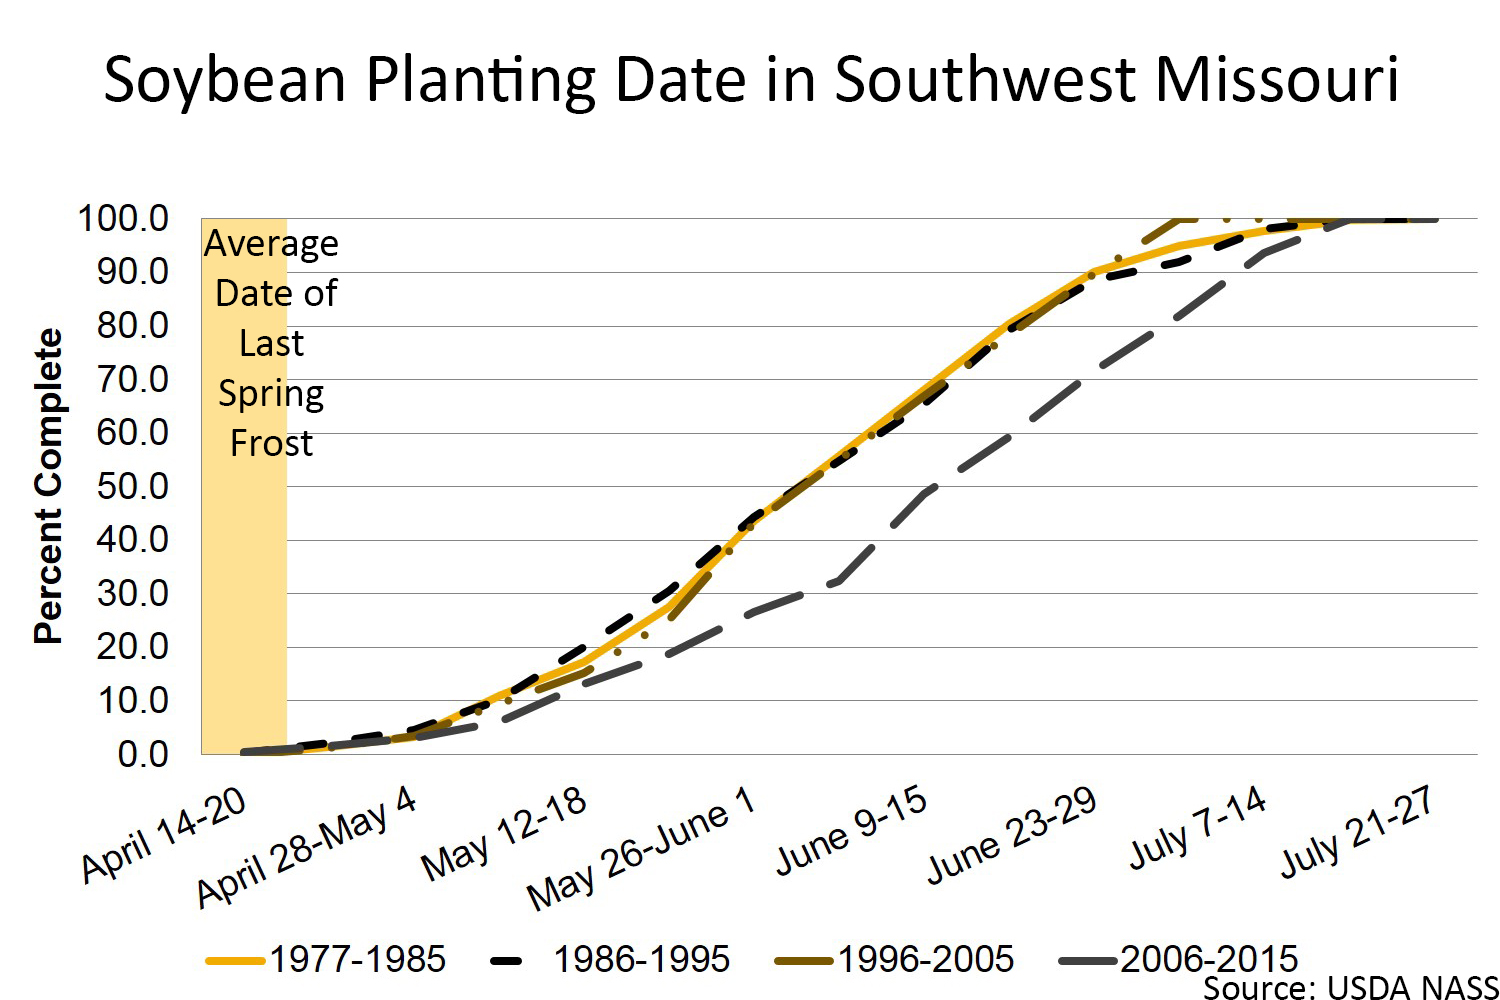
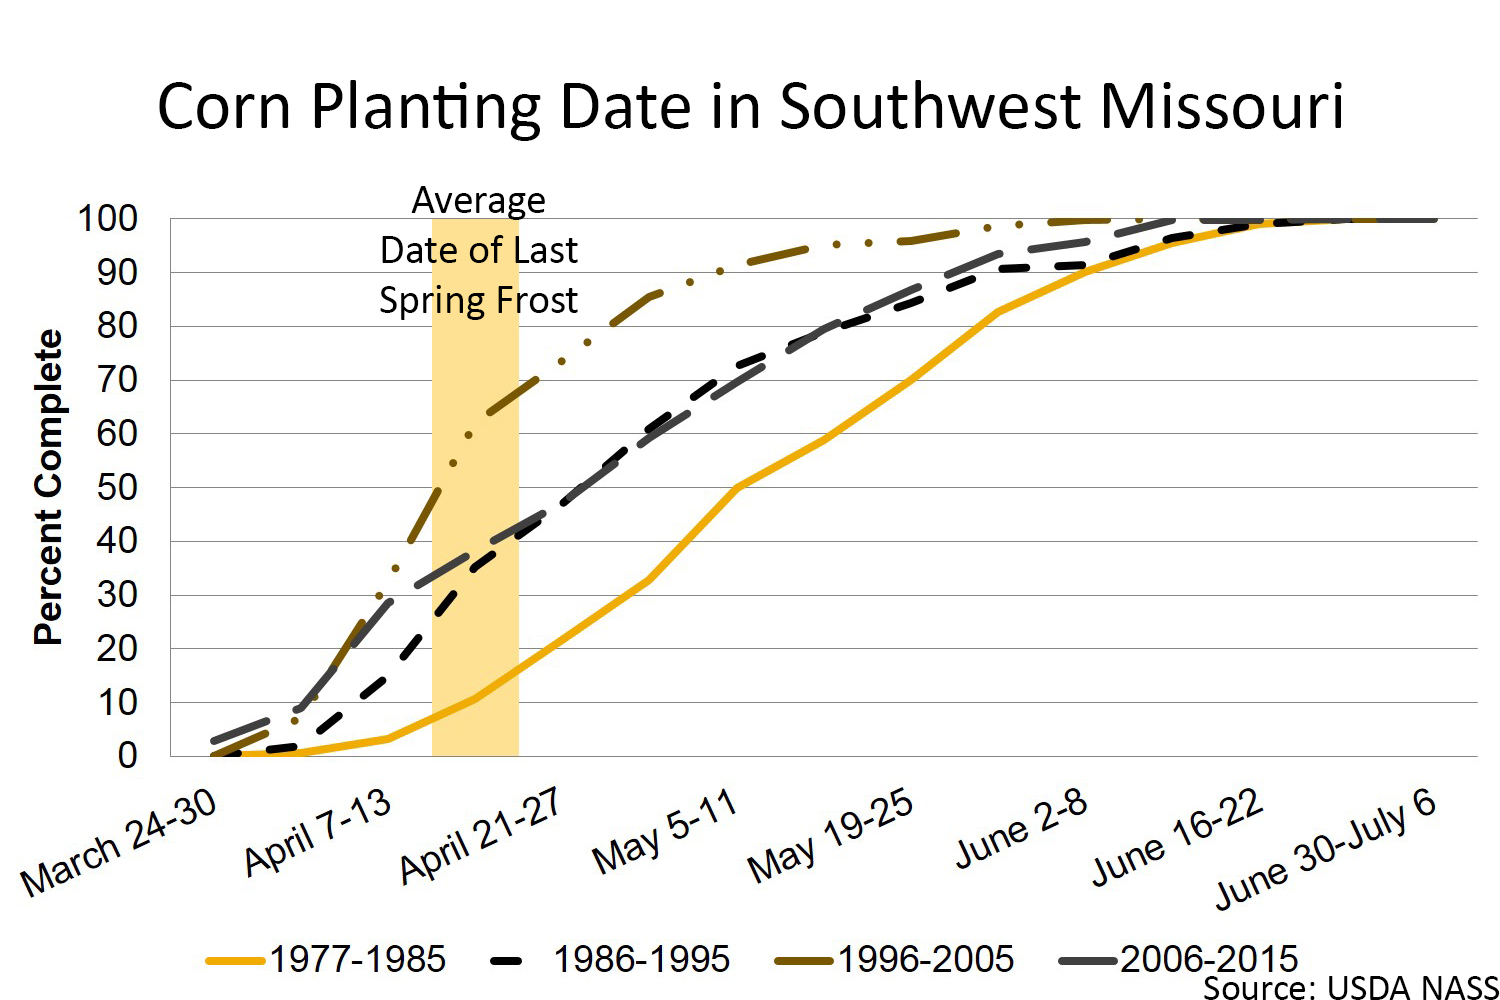
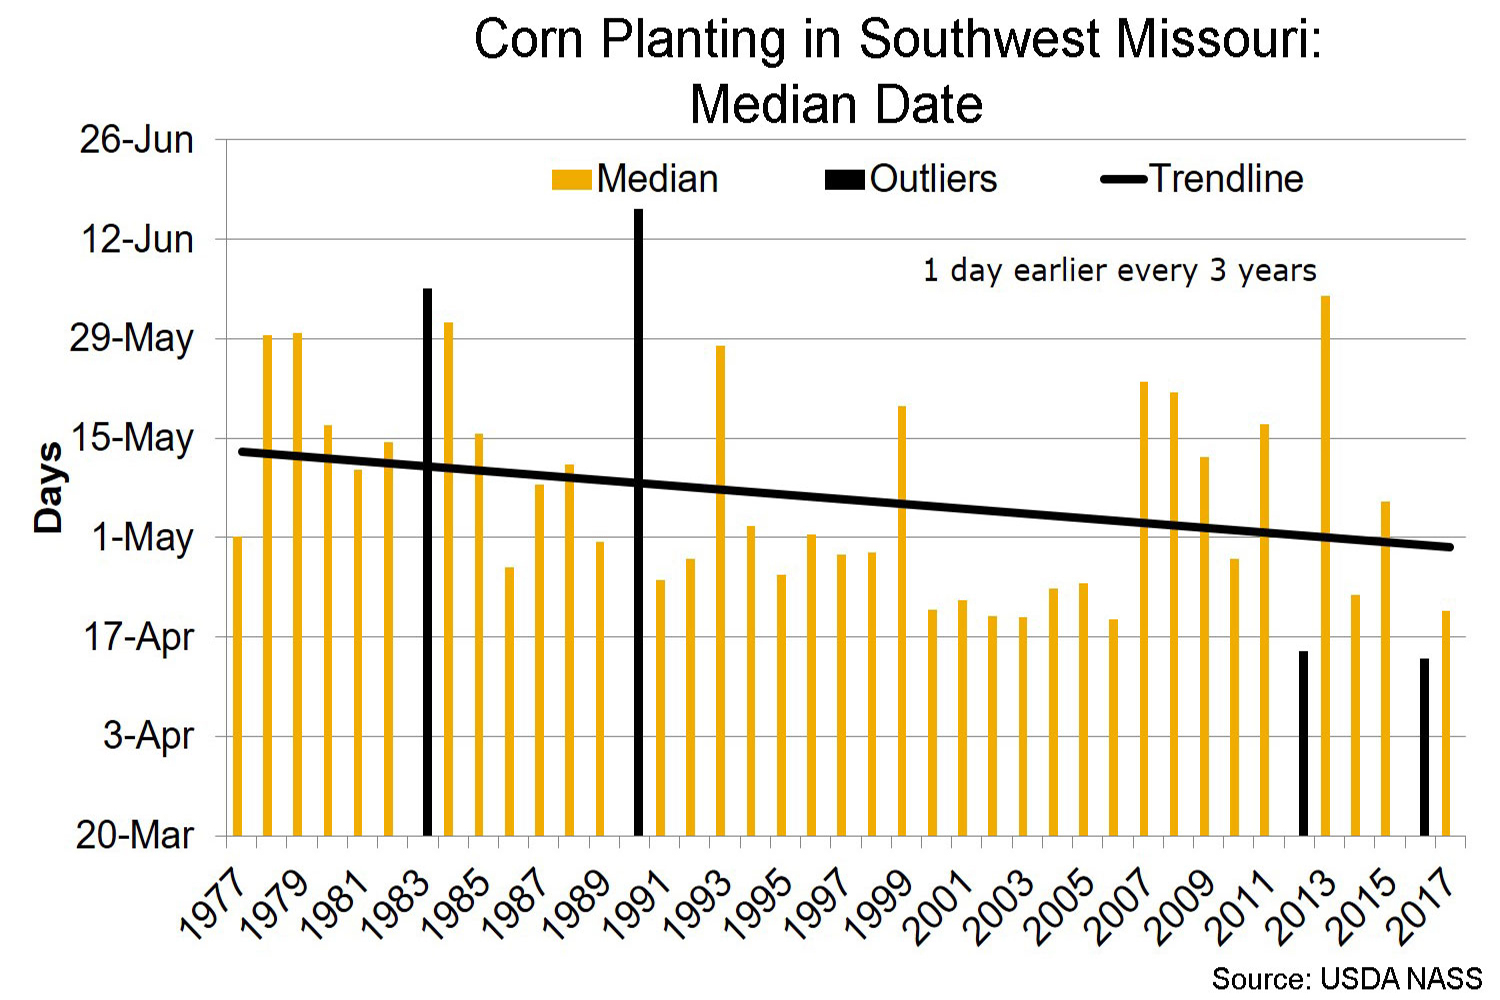
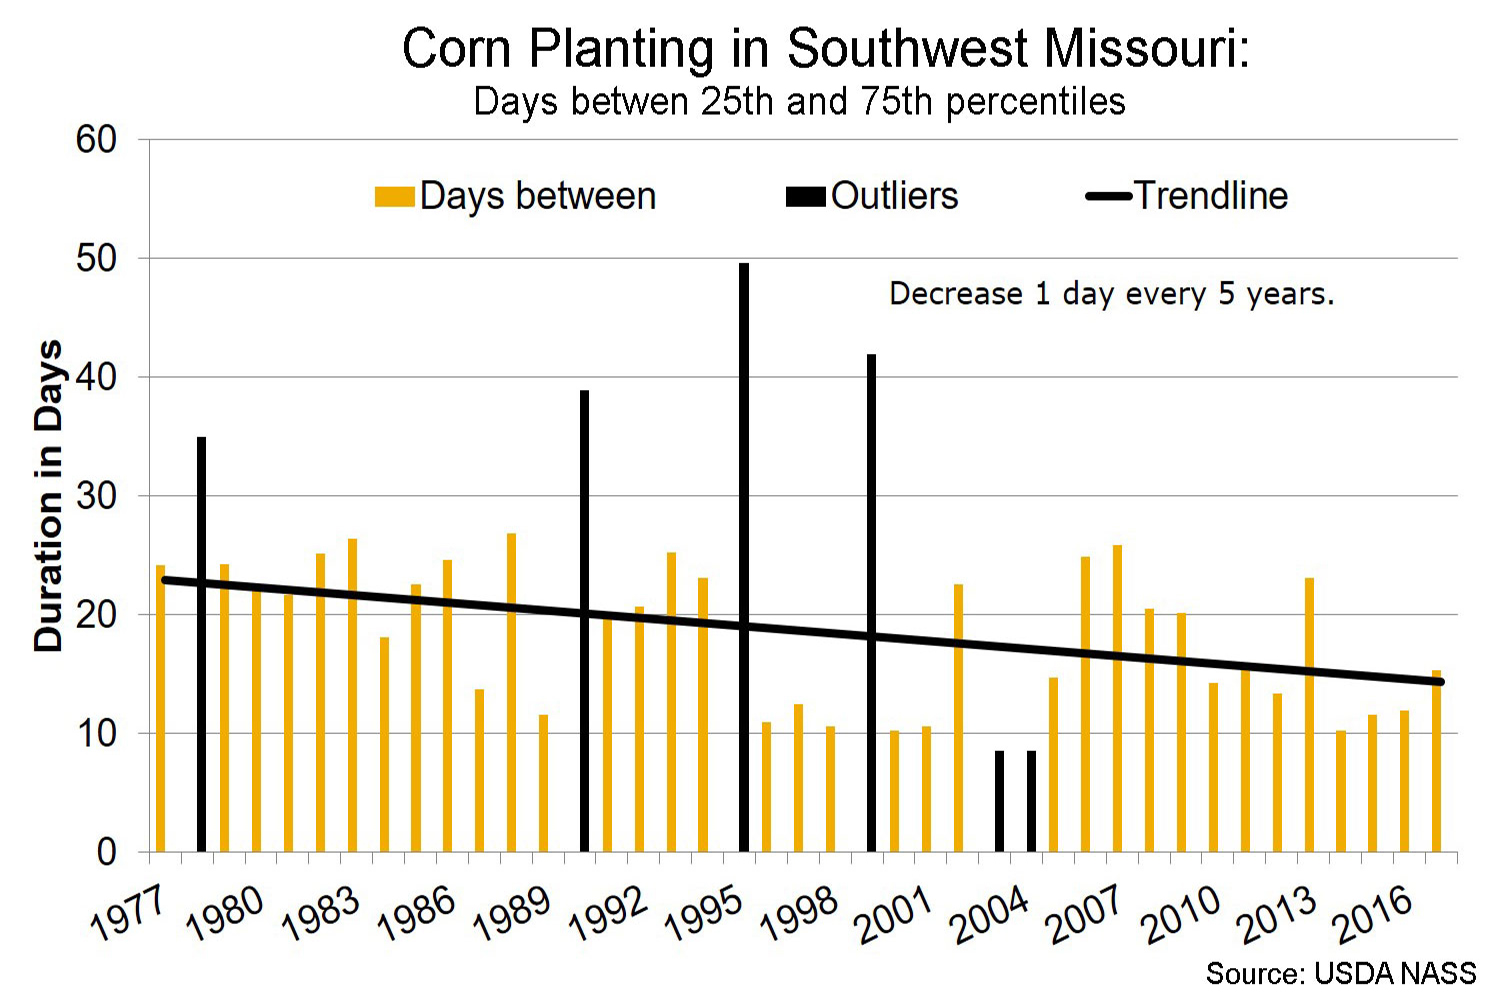
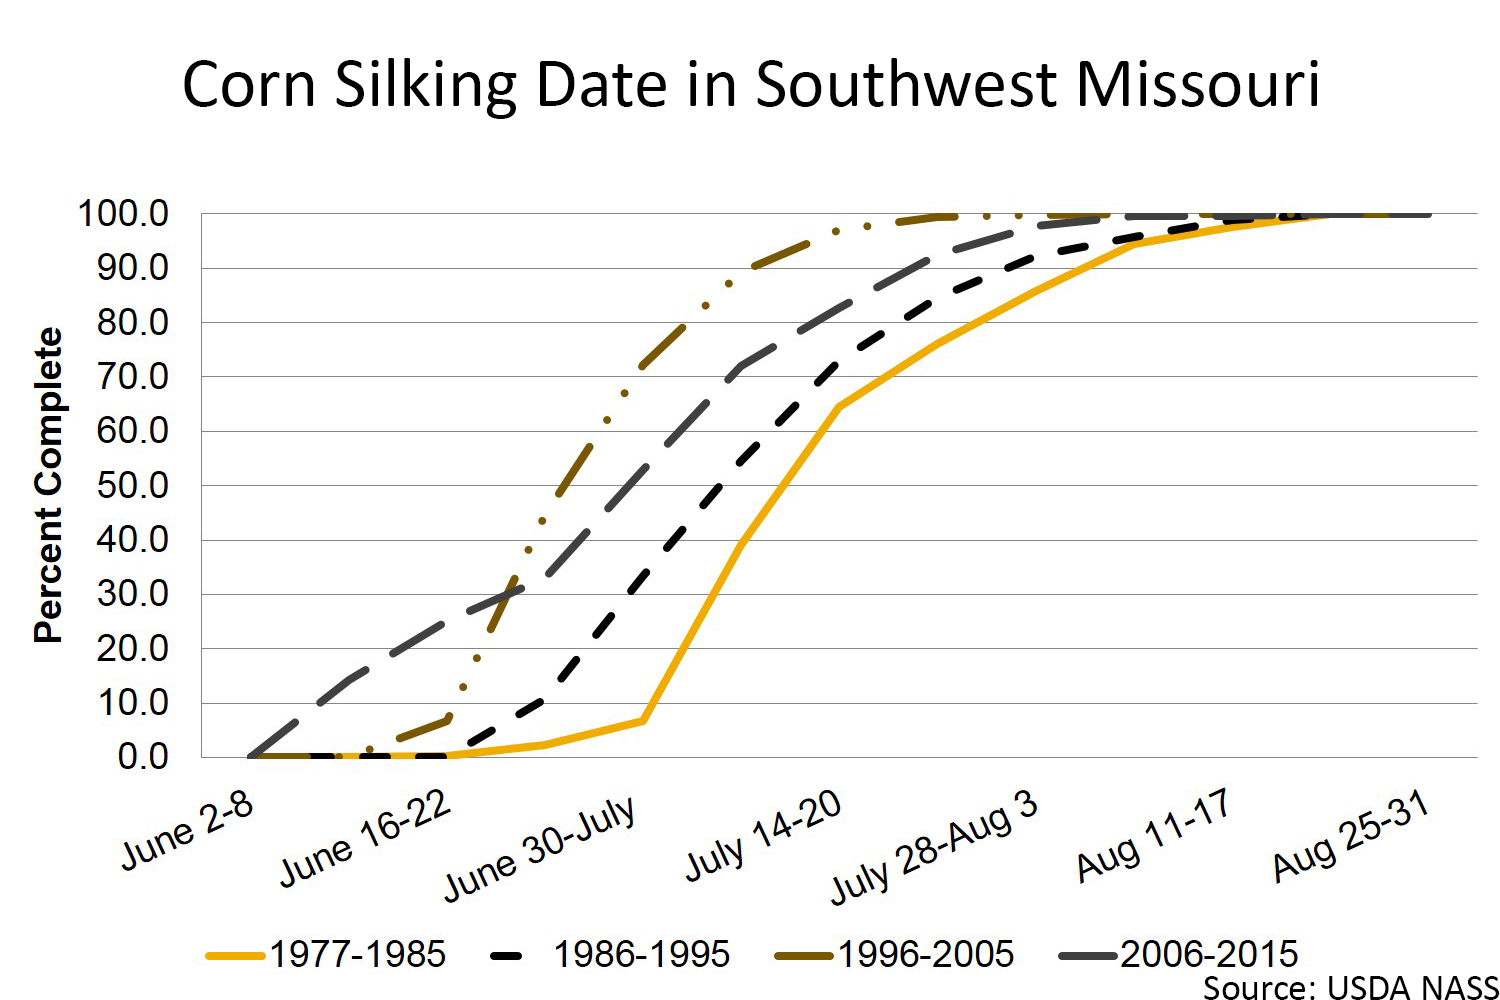
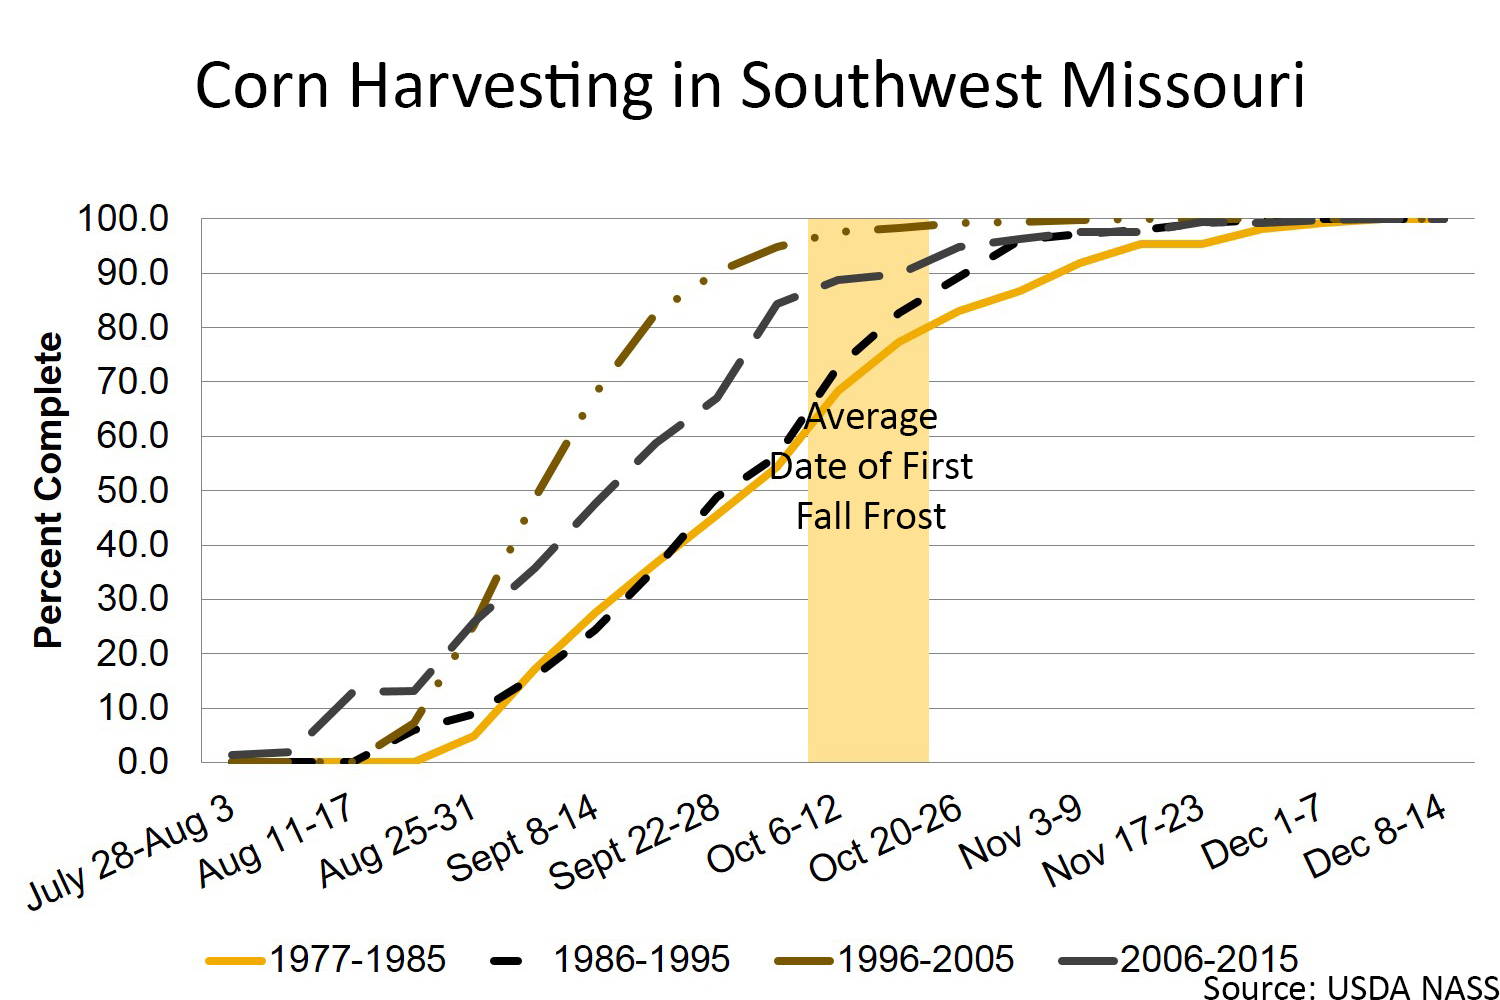
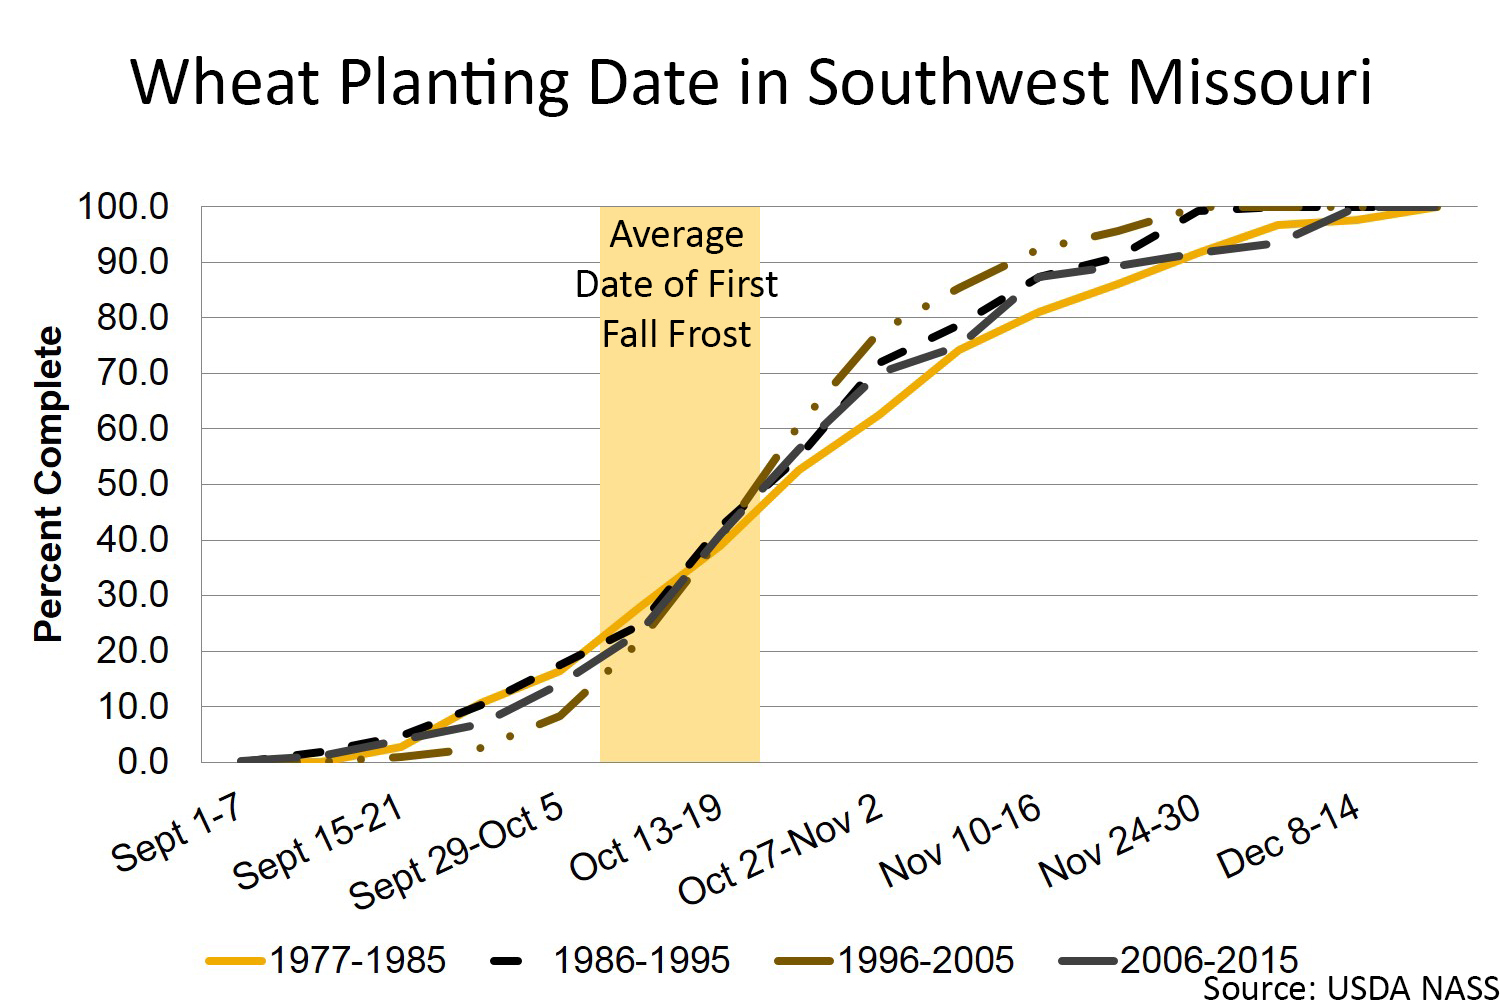
These graphs present the USDA Crop Progress Reports from 1977 to 2015 for the state of Missouri's Southwest (SW) district.
Southwest Missouri crop calendar
Soybean
Corn
Wheat
Southwest field working days
| Week Beginning | 25 percentile | 75 percentile range | Average |
|---|---|---|---|
| 28-Mar | 2.5 | 5.6 | 4.0 |
| 4-Apr | 2.7 | 5.7 | 4.3 |
| 11-Apr | 3.1 | 5.7 | 4.2 |
| 18-Apr | 2.9 | 5.7 | 4.3 |
| 25-Apr | 2.8 | 5.7 | 4.1 |
| 2-May | 2.5 | 5.4 | 4.0 |
| 9-May | 3.5 | 5.4 | 4.3 |
| 16-May | 2.9 | 5.7 | 4.1 |
| 23-May | 2.4 | 5.8 | 4.1 |
| 30-May | 3.1 | 5.5 | 4.4 |
| 6-Jun | 3.5 | 6.0 | 4.7 |
| 13-Jun | 3.1 | 6.0 | 4.6 |
| 20-Jun | 4.4 | 6.2 | 5.2 |
| 27-Jun | 3.6 | 6.7 | 5.0 |
| 4-Jul | 4.2 | 6.4 | 5.4 |
| 11-Jul | 5.3 | 6.4 | 5.7 |
| 18-Jul | 5.5 | 6.7 | 6.0 |
| 25-Jul | 5.2 | 6.5 | 5.7 |
| 1-Aug | 5.0 | 6.7 | 5.8 |
| 8-Aug | 5.5 | 6.8 | 6.0 |
| 15-Aug | 5.3 | 6.7 | 6.0 |
| 22-Aug | 5.7 | 6.8 | 6.1 |
| 29-Aug | 4.9 | 6.8 | 6.0 |
| 5-Sep | 5.0 | 6.9 | 5.9 |
| 12-Sep | 5.0 | 6.4 | 5.5 |
| 19-Sep | 4.8 | 6.3 | 5.4 |
| 26-Sep | 5.2 | 6.6 | 5.7 |
| 3-Oct | 5.2 | 6.5 | 5.6 |
| 10-Oct | 4.7 | 6.8 | 5.4 |
| 17-Oct | 4.9 | 6.3 | 5.2 |
| 24-Oct | 4.5 | 6.3 | 5.1 |
| 31-Oct | 4.1 | 6.0 | 4.8 |
| 7-Nov | 3.3 | 6.4 | 4.9 |
| 14-Nov | 4.0 | 5.9 | 4.7 |
| 21-Nov | 2.6 | 5.8 | 4.1 |
| 28-Nov | 2.1 | 3.9 | 2.9 |
| 5-Dec | 1.5 | 3.9 | 3.1 |
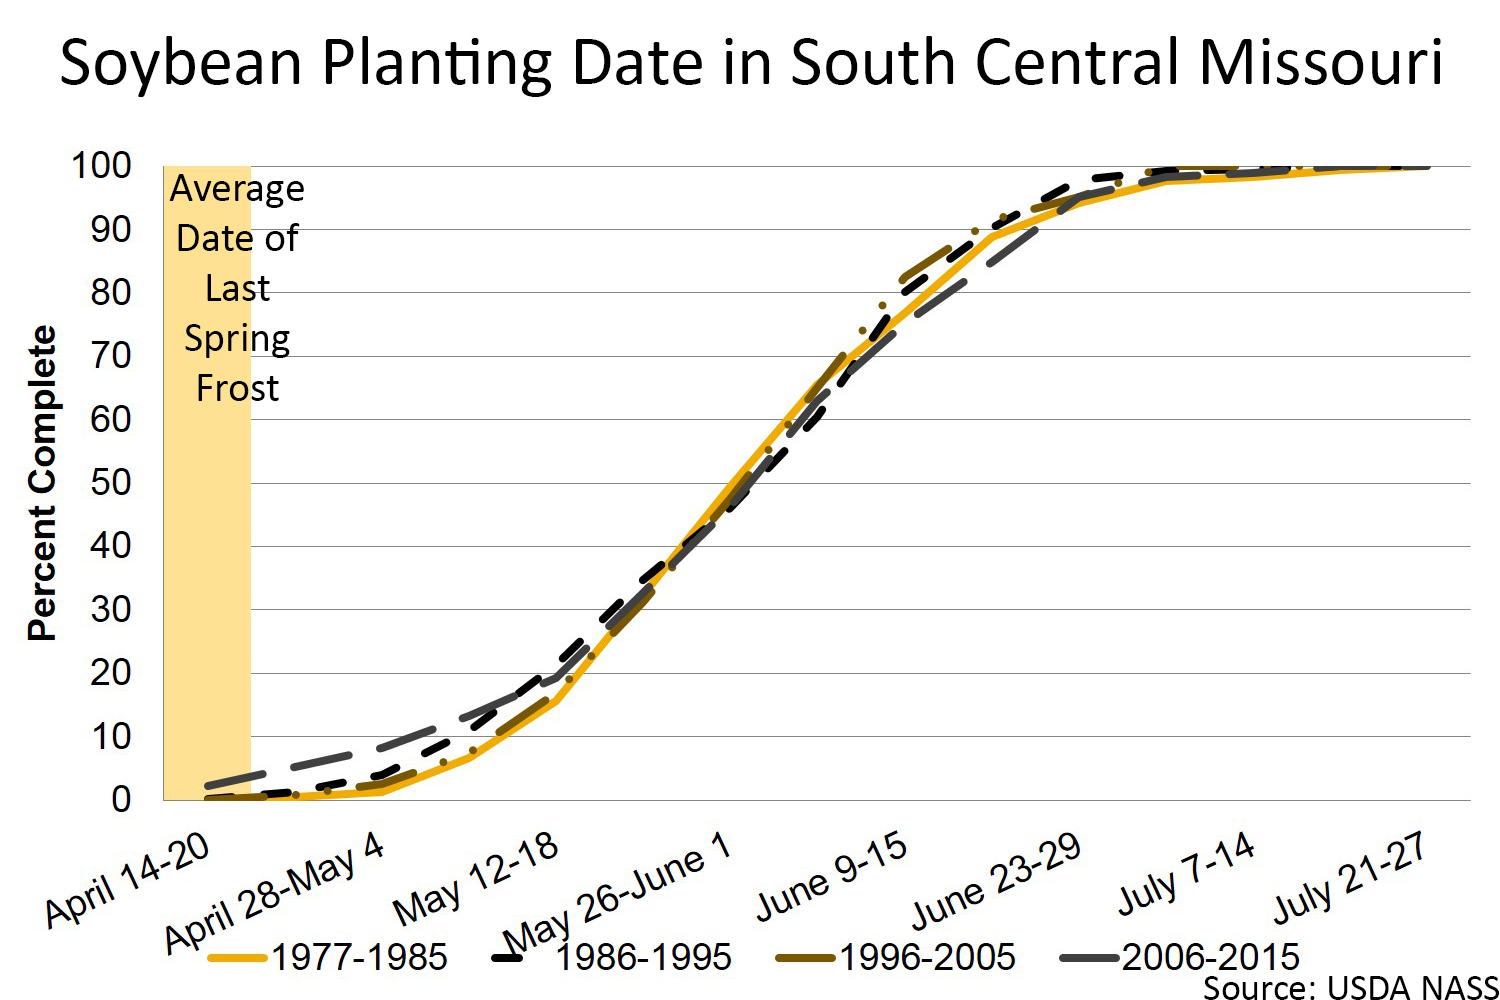
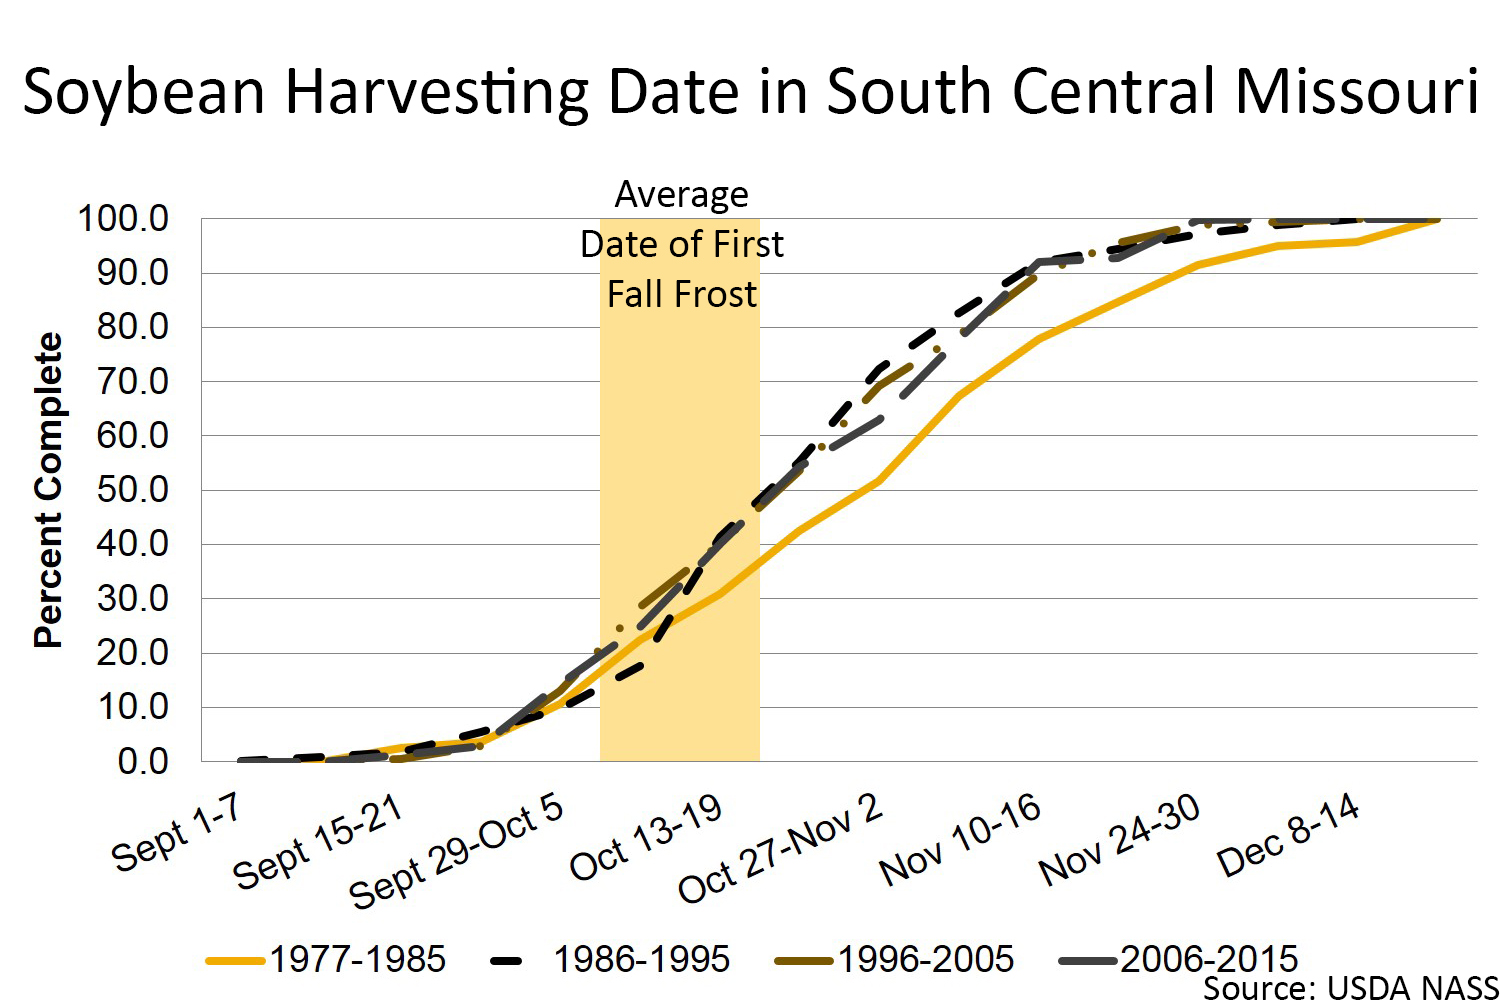
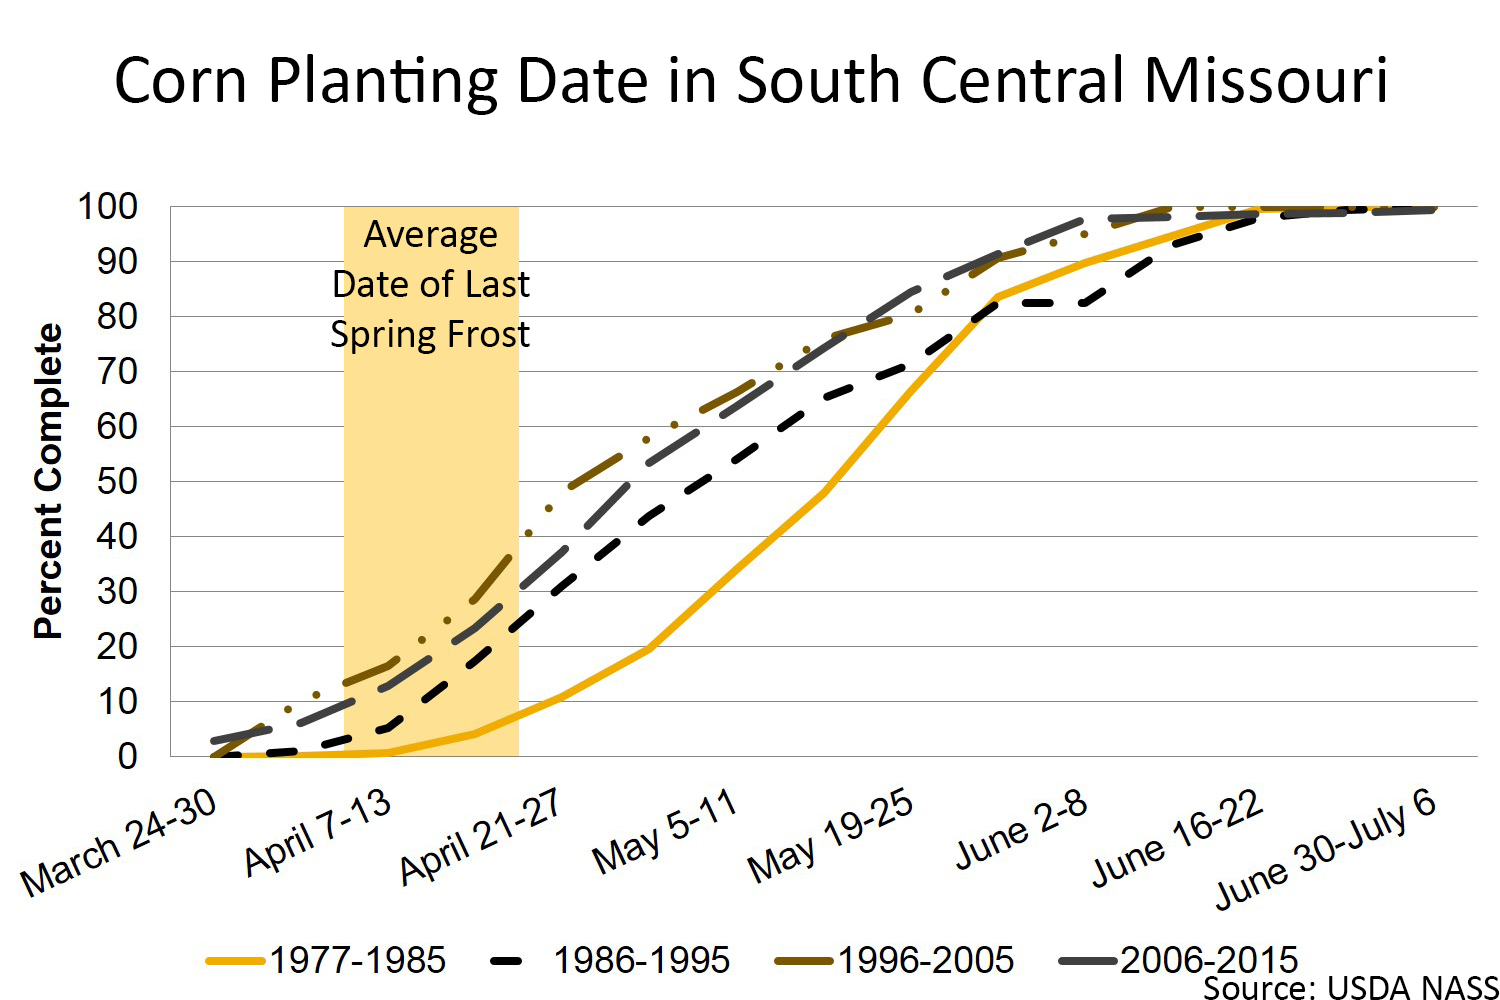
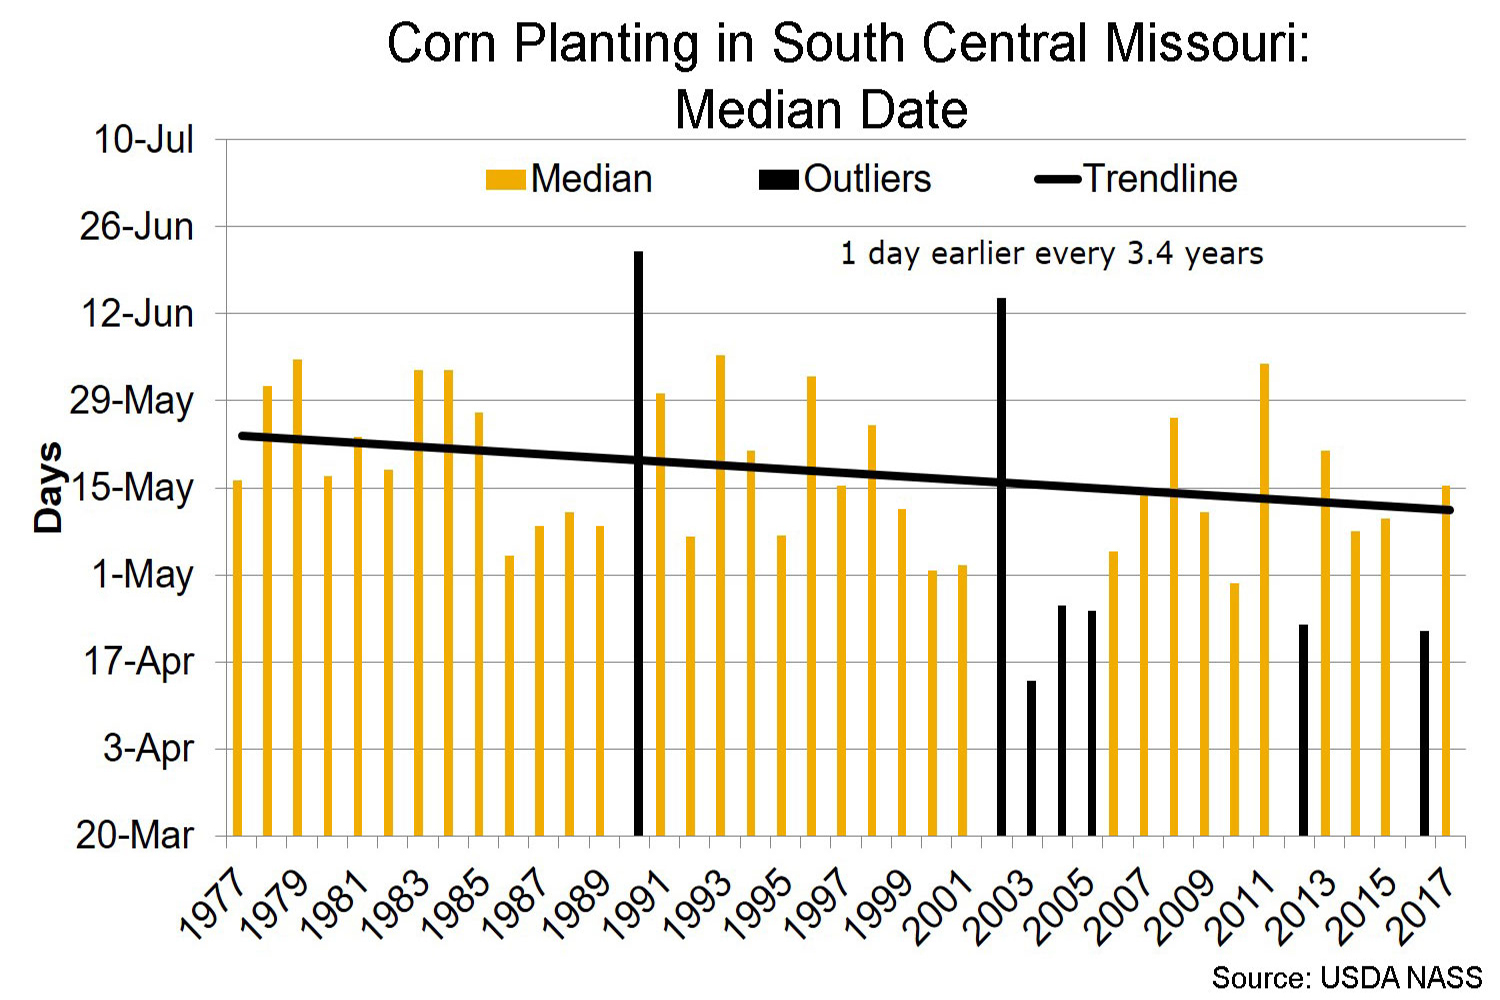
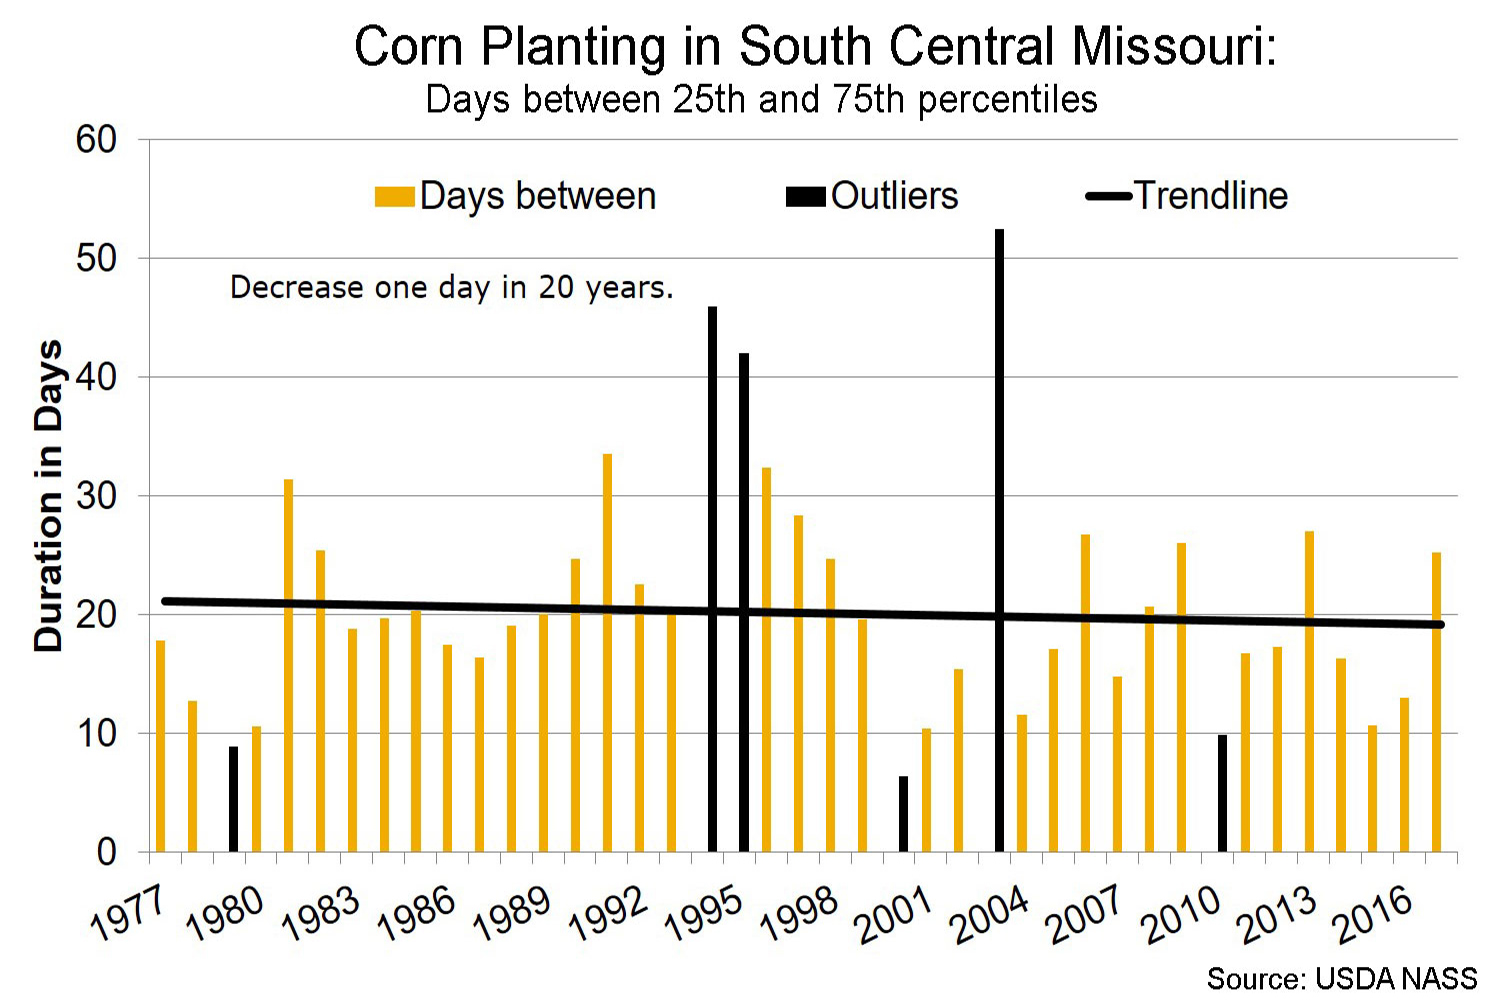
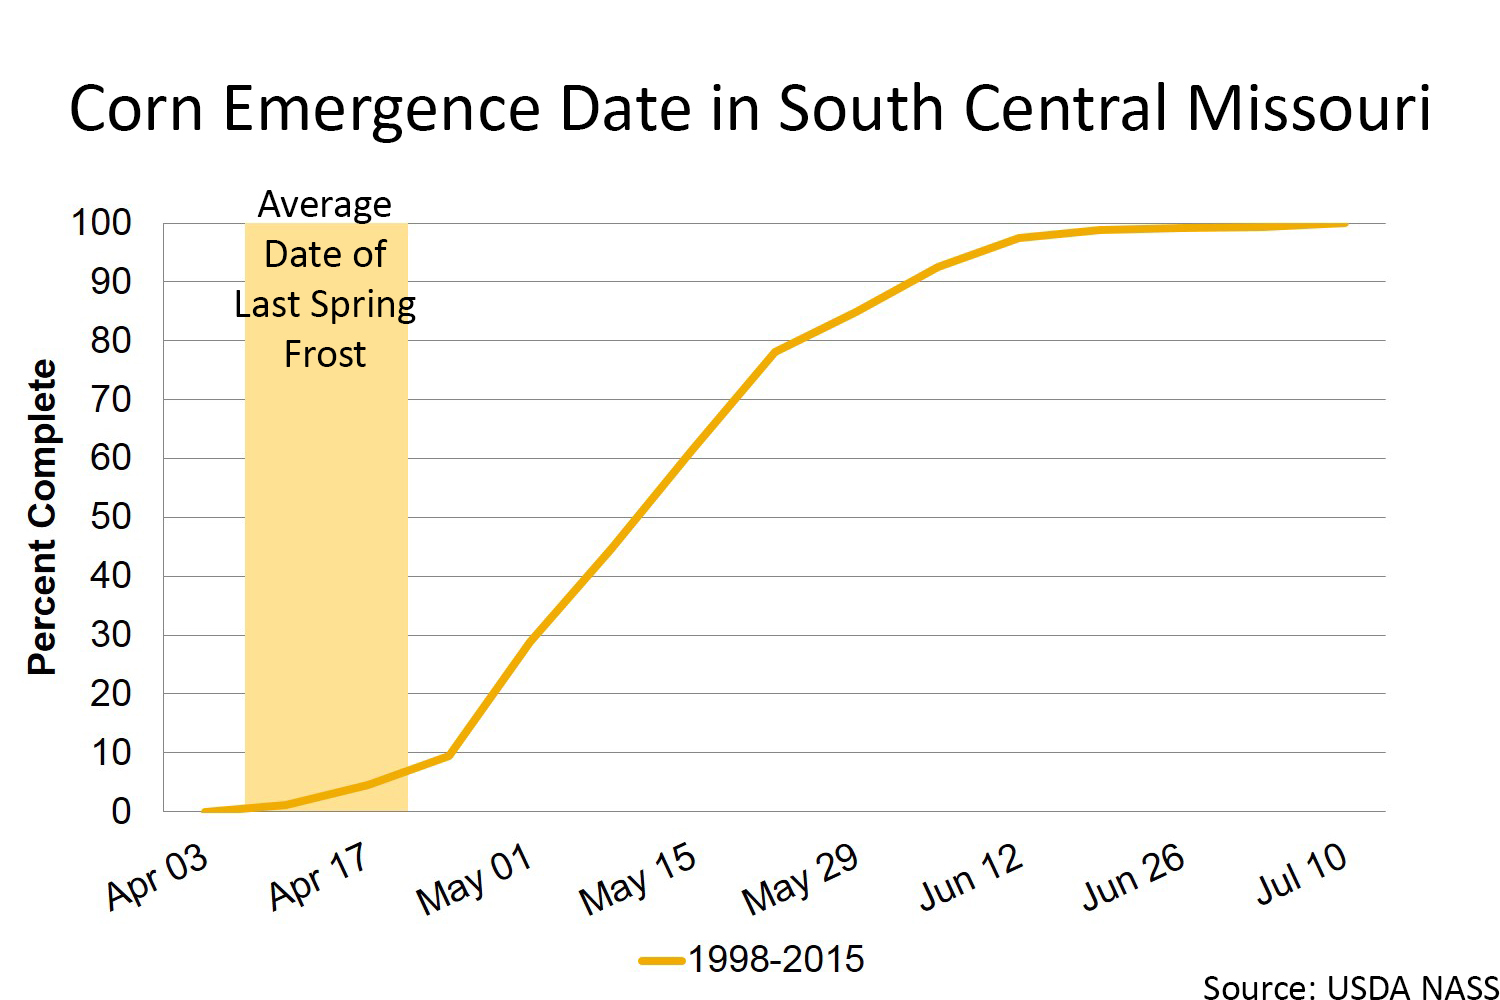
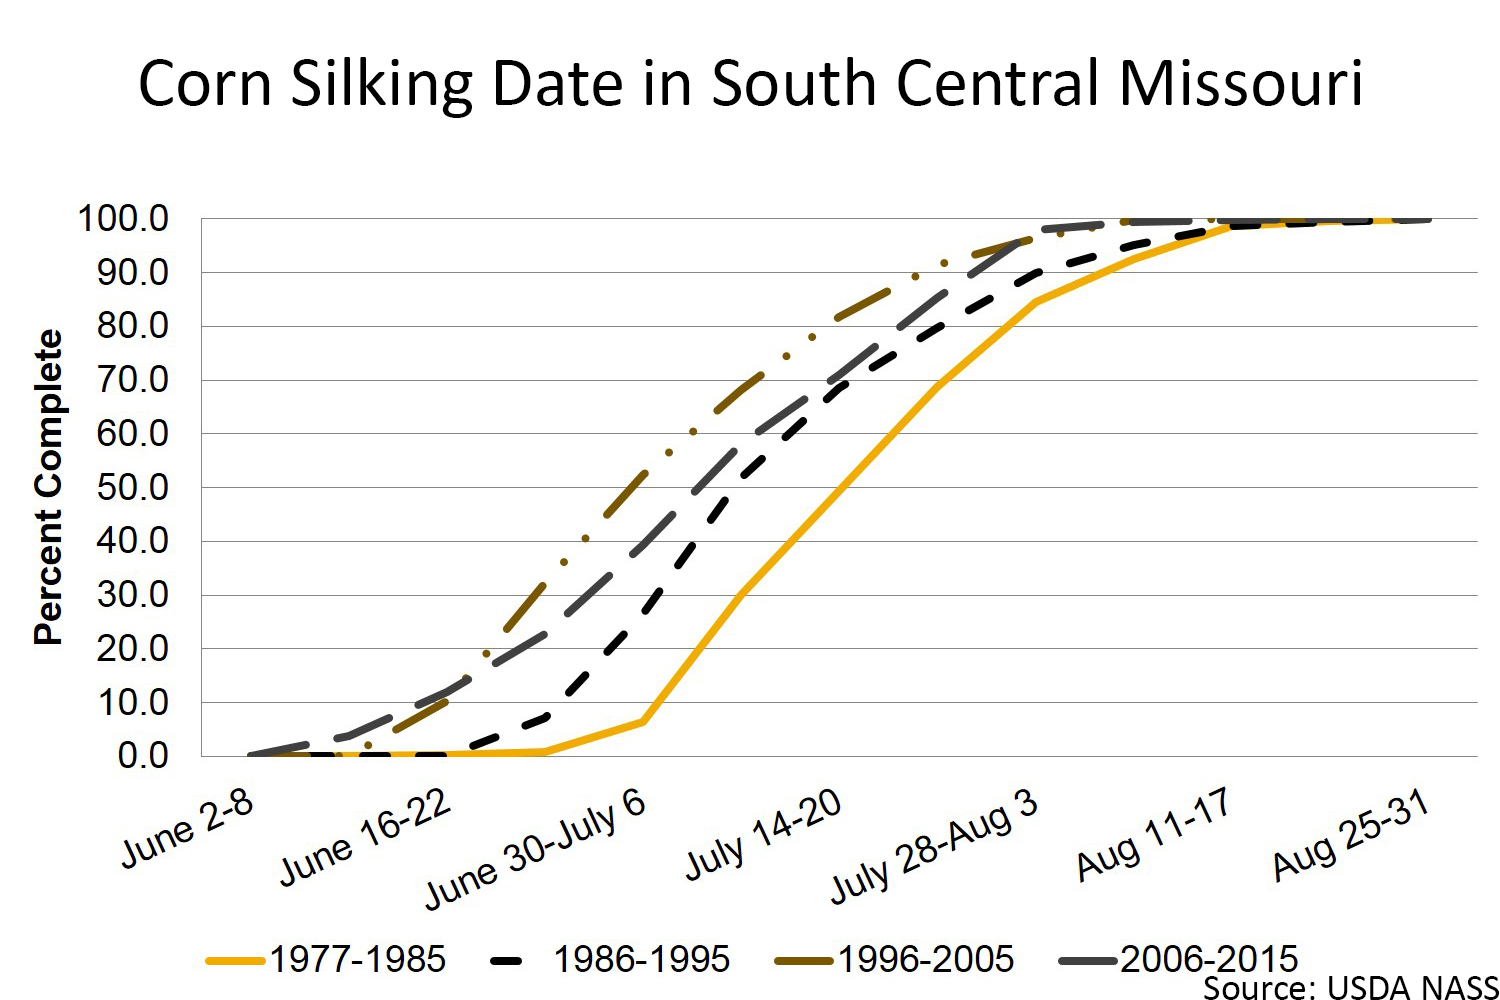
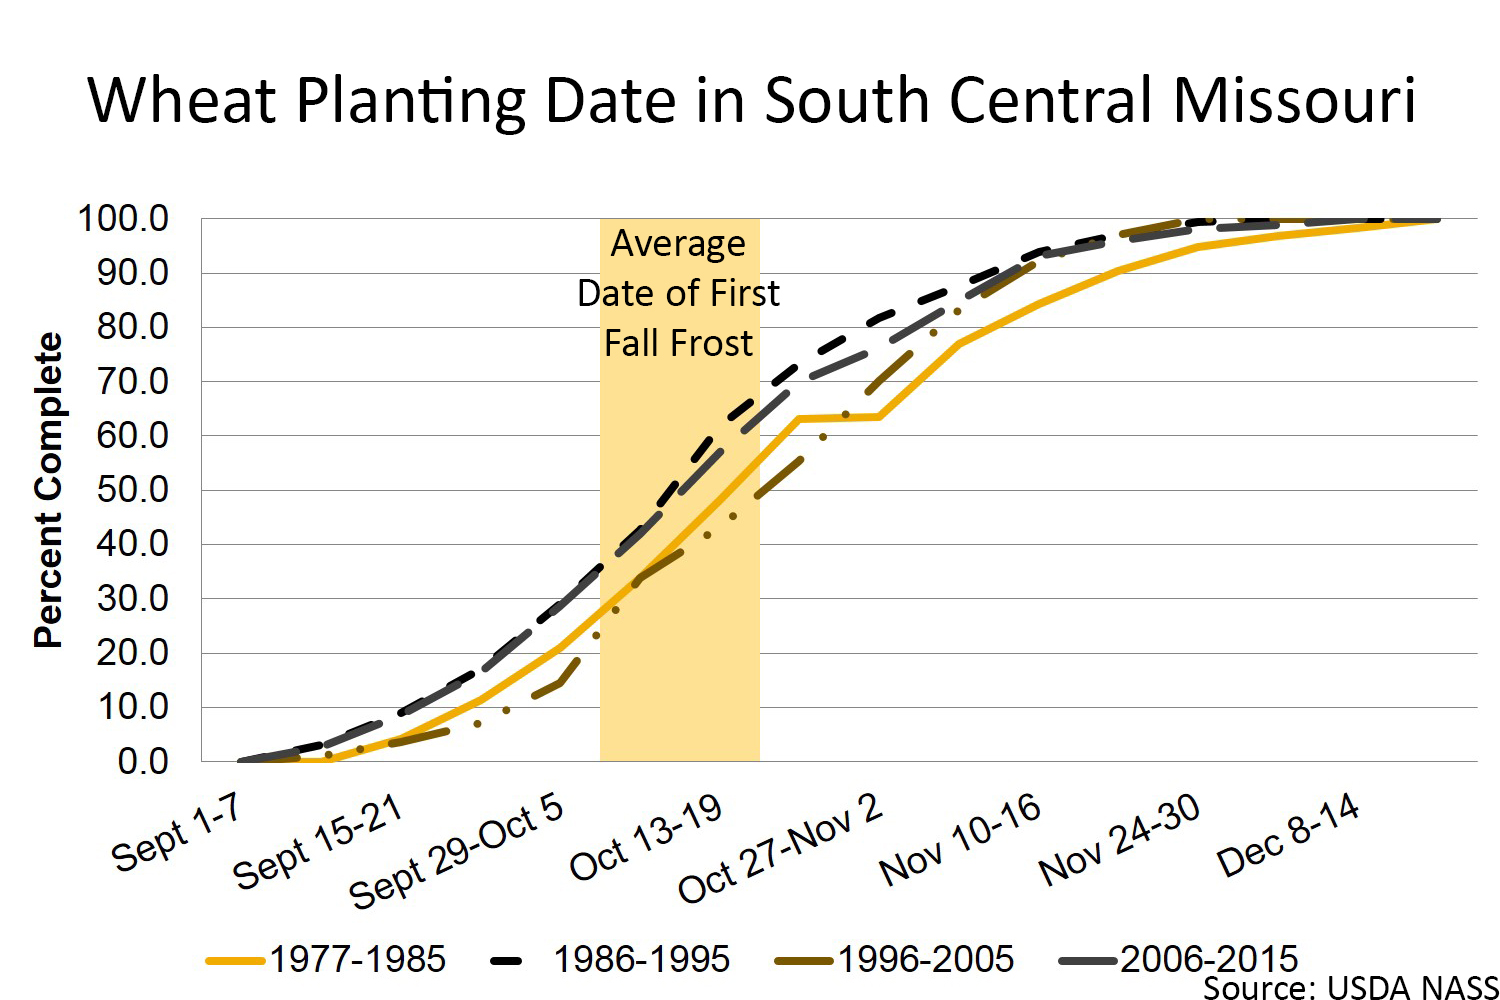
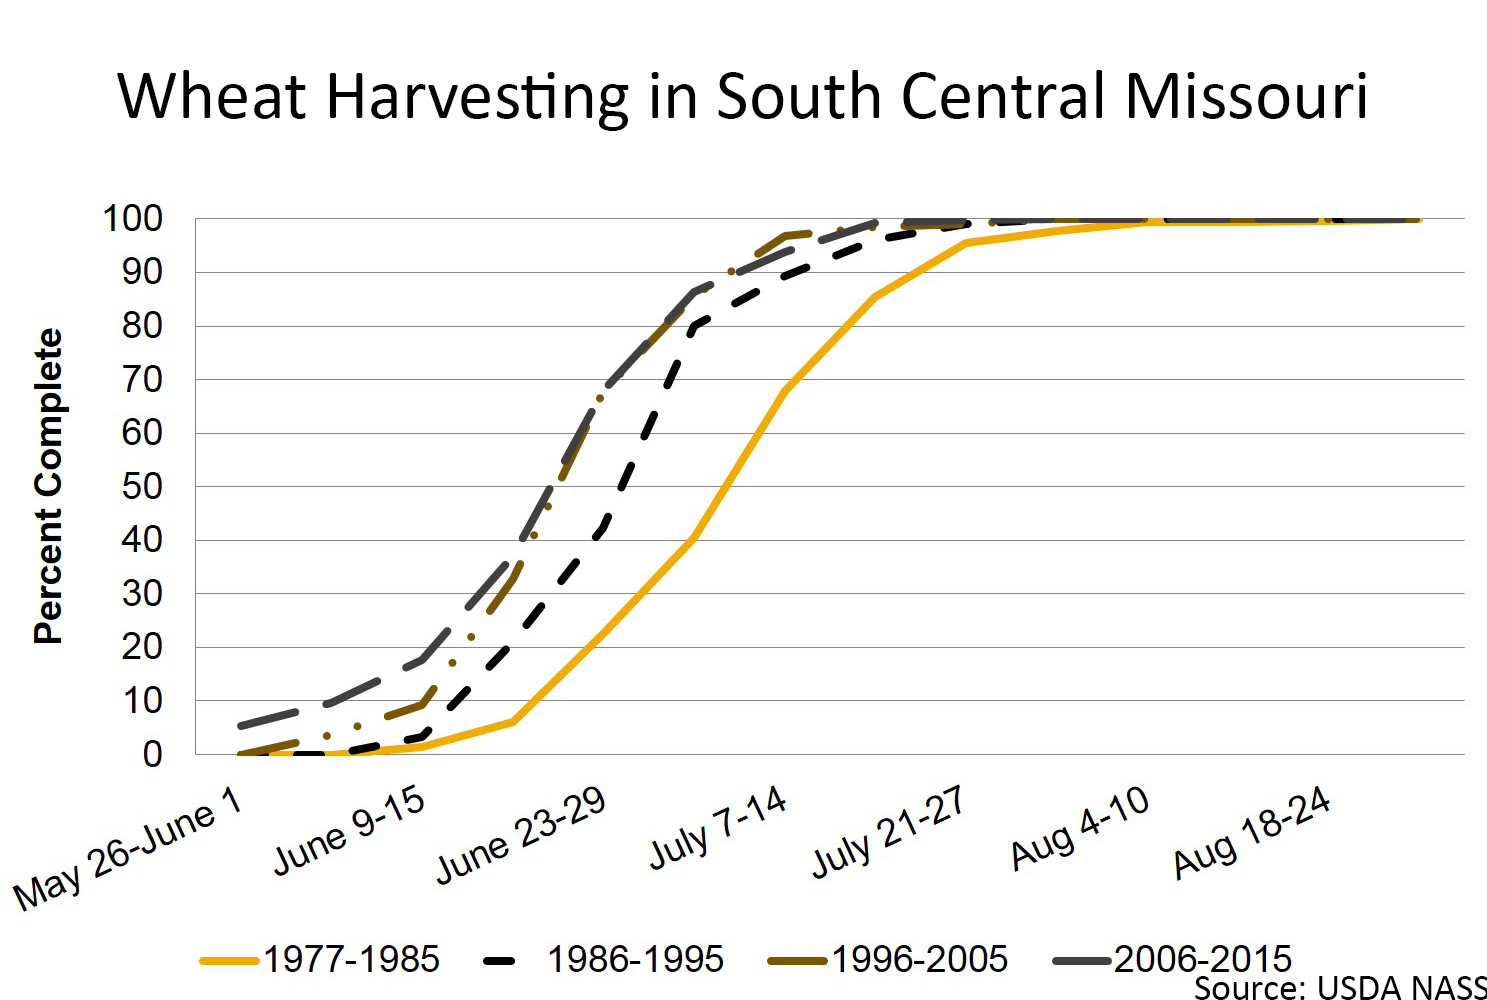
These graphs present the USDA Crop Progress Reports from 1977 to 2015 for the state of Missouri's South Central (SC) district.
South Central Missouri crop calendar
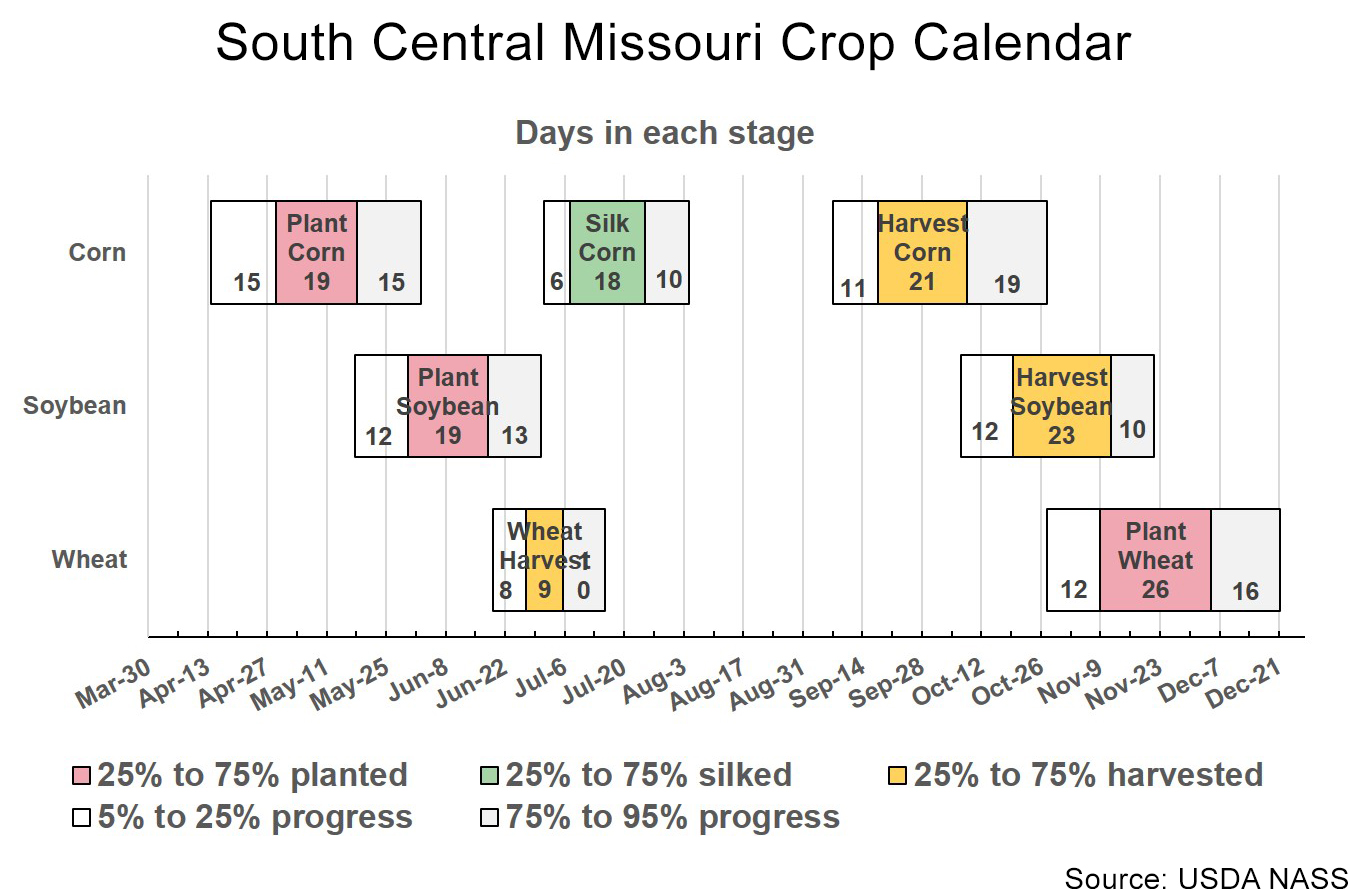
Soybean
Corn

Wheat
South Central field working days
| Week Beginning | 25 percentile | 75 percentile range | Average |
|---|---|---|---|
| 28-Mar | 2.5 | 5.5 | 4.1 |
| 4-Apr | 3.4 | 5.4 | 4.2 |
| 11-Apr | 3.3 | 5.9 | 4.3 |
| 18-Apr | 3.2 | 5.4 | 4.3 |
| 25-Apr | 3.2 | 5.0 | 4.1 |
| 2-May | 2.6 | 5.3 | 4.1 |
| 9-May | 3.0 | 5.7 | 4.2 |
| 16-May | 2.8 | 5.7 | 4.2 |
| 23-May | 3.4 | 5.7 | 4.5 |
| 30-May | 3.7 | 5.4 | 4.5 |
| 6-Jun | 3.9 | 6.2 | 4.8 |
| 13-Jun | 4.6 | 5.8 | 5.0 |
| 20-Jun | 4.5 | 6.3 | 5.4 |
| 27-Jun | 5.0 | 6.3 | 5.4 |
| 4-Jul | 4.8 | 6.3 | 5.5 |
| 11-Jul | 5.2 | 6.3 | 5.7 |
| 18-Jul | 5.3 | 6.3 | 5.8 |
| 25-Jul | 5.3 | 6.4 | 5.8 |
| 1-Aug | 5.4 | 6.5 | 5.7 |
| 8-Aug | 5.7 | 6.4 | 6.0 |
| 15-Aug | 4.9 | 6.6 | 5.8 |
| 22-Aug | 5.7 | 6.5 | 6.0 |
| 29-Aug | 5.4 | 6.7 | 6.0 |
| 5-Sep | 5.5 | 6.5 | 5.9 |
| 12-Sep | 5.3 | 6.3 | 5.7 |
| 19-Sep | 5.2 | 6.3 | 5.7 |
| 26-Sep | 5.3 | 6.6 | 5.7 |
| 3-Oct | 5.6 | 6.6 | 5.9 |
| 10-Oct | 4.8 | 6.5 | 5.4 |
| 17-Oct | 5.5 | 6.2 | 5.5 |
| 24-Oct | 4.6 | 6.0 | 5.2 |
| 31-Oct | 4.5 | 6.1 | 4.8 |
| 7-Nov | 3.7 | 6.2 | 5.0 |
| 14-Nov | 3.8 | 5.6 | 4.7 |
| 21-Nov | 2.9 | 5.4 | 4.1 |
| 28-Nov | 2.7 | 4.5 | 3.3 |
| 5-Dec | 1.7 | 4.4 | 3.1 |
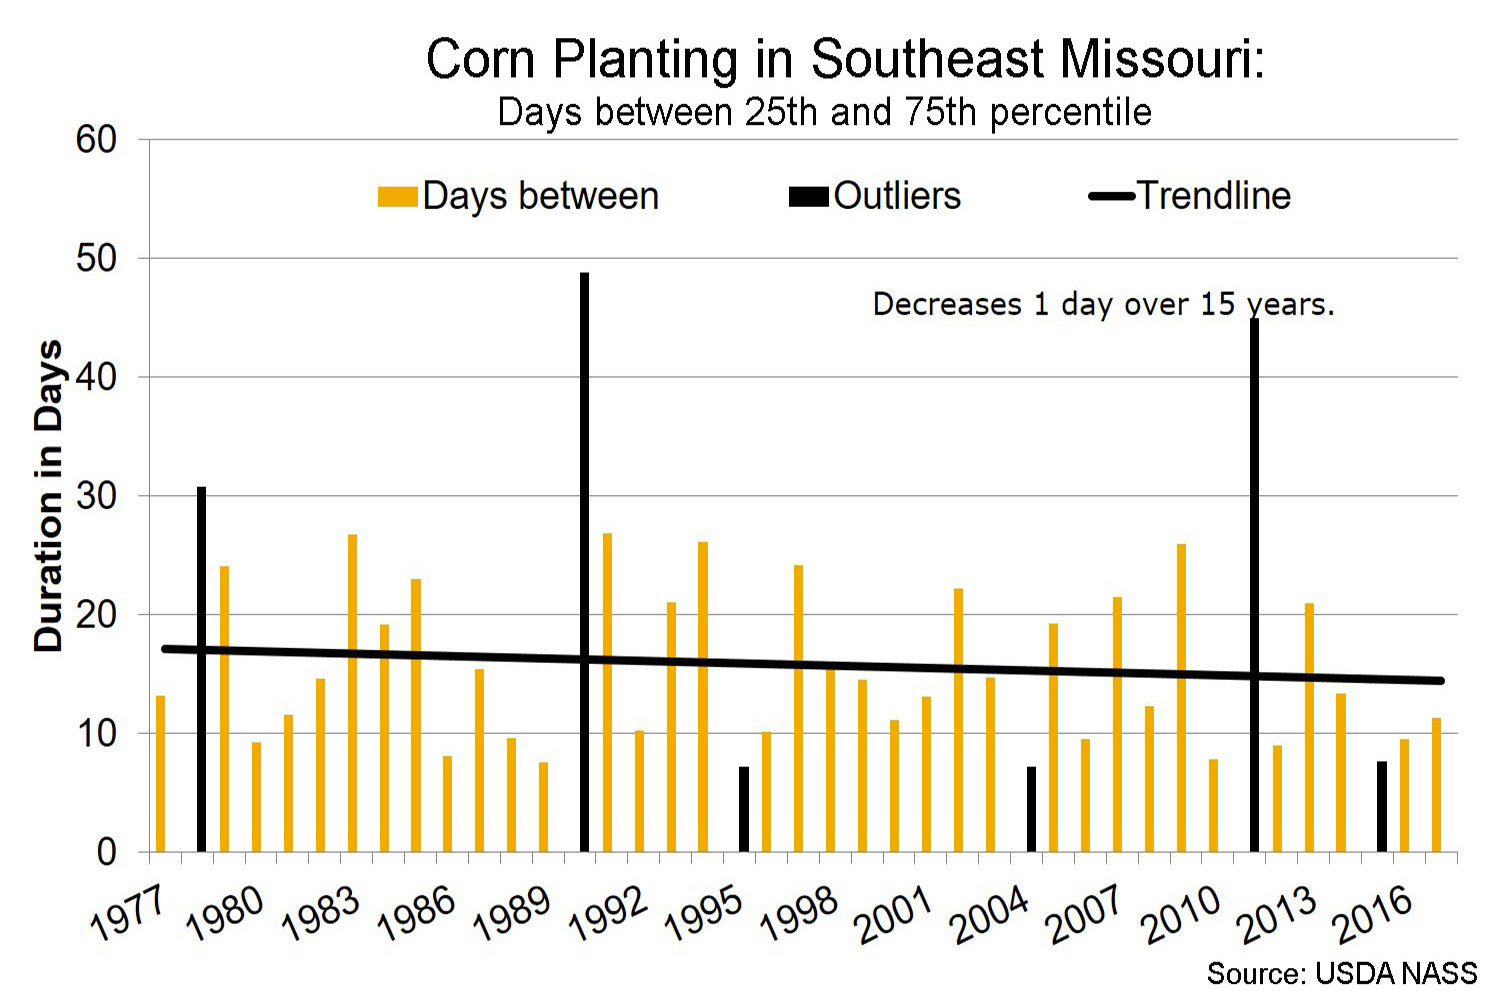
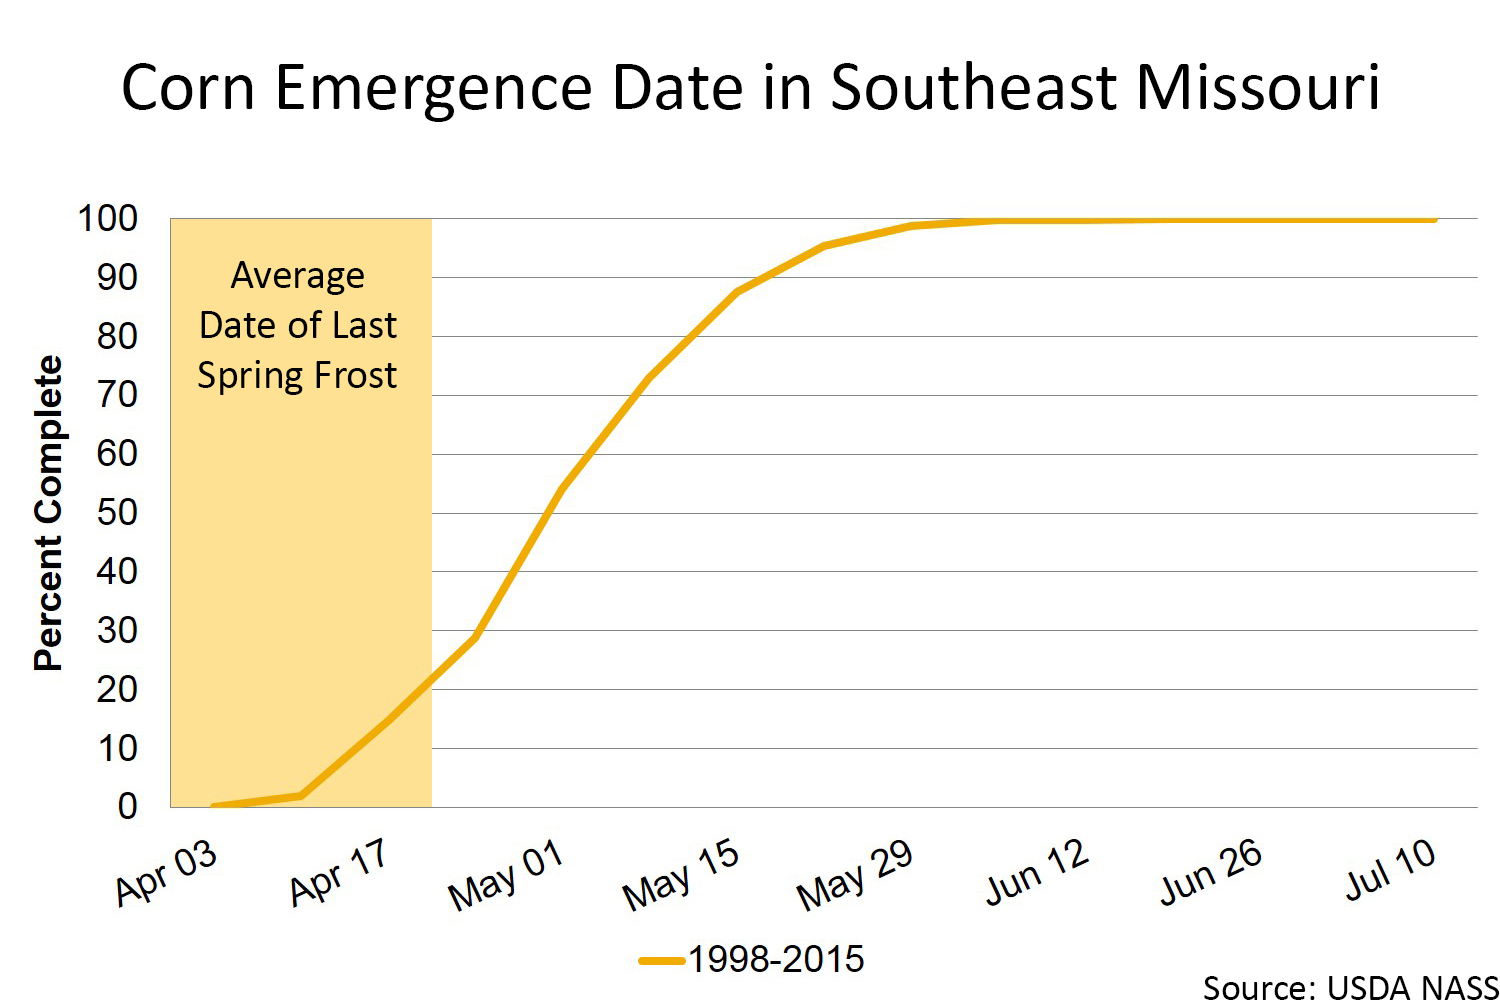
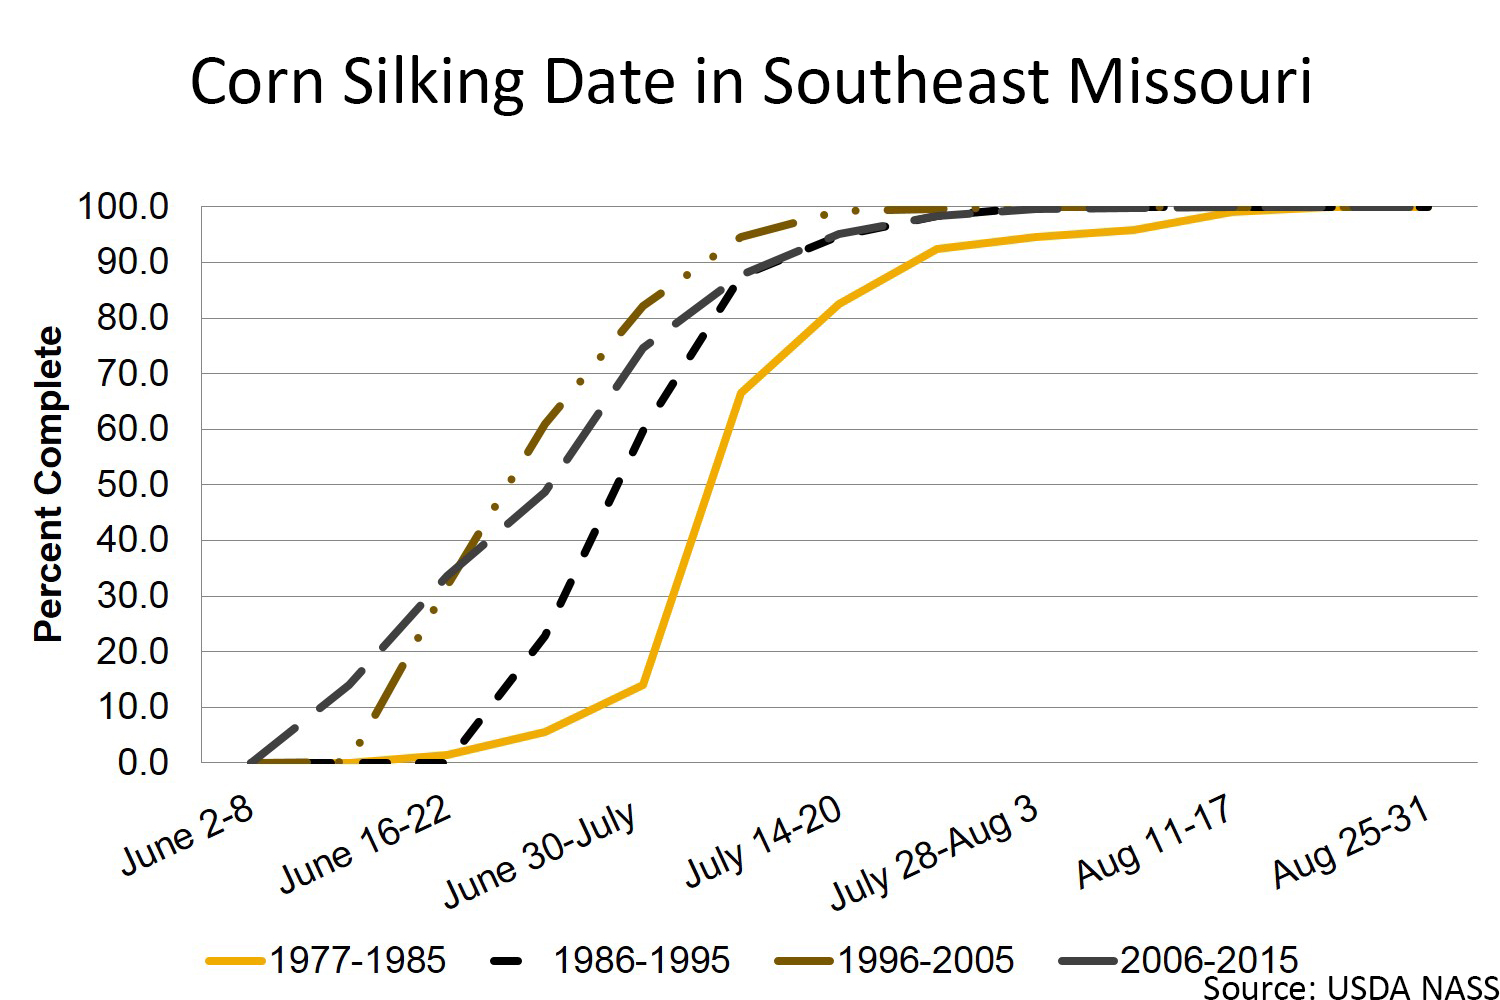
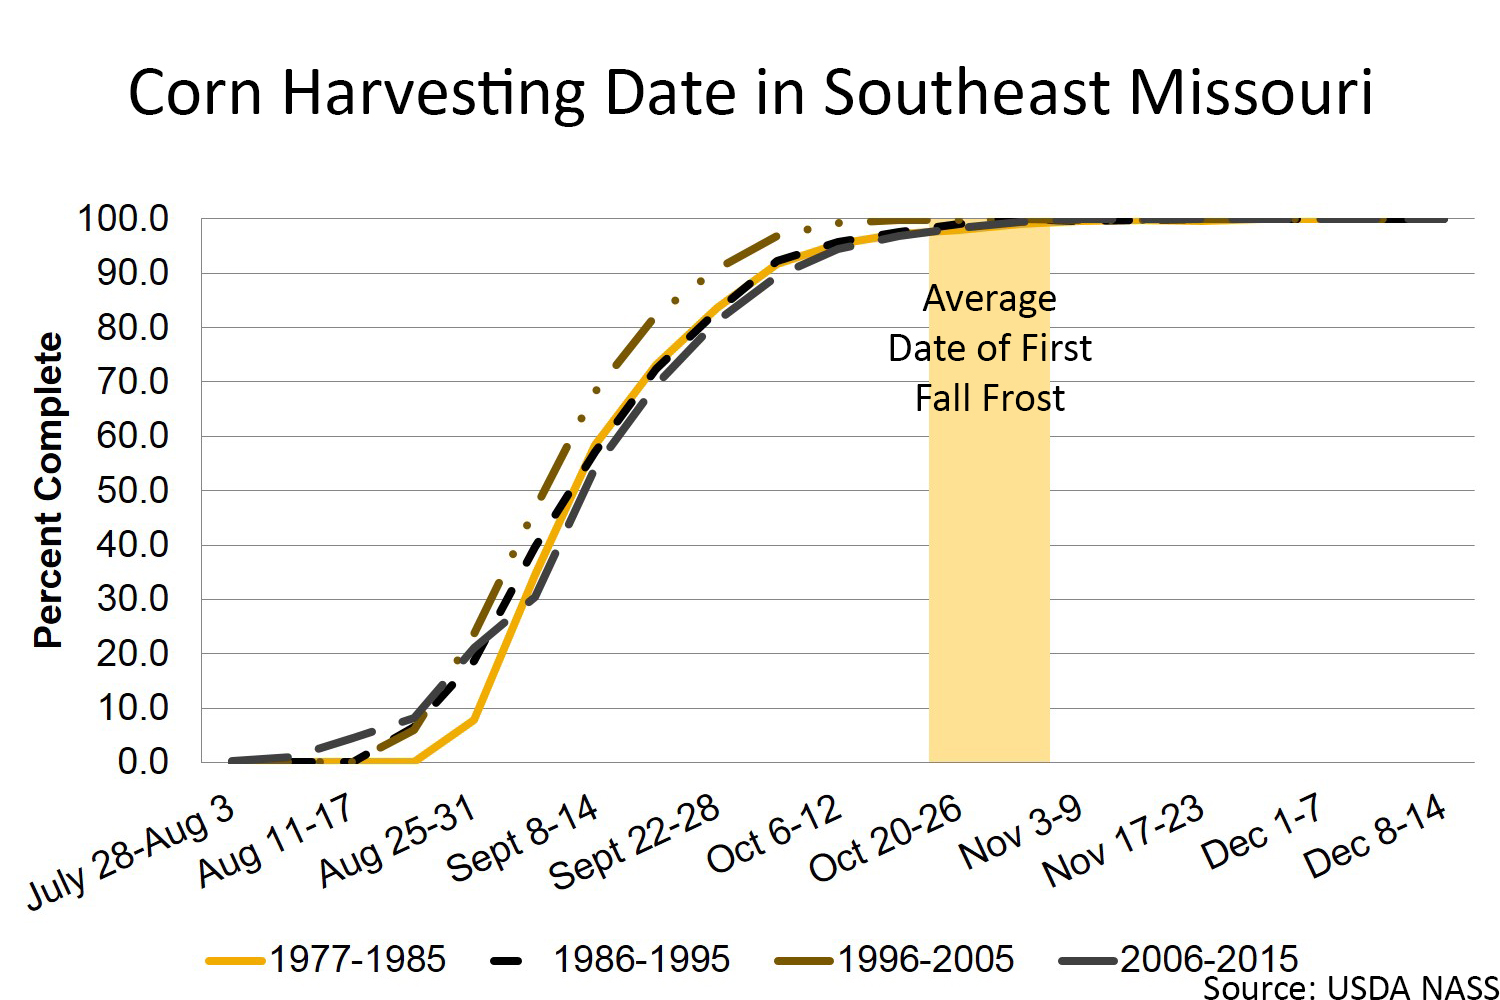
These graphs present the USDA Crop Progress Reports from 1977 to 2015 for the state of Missouri's Southeast (SE) district.
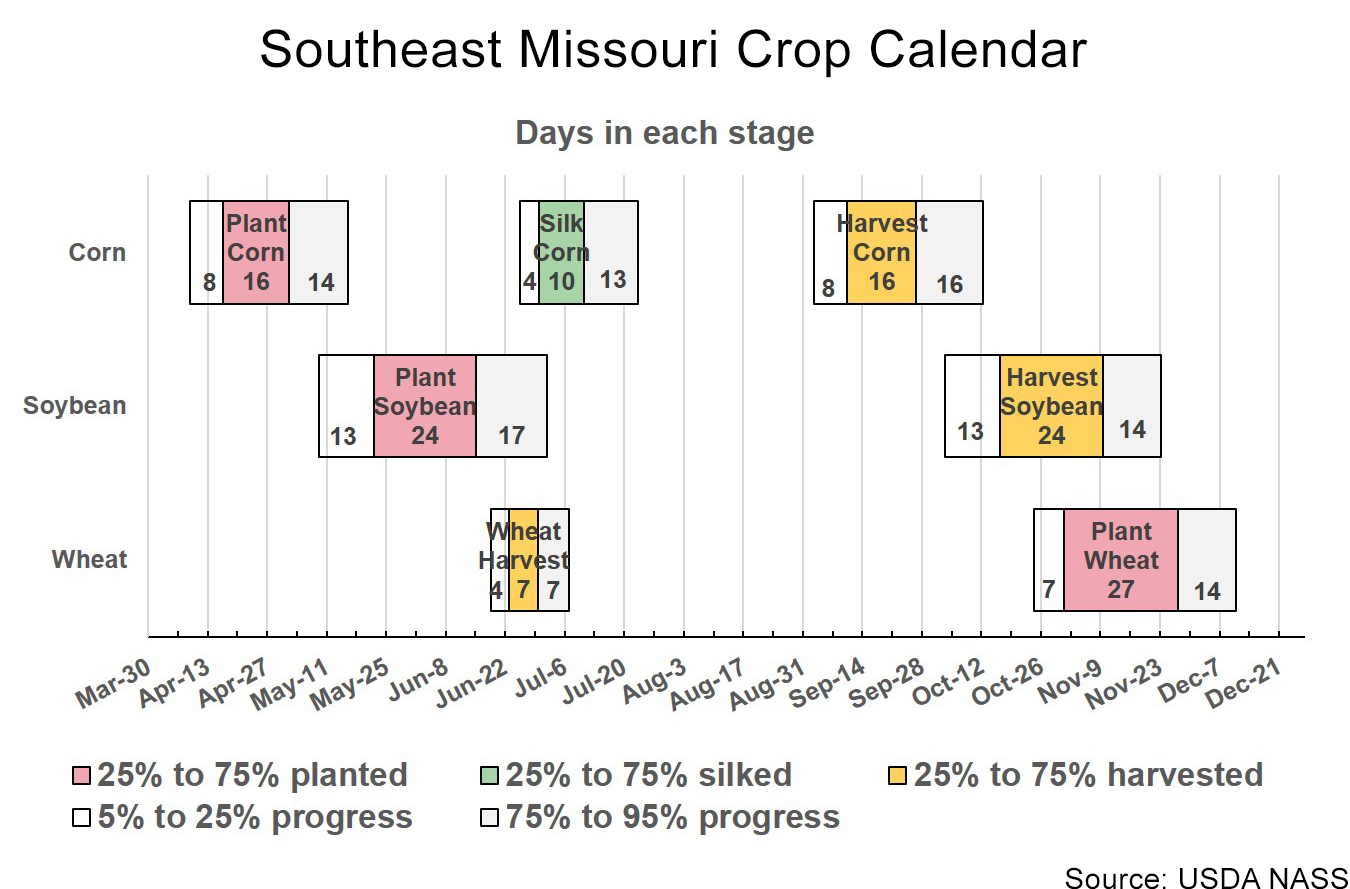
Southeast Missouri crop calendar
Soybean
Corn
Wheat
Southeast field working days
| Week Beginning | 25 percentile | 75 percentile range | Average |
|---|---|---|---|
| 28-Mar | 1.5 | 3.3 | 2.9 |
| 4-Apr | 2.1 | 4.4 | 3.1 |
| 11-Apr | 1.8 | 4.9 | 3.5 |
| 18-Apr | 2.1 | 5.3 | 3.6 |
| 25-Apr | 2.5 | 4.8 | 3.5 |
| 2-May | 1.6 | 5.1 | 3.2 |
| 9-May | 1.8 | 5.1 | 3.6 |
| 16-May | 2.4 | 5.7 | 4.0 |
| 23-May | 3.0 | 5.6 | 4.2 |
| 30-May | 3.3 | 5.2 | 4.4 |
| 6-Jun | 3.5 | 6.0 | 4.7 |
| 13-Jun | 4.0 | 6.2 | 4.8 |
| 20-Jun | 4.5 | 6.2 | 5.3 |
| 27-Jun | 4.1 | 6.3 | 5.2 |
| 4-Jul | 4.3 | 6.5 | 5.1 |
| 11-Jul | 4.7 | 6.4 | 5.2 |
| 18-Jul | 5.4 | 6.4 | 5.6 |
| 25-Jul | 4.8 | 6.5 | 5.5 |
| 1-Aug | 4.1 | 6.1 | 5.0 |
| 8-Aug | 5.0 | 6.5 | 5.7 |
| 15-Aug | 5.2 | 6.6 | 5.7 |
| 22-Aug | 5.3 | 6.7 | 6.0 |
| 29-Aug | 4.9 | 6.8 | 5.7 |
| 5-Sep | 4.8 | 6.8 | 5.6 |
| 12-Sep | 5.3 | 6.5 | 5.6 |
| 19-Sep | 4.5 | 6.3 | 5.3 |
| 26-Sep | 4.4 | 6.5 | 5.2 |
| 3-Oct | 5.2 | 6.6 | 5.8 |
| 10-Oct | 3.9 | 6.6 | 5.1 |
| 17-Oct | 4.3 | 6.2 | 4.7 |
| 24-Oct | 3.6 | 5.4 | 4.4 |
| 31-Oct | 2.8 | 6.2 | 4.3 |
| 7-Nov | 3.0 | 5.8 | 4.3 |
| 14-Nov | 2.0 | 5.0 | 3.8 |
| 21-Nov | 3.1 | 4.4 | 3.6 |
| 28-Nov | 0.8 | 2.9 | 1.8 |
| 5-Dec | 1.2 | 2.8 | 2.2 |