What is Permanganate Oxidizable Carbon (POXC)?
Soil organic matter (SOM) influences nutrient cycling, water retention, and biological activity, which is a cornerstone of soil health. Total soil organic carbon (SOC) constitutes about 58% of SOM. Total SOC is an important long-term measure of soil quality, but it changes slowly and may not reflect the impact of recent changes in crop management. Permanganate oxidizable carbon (POXC), also referred to as reactive carbon, is a widely used indicator for assessing the reactive fraction of total SOC, which is the portion of carbon most readily available for microbial metabolism and nutrient cycling (Weil et al., 2003; Culman et al., 2013). Typically, POXC accounts for 1-4% of total SOC (Culman et al., 2012; Hurisso et al., 2016).
What does POXC measure?
Permanganate oxidizable carbon is a sensitive soil health indicator that quantifies the biologically reactive fraction of SOM (Weil et al., 2003; Culman et al., 2012). This fraction consists of organic compounds that are readily decomposed by soil microorganisms, including portions of fine particulate organic matter (53–250 µm) and mineral-associated organic matter (Culman et al., 2012). These compounds act as an immediate energy source for microbes that fuel key soil processes such as nitrogen mineralization, aggregate formation, and nutrient cycling (Culman et al., 2012; Hurisso et al., 2016). From a soil fractionation perspective, POXC represents carbon pools that are chemically accessible to microbial enzymes and cycle over short-to-medium timescales (months to a few years) (Culman et al., 2012; Hurisso et al., 2016; Lavallee et al., 2020). This rapid turnover links POXC closely to soil biological activity and makes it more responsive to management changes than total SOC.
How is POXC measured in the laboratory?
In the laboratory, POXC is measured by shaking a small amount of air-dried, sieved soil with a dilute solution of potassium permanganate (KMnO4) (Weil et al., 2003; Culman et al., 2012). This solution starts out in a deep purple color. As the permanganate reacts with the “reactive” organic carbon in the soil, the purple color fades. The remaining color is then measured with a spectrophotometer, and the loss of color is used to calculate the amount of readily oxidizable (reactive) carbon present in the sample. The results are expressed as mg C kg-1 or ppm. Readily oxidizable compounds such as simple carbohydrates, microbial metabolites, and portions of particulate organic matter are preferentially oxidized in this process. More stable carbon fractions, such as humified or charcoal-like materials, remain largely unaffected (Weil et al., 2003; Culman et al., 2012).
Why measure total soil organic carbon (SOC) or soil organic matter (SOM) individually?
Total SOC measures the sum of all carbon in the soil, including stable and reactive pools. The stable fraction, which makes up the majority of SOC, changes very slowly and often requires decades of consistent management before measurable differences are detected (Gregorich et al., 1994; Sanderman & Baldock, 2010). This slow response makes the total SOC less effective for tracking recent management changes.
In contrast, POXC isolates the small, highly dynamic portion of SOC that turns over relatively quickly (Culman et al., 2012; Hurisso et al., 2016). This fraction consists of carbon compounds readily available to soil microorganisms and serves as an immediate energy source that drives nutrient mineralization, soil aggregation, and other soil functions. The rapid responsiveness of POXC makes it a more sensitive indicator of short- and medium-term management effects than total SOC. For example, practices such as cover cropping, reduced tillage, and organic amendments often produce measurable increases in POXC within a few years before any detectable change in total SOC occurs (Fine et al., 2017). However, POXC can also be misleading if interpreted in isolation. For example, converting long-term no-till ground to intensive tillage can temporarily increase POXC values by accelerating decomposition, even though the practice may degrade overall soil health and long-term carbon storage.
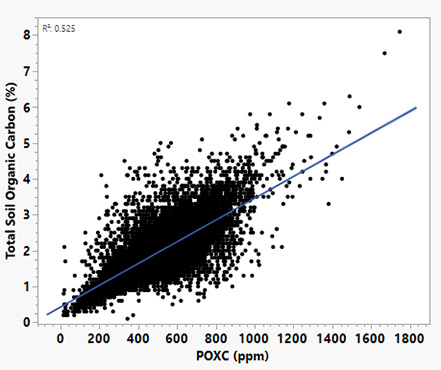
Across diverse long-term trials (Figure 1), POXC is often more responsive to management than total SOC (Hurisso et al., 2016; Morrow et al., 2016). Weil et al. (2003) showed that POXC is more sensitive to management than SOC. Extension summaries from Mandan, ND report POXC rising from ~470 to 600 ppm under long-term no-till, while little change in SOC was observed (AGVISE laboratories, 2019). Fields with identical total SOC values (e.g., 3%) can differ greatly in POXC, and can help explain differences in nutrient cycling rates, microbial activity, and crop responsiveness. While POXC and total SOC are generally correlated (Figure 1), POXC captures recent changes in soil biological function.
Since POXC reflects the biologically reactive carbon pool, it serves as an early-warning indicator of changes in soil function. Detecting these changes early enables farmers, researchers, and crop advisers to make timely adjustments that sustain productivity, enhance nutrient cycling, and protect long-term soil health (Culman et al., 2012).
Why is POXC important?
Soil POXC represents the reactive organic carbon pool, and it is directly linked to soil functions that support crop production and ecosystem resilience. The reactive carbon fraction serves as a readily available energy source for microbes, which subsequently influences nutrient cycling, biological activities, and provides an early signal of management-induced change.
- Nutrient cycling: POXC is a measure of microbial activity, such as microbial biomass and short-term carbon mineralization (CO₂ flush). Across diverse sites, both POXC and mineralizable carbon have shown stronger relationships with crop performance than other measured carbon pools (Culman et al., 2012; Hurisso et al., 2016). β-glucosidase (C cycling), phosphatase (P cycling), and arylsulfatase (S cycling) activity vary with carbon and nitrogen availability. Thus, reinforcing POXC’s role in nutrient cycling (Bowles et al., 2014).
- Biological activity: Higher POXC values are generally associated with greater microbial activity. Across multiple datasets, POXC is often positively associated with microbial biomass carbon and has been linked with basal respiration and improved aggregate stability, which signals faster residue breakdown and improved soil structure (Culman et al., 2012; Lucas & Weil, 2012).
- Early signs of change: Because POXC represents a readily oxidizable carbon pool, it is more sensitive to management than total SOC and can quantify recent changes in soil biological function (Weil et al., 2003; Culman et al., 2012). Across diverse U.S. sites, POXC has been related to mineralizable carbon and predicts crop performance better than several other carbon fractions, supporting its use as an early indicator of soil health trends (Hurisso et al., 2016).
How does POXC differ from other soil health indicators?
Permanganate oxidizable carbon functions as an early-responding, management-sensitive indicator of reactive carbon in soils. It often aligns with and sometimes outperforms other core biological and structural soil health metrics. Because of its biological relevance, POXC can be correlated with other soil health indicators such as microbial biomass carbon (MBC), potentially mineralizable nitrogen (PMN), and soil enzyme activities (Culman et al., 2012; Lucas & Weil, 2012; Hurisso et al., 2016; Hok et al., 2018; Dahal et al., 2021).
- Microbial Biomass Carbon (MBC): The MBC test, measured by chloroform fumigation–extraction, estimates the living microbial portion of soil organic carbon (Vance et al., 1987). In contrast, POXC is a simpler, faster, and lower-cost test that quantifies a readily oxidizable carbon pool. It often responds to management changes more quickly than total SOC and is frequently associated with microbial biomass and short-term respiration (Weil et al., 2003; Culman et al., 2012). In practice, MBC tells you how much microbial biomass is present, while POXC indicates how much readily usable “food” is available to the microbes.
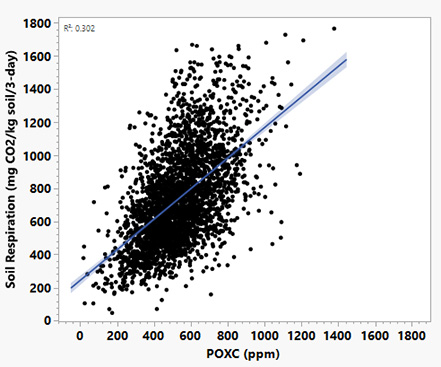
- Soil respiration (CO₂ flush / short-term carbon mineralization): Soil respiration test on the CO₂ “flush” after rewetting captures short-term carbon mineralization from microbial metabolism and is influenced by both microbial biomass and the supply of easily used carbon (Franzluebbers, 2018; 2020). POXC does not measure activity directly, but it does estimate the size of a readily oxidizable carbon pool or the microbial “food” available in the soil (Weil et al., 2003; Culman et al., 2012). Both indicators are sensitive to management across diverse U.S. sites. POXC and mineralizable carbon (CO₂ flush) are often positively related and share complementary roles in tracking biologically reactive carbon (Hurisso et al., 2016). POXC reflects the capacity to support microbes, while the CO₂ flush reflects the current rate of microbial activity. Missouri soil-health data also show a positive POXC relationship with soil respiration (Figure 2).
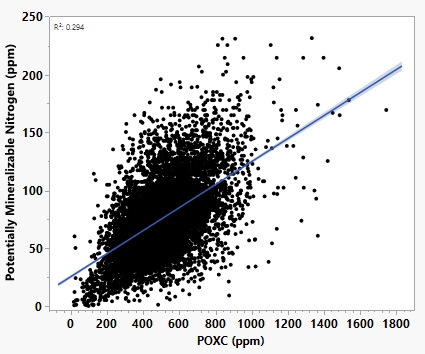
- Potentially Mineralizable Nitrogen (PMN): The PMN test estimates the amount of organic nitrogen that soil microbes can convert into plant-available forms under favorable conditions. PMN serves as an indicator of the soil’s biological nitrogen-supply potential (Drinkwater et al., 1997). Long-term studies demonstrate that management practices influence both reactive carbon and nitrogen pools (Marriott & Wander, 2006). While other studies do not show a direct correlation between POXC and PMN, Missouri soil health data indicate a positive relationship between the two indicators (Figure 3).
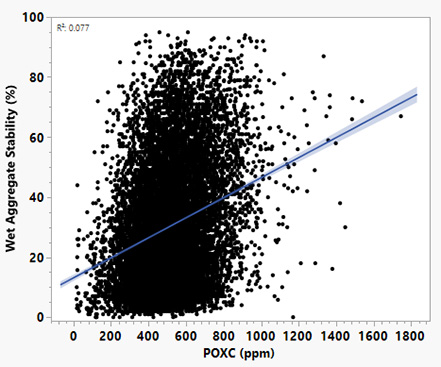
- Aggregate stability: Aggregate stability measures how well soil clumps or aggregates together when exposed to water or physical stress. Strong, stable aggregates indicate better soil structure, greater resistance to erosion, and improved water infiltration. POXC is connected to aggregate stability because soil microbes produce compounds (like polysaccharides) that help glue soil particles together and improve soil structure. Practices such as reducing tillage and adding more organic matter can increase POXC, which in turn has been linked to stronger water-stable aggregates, better water-holding capacity, and higher microbial activity (Bongiorno et al., 2019). However, data from Missouri shows that POXC and aggregate stability are not closely related (Figure 4). Other studies suggest that soil structure responds differently depending on the type of organic matter present and how land use changes over time. Soil structure improvements can happen relatively quickly, within about six years, when soils are supplied with organic matter inputs (Jensen et al., 2020).
- Other carbon tests: Soil health tests use several biological indicators because each one tells us something different about how soils function. For example, reactive carbon (POXC), soil protein (ACE protein), β-glucosidase activity, and water-extractable carbon measures are all related but not identical, and each responds differently to management (Stott et al., 2010; Fine et al., 2017; Singh et al., 2018).
- POXC shows the amount of “reactive” carbon available to microbes.
- ACE protein measures protein-like nitrogen compounds that microbes can use.
- β-glucosidase reflects the soil’s ability to break down cellulose (plant residue).
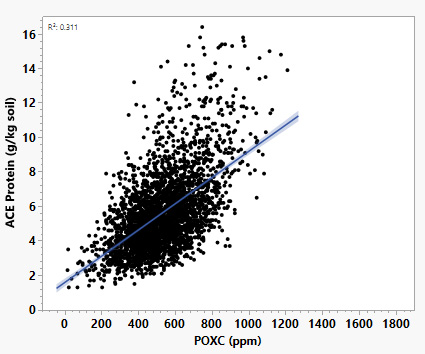
- Together, these measures give a broader picture of soil biological activity than any one test on its own. Missouri soil health data show that POXC and ACE protein are moderately correlated (Figure 5). Using multiple indicators helps farmers and researchers understand not only how much life is in the soil, but also what kinds of functions that life is supporting.
Soil sampling and testing for POXC
The value of POXC as a soil health indicator depends on consistent sampling and proper handling. Although POXC is often measured alongside routine soil fertility indicators, several specific considerations help ensure reliable, comparable results over time.
- Sampling depth: The most common sampling depth for POXC in cultivated fields is 0-6 inches (Soil Health Institute, 2023; USDA-NRCS, 2025), which corresponds to the plow layer and primary root zone (Weil et al., 2003; Culman et al., 2012). Maintaining the same sampling depth for all monitoring is critical for valid comparisons. POXC concentrations can vary greatly by depth due to residue distribution and root activity (Lucas & Weil, 2012).
- Sampling method: Use a clean soil probe or auger to collect multiple cores from a defined sampling area (e.g., management zone or whole field). Combine and thoroughly mix the cores to create a composite sample. Avoid atypical areas, such as former manure piles, wheel tracks, or visibly eroded areas that may bias results (USDA-NRCS, 2025). For long-term monitoring, georeferencing or GPS-marking sampling points help ensure repeated collection from the same location.
- Sample handling: Immediately after collection, air-dry samples at room temperature and sieve to <2 mm to remove large particles and homogenize the sample (Weil et al., 2003; Culman et al., 2012). This preparation reduces variability caused by moisture content and debris. At the University of Missouri – Soil Health Assessment Center (SHAC), these steps are completed as part of standard processing prior to POXC analysis.
- Laboratory analysis: At the University of Missouri – Soil Health Assessment Center, POXC is determined using a standardized potassium permanganate (KMnO₄) procedure adapted from Weil et al. (2003) and Culman et al. (2012). Air-dried soil is sieved to <2 mm, and a 2.5 g subsample is weighed into a tube or vial. Each sample is mixed with a known volume of 0.02 M KMnO₄ solution and shaken for a fixed reaction period (typically 2 minutes), followed by a short settling period (about 10 minutes). An aliquot of the supernatant is then transferred to cuvettes or microplates, and absorbance is read at 550 nm with a spectrophotometer. Reactive carbon is calculated from the decrease in KMnO₄ absorbance relative to standards and reported as mg C kg-1 soil (ppm). Using a consistent protocol and calibration across all samples ensures that POXC results are comparable over time and among fields.
Interpreting POXC results
A comprehensive statewide analysis of 13,143 agricultural soil samples collected across Missouri from 2015 to 2024 revealed that POXC concentrations ranged from 15 to 1,244 ppm, with 80% of samples (10th – 90th percentile) falling between 320 and 724 ppm. The statewide mean was 516 ppm, with a median of 507 ppm. Degraded soils with low organic matter content, often compacted or subject to prolonged intensive tillage, commonly had POXC <200 ppm, reflecting a severely limited microbial food base. In contrast, soils under long-term perennial cover or with frequent recent residue additions frequently exceeded 800 ppm. This indicates a highly reactive microbial system and substantial nutrient turnover capacity.
| Soil Health Category | POXC (ppm) | Soil Health Status/Implication | MO Soil Percentile |
|---|---|---|---|
| 1. Very Low | < 200 | Poor biological activity; depleted microbial food base. Often compacted or over-tilled soils, low fertility. | 0-5 |
| 2. Low | 200 – 400 | Microbial activity and nutrient cycling are limited. Needs organic inputs and cover crops. | 6-25 |
| 3. Medium | 401 – 600 | Moderate microbial function. Can support productivity with balanced management. | 26-80 |
| 4. High | 601 – 800 | High biological activity and potential nutrient turnover. Indicates reactive soil management. | 81-95 |
| 5. Very High | > 800 | Very reactive microbial system; strong indication of biological soil health and carbon inputs. | 96-100 |
Missouri-specific considerations
Based on Missouri’s 2015–2024 dataset (Figure 6):
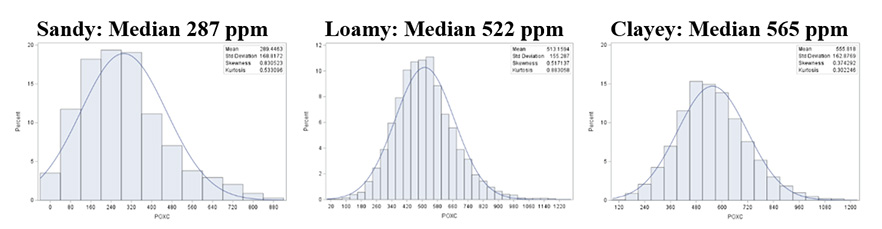
- Sandy soils (sand, loamy sand, sandy loam; typical range: 97 – 502 ppm; Mean <300 ppm) have lower inherent capacity for POXC storage, but these soils can still achieve major percentage gains with high-residue cover crops and manure applications.
- Loamy soils (loam, silt, silt loam, sandy clay loam, clay loam; typical range: 327 – 724 ppm; Mean: 500 ppm) respond well to stacked practices, combining no-till, diverse covers, and organic amendments.
- Clayey soils (clay, silty clay, sandy clay, silty clay loam; typical range: 356 – 802 ppm; Mean >550 ppm) retain POXC longer, but they still benefit from management that maintains continuous carbon inputs.
Soil texture is going to affect the POXC amount. For example, a 500 ppm POXC could be quite good for sandy soils, but it is only moderate for loams/clays, which tend to stabilize more reactive carbon due to greater surface area and microaggregation (Six et al., 2000; Wander & Drinkwater, 2000). The interpretation of POXC needs to consider soil texture and management history.
Management strategies to improve POXC
Building and maintaining high levels of POXC requires consistent management to increase organic matter inputs, protect soil structure, and support microbial activity.
- Increase organic matter inputs: Adding fresh, high-quality organic matter is the most effective way to raise POXC because it directly fuels microbial activity and replenishes labile carbon pools.
- Cover cropping
- Winter cover crops such as cereal rye, triticale, and hairy vetch provide root exudates and residue that feed soil microbes during the fallow period.
- Multi-species cover crop mixes improve residue quality and diversity, often producing larger POXC gains than single-species covers (McDaniel et al., 2014; Florence & McGuire, 2020; White et al., 2020; Decker et al., 2022).
- Organic amendments
- Livestock manure, poultry litter, compost, and crop residues contribute readily oxidizable carbon and nutrients that stimulate microbial growth (Wander & Traina, 1996; Kong et al., 2005).
- Fresh residue and manure tend to increase POXC more rapidly than mature compost, which contributes more to stable SOC fractions (Hurisso et al., 2016; Wong et al., 2023). Biochar, in contrast, is typically dominated by more recalcitrant carbon forms that build long-term SOC but may have a more modest or mixed effect on POXC, depending on feedstock and production conditions (Joseph, 2015).
- Applying amendments according to nutrient management plans ensures carbon gains without excess nutrient loading.
- Crop residue retention
- Retaining and evenly distributing crop residues, rather than removing them for feed or burning, helps maintain reactive carbon inputs.
- High-biomass crops such as corn and sorghum contribute substantial amounts of carbon to the POXC pool.
- Cover cropping
- Reduce soil disturbance: Tillage disrupts soil aggregates, accelerates organic matter decomposition, and exposes reactive carbon to microbial oxidation.
- No-till and strip-till
- No-till systems generally have higher POXC than conventionally tilled systems under similar crop rotations (Ye et al., 2021; Weidhuner et al., 2021; Thapa & Mowrer, 2024)
- In Midwestern datasets, POXC is often higher under no-till than intensive tillage (Veum et al., 2022). Across 5,300 Missouri field samples, reactive carbon averaged approximately 15% higher under no-till.
- Strip-till can maintain the benefit of no-till while allowing targeted nutrient placement and seedbed preparation.
- Controlled traffic farming
- Limiting wheel traffic to permanent lanes reduces compaction and preserves pore structure, which supports microbial activity and carbon stabilization (Hamza & Anderson, 2005; McHugh et al., 2009).
- No-till and strip-till
- Diversify cropping systems: Rotation crop diversity enhances the quantity and quality of organic inputs and supports a more resilient soil food web.
- Including legumes (e.g., soybean, clover, alfalfa) adds nitrogen-rich residues, stimulates microbial growth, and contributes toward POXC accumulation (McDaniel et al., 2014).
- Deep-rooted crops such as canola or sunflower improve soil structure and distribute carbon deeper in the soil profile.
- Perennial crops, such as 2–3 years of alfalfa or prairie grasses, can elevate POXC levels above 1,000 ppm due to continuous root inputs (Dahal et al., 2021; Martin & Sprunger, 2022).
- Maintain continuous living roots: Roots release simple, highly bioavailable carbon compounds that sustain microbial communities even when aboveground growth is minimal.
- Avoid long fallow periods by planting cover crops immediately after harvest or interseeding them into standing crops.
- Relay cropping and double cropping can extend the period of living roots and enhance reactive carbon supply.
- Manage nutrients to support microbial activity: Balanced nutrient availability ensures microbes have the resources to decompose organic matter and build soil carbon.
- Adequate nitrogen and sulfur are particularly important for microbial processing of carbon inputs (Cleveland & Liptzin, 2007; Mooshammer et al., 2014).
- Over-application of synthetic nitrogen can accelerate decomposition without increasing stable carbon storage, which may potentially reduce long-term POXC gains.
- Protect soil from erosion: Erosion removes carbon-rich topsoil and organic matter, which reduces POXC.
- Maintain at least 30% residue cover year-round.
- Use grassed waterways, contour farming, terraces, and buffer strips to reduce runoff and sediment loss. Any practice that builds SOC, such as no-till, diverse cover crops, organic amendments, and complex crop rotations, also tends to increase POXC in the short term. Conversely, practices that disturb soil structure or reduce organic inputs decrease POXC.
Expected timeline for POXC change
- Short term (1–3 years): Detectable increases from adding cover crops, manure, or reducing tillage.
- Medium term (4–7 years): Substantial improvement in both POXC and related indicators such as PMN and enzyme activities.
- Long term (8+ years): Measurable gains in total SOC, with POXC serving as an ongoing early-warning and tracking metric.
Limitations of POXC
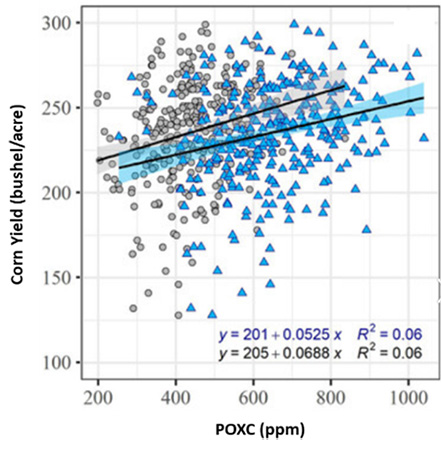
- Not a direct yield predictor: POXC is not a fertility test, and high POXC values do not necessarily indicate adequate nutrient availability for crops. Svedin et al. (2023) found that POXC was related to corn yield, with a threshold near 415 ppm, but this relationship only explains a modest portion of the yield variation (Figure 7). Rather than serving as a standalone measure of crop productivity, POXC functions as a process-based indicator of soil biological activity and organic matter dynamics. For meaningful interpretation, POXC should be evaluated in conjunction with other soil health and agronomic production factors such as nutrient levels, pH, soil compaction, water availability, and pest pressure.
- Protocol sensitivity: POXC values are influenced by sampling depth, soil moisture at sampling, and laboratory methodology. Consistent sampling protocols and use of the same laboratory are critical for reliable comparisons over time or among fields (Moebius-Clune et al., 2016).
- Site potential: Inherent soil properties, especially texture, place different “ceilings” on achievable POXC levels. As a result, POXC should be compared within similar soil types and management histories, rather than across contrasting soil groups (Lavallee et al., 2020).
- Short-term variability: Weather patterns (e.g., wet vs. dry periods) and recent residue inputs or disturbances can cause short-term fluctuations in POXC. Therefore, POXC is most useful when interpreted using multi-year trends and in combination with other soil and crop indicators, rather than from a single sampling event.
Practical recommendations
- Use POXC to track changes over time when implementing new soil health practices.
- Integrate POXC with other soil health and fertility tests for a complete understanding of soil processes.
- Maintain consistent sampling methods to ensure meaningful comparisons.
- Share results with crop advisors and soil health experts to help refine management strategies.
Summary and key takeaways
Permanganate oxidizable carbon measures the reactive, microbially available fraction of SOC. This is the portion most closely tied to nutrient cycling, microbial activity, and early changes in soil health. Unlike total SOC, which changes slowly, POXC responds quickly within 1–3 years to management practices such as cover cropping, reduced tillage, organic amendments, and diverse crop rotations. This makes it a sensitive, early indicator of soil health improvement or degradation.
Overall, POXC is like the checking account in the soil’s carbon balance, where quick transactions happen. It can be grown quickly with good deposits (crop residues, roots, manure, cover crops) and protected by reducing withdrawals (intensive tillage, erosion, residue removal). Monitoring POXC gives farmers and advisers a practical way to evaluate soil management, make proactive adjustments, and sustain long-term productivity. By treating POXC as a regular “soil health check,” alongside other health indicators, soil texture, and nutrient tests, producers can gain insights into how well their soils are functioning and how they are responding to management.
References
AGVISE Laboratories. (2019, Spring). Soil health focus: Active carbon (POXC) [Newsletter]. AGVISE Laboratories, Northwood, ND.
Bongiorno, G., Bünemann, E. K., Oguejiofor, C. U., Meier, J., Gort, G., Comans, R., Mäder, P., Brussaard, L., & de Goede, R. G. M. (2019). Sensitivity of labile carbon fractions to tillage and organic matter management and their potential as comprehensive soil quality indicators across pedoclimatic conditions in Europe. Ecological Indicators, 99, 38–50.
Bowles, T. M., Acosta-Martínez, V., Calderón, F., & Jackson, L. E. (2014). Soil enzyme activities, microbial communities, and carbon and nitrogen availability in organic agroecosystems across an intensively-managed agricultural landscape. Soil Biology and Biochemistry, 68, 252–262.
Cleveland, C. C., & Liptzin, D. (2007). C:N:P stoichiometry in soil: Is there a “Redfield ratio” for the microbial biomass? Biogeochemistry, 85(3), 235–252.
Culman, S. W., Snapp, S. S., Freeman, M. A., Schipanski, M. E., Beniston, J., Lal, R., Drinkwater, L. E., Franzluebbers, A. J., Glover, J. D., Grandy, A. S., Lee, J., Six, J., Maul, J. E., Mirksy, S. B., Spargo, J. T., & Wander, M. M. (2012). Permanganate oxidizable carbon reflects a processed soil fraction that is sensitive to management. Soil Science Society of America Journal, 76(2), 494–504.
Culman, S. W., Snapp, S. S., Green, J. M., & Gentry, L. E. (2013). Short‐and long‐term labile soil carbon and nitrogen dynamics reflect management and predict corn agronomic performance. Agronomy Journal, 105(2), 493-502.
Dahal, S., Franklin, D. H., Subedi, A., Cabrera, M. L., Ney, L., Fatzinger, B., & Mahmud, K. (2021). Interrelationships of chemical, physical and biological soil health indicators in beef-pastures of Southern Piedmont, Georgia. Sustainability, 13(9), 4844.
Decker, H. L., Gamble, A. V., Balkcom, K. S., Johnson, A. M., & Hull, N. R. (2022). Cover crop monocultures and mixtures affect soil health indicators and crop yield in the southeast United States. Soil Science Society of America Journal, 86(5), 1312–1326.
Drinkwater, L. E., Cambardella, C. A., Reeder, J. D., & Rice, C. W. (1997). Potentially mineralizable nitrogen as an indicator of biologically active soil nitrogen. Methods for assessing soil quality, 49, 217-229.
Fine, A. K., van Es, H. M., & Schindelbeck, R. R. (2017). Statistics, scoring functions, and regional analysis of a comprehensive soil health database. Soil Science Society of America Journal, 81(3), 589–601.
Florence, A. M., & McGuire, A. M. (2020). Do diverse cover crop mixtures perform better than monocultures? A systematic review. Agronomy Journal, 112(5), 3513–3534.
Franzluebbers, A. J. (2018). Short-term C mineralization (aka the flush of CO₂) as an indicator of soil biological health. CAB Reviews, 13, 1–10.
Franzluebbers, A. J. (2020). Soil-test biological activity with the flush of CO₂: V. Validation of nitrogen prediction for corn production. Agronomy Journal, 112(5), 4172–4185.
Gregorich, E. G., Carter, M. R., Angers, D. A., Monreal, C. M., & Ellert, B. H. (1994). Towards a minimum data set to assess soil organic matter quality in agricultural soils. Canadian Journal of Soil Science, 74(4), 367–385.
Hamza, M. A., & Anderson, W. K. (2005). Soil compaction in cropping systems: A review of the nature, causes and possible solutions. Soil & Tillage Research, 82(2), 121–145.
Hok, L., de Moraes Sá, J. C., Reyes, M., Boulakia, S., Tivet, F., Leng, V., Kong, R., Briedis, C., da Cruz Hartman, D., Ferreira, L. A., Inagaki, T. M., Gonçalves, D. R. P., & Bressan, P. T. (2018). Enzymes and C pools as indicators of C build-up in short-term conservation agriculture in a savanna ecosystem in Cambodia. Soil & Tillage Research, 177, 125–133.
Hurisso, T. T., Culman, S. W., Horwath, W. R., Wade, J., Cass, D., Beniston, J. W., Bowles, T. M., Grandy, A. S., Franzluebbers, A. J., Schipanski, M. E., Lucas, S. T., & Ugarte, C. M. (2016). Comparison of permanganate-oxidizable carbon and mineralizable carbon for assessment of organic matter stabilization and mineralization. Soil Science Society of America Journal, 80(5), 1352–1364.
Joseph, S. (2015). Biochar for environmental management: science, technology and implementation. Routledge.
Jensen, J. L., Schjønning, P., Watts, C. W., Christensen, B. T., Obour, P. B., & Munkholm, L. J. (2020). Soil degradation and recovery–Changes in organic matter fractions and structural stability. Geoderma, 364, 114181.
Kong, A. Y. Y., Six, J., Bryant, D. C., Denison, R. F., & van Kessel, C. (2005). The relationship between carbon input, aggregation, and soil organic carbon stabilization in sustainable cropping systems. Soil Science Society of America Journal, 69(4), 1078–1085.
Lavallee, J. M., Soong, J. L., & Cotrufo, M. F. (2020). Conceptualizing soil organic matter into particulate and mineral-associated forms to address global change in the 21st century. Global Change Biology, 26(1), 261–273.
Lucas, S. T., & Weil, R. R. (2012). Can a labile carbon test be used to predict crop responses to improve soil organic matter management? Agronomy Journal, 104(4), 1160–1170.
Marriott, E. E., & Wander, M. M. (2006). Total and labile soil organic matter in organic and conventional farming systems. Soil Science Society of America Journal, 70(3), 950–959.
Martin, T., & Sprunger, C. D. (2022). Sensitive measures of soil health reveal carbon stability across a management intensity and plant biodiversity gradient. Frontiers in Soil Science, 2, 917885.
McDaniel, M. D., Tiemann, L. K., & Grandy, A. S. (2014). Does agricultural crop diversity enhance soil microbial biomass and organic matter dynamics? A meta-analysis. Ecological Applications, 24(3), 560–570.
McHugh, A. D., Tullberg, J. N., & Freebairn, D. M. (2009). Controlled traffic farming restores soil structure. Soil & Tillage Research, 104(1), 164–172.
Moebius-Clune, B. N. (2016). Comprehensive assessment of soil health: The Cornell framework manual. Cornell University.
Mooshammer, M., Wanek, W., Hämmerle, I., Fuchslueger, L., Hofhansl, F., Knoltsch, A., Schnecker, J., Takriti, M., Watzka, M., Wild, B., Keiblinger, K. M., Zechmeister-Boltenstern, S., & Richter, A. (2014). Adjustment of microbial nitrogen use efficiency to carbon:nitrogen imbalances regulates soil nitrogen cycling. Nature Communications, 5, 3694.
Morrow, J. G., Huggins, D. R., Carpenter-Boggs, L. A., Stockle, C. O., & Reganold, J. P. (2016). Evaluating measures to assess soil health in long-term agroecosystem trials. Soil Science Society of America Journal, 80(2), 450–462.
Olson, K. R., Lang, J. M., & Ebelhar, S. A. (2005). Soil organic carbon changes after 12 years of no-tillage and tillage of Grantsburg soils in southern Illinois. Soil & Tillage Research, 81(2), 217–225.
Sanderman, J., & Baldock, J. A. (2010). Accounting for soil carbon sequestration in national inventories: A soil scientist’s perspective. Environmental Research Letters, 5(3), 034003.
Singh, G., Schoonover, J. E., Williard, K. W., Kaur, G., & Crim, J. (2018). Carbon and nitrogen pools in deep soil horizons at different landscape positions. Soil Science Society of America Journal, 82(6), 1512-1525.
Six, J., Elliott, E. T., & Paustian, K. (2000). Soil macroaggregate turnover and microaggregate formation: A mechanism for C sequestration under no-tillage agriculture. Soil Biology and Biochemistry, 32(14), 2099–2103.
Soil Health Institute (SHI). (2023). Soil health measurement framework for U.S. agriculture. Soil Health Institute.
Stott, D. E., Andrews, S. S., Liebig, M. A., Wienhold, B. J., & Karlen, D. L. (2010). Evaluation of β-glucosidase activity as a soil quality indicator for the soil management assessment framework. Soil Science Society of America Journal, 74(1), 107–119.
Svedin, J. D., Veum, K. S., Ransom, C. J., Kitchen, N. R., & Anderson, S. H. (2023). An identified agronomic interpretation for potassium permanganate oxidizable carbon. Soil Science Society of America Journal, 87(2), 291–308.
Thapa, B., & Mowrer, J. (2024). Soil carbon and aggregate stability are positively related and increased under combined soil amendment, tillage, and cover cropping practices. Soil Science Society of America Journal, 88(3), 730–744.
USDA-NRCS (Natural Resources Conservation Service). (2025). Soil Health Testing to Support Conservation Planning (Technical Note No. 470-16). U.S. Department of Agriculture.
Vance, E. D., Brookes, P. C., & Jenkinson, D. S. (1987). An extraction method for measuring soil microbial biomass C. Soil Biology and Biochemistry, 19(6), 703–707.
Veum, K. S., Zuber, S. M., Ransom, C. J., Myers, R. L., Kitchen, N. R., & Anderson, S. H. (2022). Reduced tillage and rotational diversity improve soil health in Missouri. Agronomy Journal, 114(5), 3027–3039.
Wander, M. M., & Drinkwater, L. E. (2000). Fostering soil stewardship through soil quality assessment. Applied Soil Ecology, 15(1), 61-73.
Wander, M. M., & Traina, S. J. (1996). Organic matter fractions from organically and conventionally managed soils: I. Carbon and nitrogen distribution. Soil Science Society of America Journal, 60(4), 1081–1087.
Weidhuner, A., Hanauer, A., Krausz, R., Crittenden, S., Gage, K., & Sadeghpour, A. (2021). Tillage impacts on soil aggregation and aggregate-associated carbon and nitrogen after 49 years. Soil & Tillage Research, 208, 104878.
Weil, R. R., Islam, K. R., Stine, M. A., Gruver, J. B., & Samson-Liebig, S. E. (2003). Estimating active carbon for soil quality assessment: A simplified method for laboratory and field use. American Journal of Alternative Agriculture, 18(1), 3–17.
White, K. E., Brennan, E. B., Cavigelli, M. A., & Smith, R. F. (2020). Winter cover crops increase readily decomposable soil carbon, but compost drives total soil carbon during eight years of intensive, organic vegetable production in California. PLOS ONE, 15(2), e0228677.
Wong, C. T. F., Falcone, M., Rich, G., Stubler, C., Malama, B., Lazcano, C., & Decock, C. (2023). Short-term effects of increasing compost application rates on soil C and greenhouse gas (N₂O and CO₂) emissions in a California central coast vineyard. Frontiers in Environmental Science, 11, 1123510.
Ye, R., Parajuli, B., Szogi, A. A., Sigua, G. C., & Ducey, T. F. (2021). Soil health assessment after 40 years of conservation and conventional tillage management in Southeastern Coastal Plain soils. Soil Science Society of America Journal, 85(4), 1214–1225.