Soil health is the foundation of productive, profitable, and sustainable farming systems. Unlike conventional soil fertility tests that primarily assess nutrient availability, soil health testing evaluates key physical, chemical, and biological properties that reflect the soil’s capacity to function as a living ecosystem. These properties influence a wide range of critical processes, including nutrient cycling, water retention, root development, and resilience to environmental stress. Understanding these physical, chemical, and biological dynamics is essential for improving nutrient use efficiency, optimizing crop yields, and maintaining the long-term productivity of a farming system. This is especially important for Missouri’s row crop production systems, where variable soil types, weather conditions, and management histories can significantly influence soil function.
This guide is designed to help Missouri farmers interpret the Soil Health Test Report provided by the University of Missouri – Soil Health Assessment Center (SHAC). It explains how to read and understand each soil health indicator, what the measured values mean in the context of Missouri soils, and how to apply the results to make informed management decisions. Whether you are new to soil health testing or looking to refine your management practices, this guide will support your efforts to build healthier, more resilient soils. A sample soil health test report is provided in Figure 1 and will be discussed in detail throughout the article.
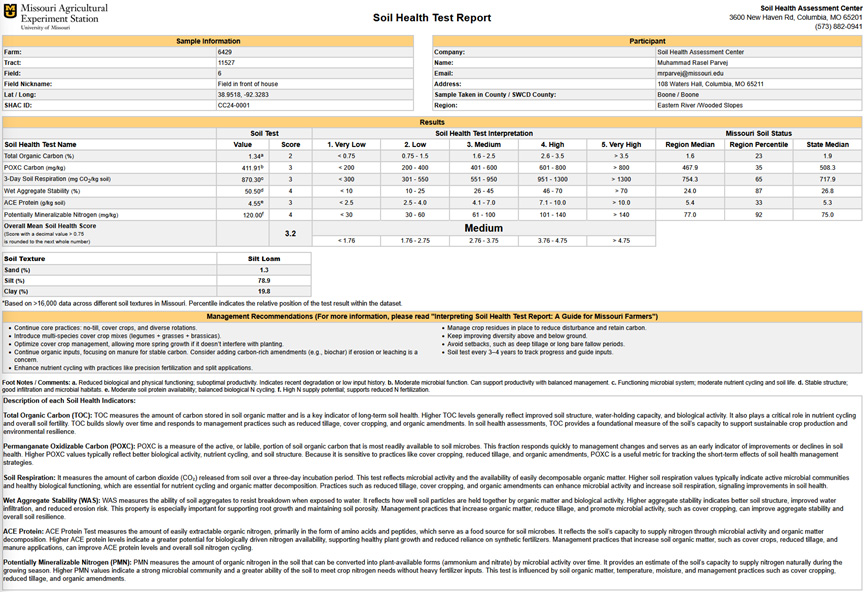
Sample overview
- Farm: 6429 | Field: 6 | Lat / Long: 38.9518, -92.3283
- Sample taken in county / SWDC county: Boone / Boone (Note: While the actual sampling county and Soil and Water Conservation District (SWCD) county are the same in this case, they may differ. For instance, a farmer may be registered with an SWCD in one county but collect samples from another.)
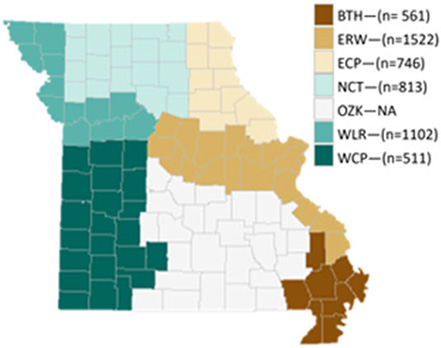
- Region: Eastern River / Wooded Slopes (Note: Missouri was divided into eight regions based on Zuber et al., 2020; see Figure 2.)
Soil health test name and interpretation
1. Total Organic Carbon (TOC): TOC measures the amount of carbon stored in soil organic matter and is a key indicator of long-term soil health. Higher TOC levels generally reflect improved soil structure, water-holding capacity, and biological activity. It also plays a critical role in nutrient cycling and overall soil fertility. TOC builds slowly over time and responds to management practices such as reduced tillage, cover cropping, and organic amendments. In soil health assessments, TOC provides a foundational measure of the soil’s capacity to support sustainable crop production and environmental resilience.
- Measured value (%): 1.34a
- Foot notes / comments: a. Reduced biological and physical functioning; suboptimal productivity. Indicates recent degradation or low input history. Refer to Table 1 for a detailed interpretation of all possible values.
- Score: 2 (Scale: 1 to 5; Very Low = 1; Low = 2, Medium = 3, High = 4, Very High = 5)
- Category: Low (Classification: Very Low <0.75; Low 0.75-1.5; Medium 1.6-2.5; High 2.6-3.5; and Very High >3.5)
- MO soil status:
- Region median: 1.6% | State median: 1.9%
The TOC value for this sample is 1.34%, which is lower than both the regional and state medians. These medians represent the typical TOC levels observed in the corresponding soil sampled region and across Missouri, based on thousands of soil health test results. - Region percentile: 23rd
This means this soil has more TOC than only 23% of soils in the regional dataset, while 77% of soils have higher TOC levels. (Refer to Table 1 for Missouri soil health percentiles)
- Region median: 1.6% | State median: 1.9%
2. Permanganate Oxidizable Carbon (POXC): POXC is a measure of the active portion of soil organic carbon that is most readily available to soil microbes. This fraction responds quickly to management changes and serves as an early indicator of improvements or declines in soil health. Higher POXC values typically reflect better biological activity, nutrient cycling, and soil structure. Because it is sensitive to practices like cover cropping, reduced tillage, and organic amendments, POXC is a useful metric for tracking the short-term effects of soil health management strategies.
- Measured value (mg/kg or ppm): 411.91b
- Foot notes / comments: b. Moderate microbial function. Can support productivity with balanced management. Refer to Table 1 for a detailed interpretation of all possible values.
- Score: 3 (Scale: 1 to 5; Very Low = 1; Low = 2, Medium = 3, High = 4, Very High = 5)
- Category: Medium (Classification: Very Low <200; Low 200-400; Medium 401-600; High 601-800; and Very High >800)
- MO soil status:
- Region median: 467.9 mg/kg | State median: 508.3 mg/kg
The POXC value for this sample is 411.91 mg/kg, which is lower than both the regional and state medians. These medians represent the typical POXC levels observed in the corresponding soil sampled region and across Missouri, based on thousands of soil health test results. - Region percentile: 35th
This means this soil has more POXC than only 35% of soils in the regional dataset, while 65% of soils have higher POXC levels. (Refer to Table 1 for Missouri soil health percentiles)
- Region median: 467.9 mg/kg | State median: 508.3 mg/kg
3. Soil respiration: It measures the amount of carbon dioxide (CO₂) released from soil over a three-day incubation period. This test reflects microbial activity and the availability of easily decomposable organic matter. Higher soil respiration values typically indicate active microbial communities and healthy biological functioning, which are essential for nutrient cycling and organic matter decomposition. Practices such as reduced tillage, cover cropping, and organic amendments can enhance microbial activity and increase soil respiration, signaling improvements in soil health.
- Measured value (mg CO2/kg soil): 870.30C
- Foot notes / comments: c. Functioning microbial system; moderate nutrient cycling and soil life. Refer to Table 1 for a detailed interpretation of all possible values.
- Score: 3 (Scale: 1 to 5; Very Low = 1; Low = 2, Medium = 3, High = 4, Very High = 5)
- Category: Medium (Classification: Very Low <300; Low 301-550; Medium 551-950; High 951-1300; and Very High >1300)
- MO soil status:
- Region median: 754.3 mg CO2/kg soil | State median: 717.9 mg CO2/kg soil
The soil respiration value for this sample is 870.30 mg CO2/kg soil, which is higher than both the regional and state medians. These medians represent the typical soil respiration levels observed in the corresponding soil sampled region and across Missouri, based on thousands of soil health test results. - Region percentile: 65th
This means this soil has higher microbial respiration than 65% of soils in the regional dataset, while only 35% of soils have higher soil respiration levels. (Refer to Table 1 for Missouri soil health percentiles)
- Region median: 754.3 mg CO2/kg soil | State median: 717.9 mg CO2/kg soil
4. Wet Aggregate Stability (WAS): WAS measures the ability of soil aggregates to resist breakdown when exposed to water. It reflects how well soil particles are held together by organic matter and biological activity. Higher aggregate stability indicates better soil structure, improved water infiltration, and reduced erosion risk. This property is especially important for supporting root growth and maintaining soil porosity. Management practices that increase organic matter, reduce tillage, and promote microbial activity, such as cover cropping, can improve aggregate stability and overall soil resilience.
- Measured value (%): 50.50d
- Foot notes / comments: d. Stable structure; good infiltration and microbial habitats. Refer to Table 1 for a detailed interpretation of all possible values.
- Score: 4 (Scale: 1 to 5; Very Low = 1; Low = 2, Medium = 3, High = 4, Very High = 5) • Category: High (Classification: Very Low <10; Low 10-25; Medium 26-45; High 46-70; and Very High >70)
- MO soil status:
- Region median: 24.0% | State median: 26.8%
The WAS value for this sample is 50.50%, which is higher than both the regional and state medians. These medians represent the typical WAS levels observed in the corresponding soil sampled region and across Missouri, based on thousands of soil health test results.) - Region percentile: 87th
This means this soil has more WAS than 87% of soils in the regional dataset, while only 13% of soils have higher WAS levels. (Refer to Table 1 for Missouri soil health percentiles)
- Region median: 24.0% | State median: 26.8%
5. ACE Protein: ACE Protein Test measures the amount of easily extractable organic nitrogen, primarily in the form of amino acids and peptides, which serve as a food source for soil microbes. It reflects the soil’s capacity to supply nitrogen through microbial activity and organic matter decomposition. Higher ACE protein levels indicate a greater potential for biologically driven nitrogen availability, supporting healthy plant growth and reduced reliance on synthetic fertilizers. Management practices that increase soil organic matter, such as cover crops, reduced tillage, and manure applications, can improve ACE protein levels and overall soil nitrogen cycling.
- Measured value (g/kg soil): 4.55e
- Foot notes / comments: e. Moderate soil protein availability; balanced biological N cycling. Refer to Table 1 for a detailed interpretation of all possible values.
- Score: 3 (Scale: 1 to 5; Very Low = 1; Low = 2, Medium = 3, High = 4, Very High = 5)
- Category: Medium (Classification: Very Low <2.5; Low 2.5-4.0; Medium 4.1-7.0; High 7.1-10.0; and Very High >10.0)
- MO soil status:
- Region median: 5.4 g/kg | State median: 5.3 g/kg
The ACE protein value for this sample is 4.55 g/kg, which is lower than both the regional and state medians. These medians represent the typical ACE protein levels observed in the corresponding soil sampled region and across Missouri, based on thousands of soil health test results. - Region percentile: 33rd
This means this soil has more ACE protein than only 33% of soils in the regional dataset, while 67% of soils have higher ACE protein levels. (Refer to Table 1 for Missouri soil health percentiles)
- Region median: 5.4 g/kg | State median: 5.3 g/kg
6. Potentially Mineralizable Nitrogen (PMN): PMN measures the amount of organic nitrogen in the soil that can be converted into plant-available forms (ammonium and nitrate) by microbial activity over time. It provides an estimate of the soil’s capacity to supply nitrogen naturally during the growing season. Higher PMN values indicate a strong microbial community and a greater ability of the soil to meet crop nitrogen needs without heavy fertilizer inputs. This test is influenced by soil organic matter, temperature, moisture, and management practices such as cover cropping, reduced tillage, and organic amendments.
- Measured value (mg/kg or ppm): 120.00f
- Foot notes/comments: f. High N supply potential; supports reduced N fertilization. Refer to Table 1 for a detailed interpretation of all possible values.
- Score: 4 (Scale: 1 to 5; Very Low = 1; Low = 2, Medium = 3, High = 4, Very High = 5)
- Category: High (Classification: Very Low <30; Low 30-60; Medium 61-100; High 101-140; and Very High >140)
- MO soil status:
- Region median: 77.0 mg/kg | State median: 75.0 mg/kg
The PMN value for this sample is 120.00 mg/kg, which is higher than both the regional and state medians. These medians represent the typical PMN levels observed in the corresponding soil sampled region and across Missouri, based on thousands of soil health test results. - Region percentile: 92nd
This means this soil has more PMN levels than 92% of soils in the regional dataset, and only 8% of soils have higher PMN levels. (Refer to Table 1 for Missouri soil health percentiles)
- Region median: 77.0 mg/kg | State median: 75.0 mg/kg
Overall soil health score: 3.2 – Medium
Very Low <1.76; Low 1.76-2.75; Medium 2.76-3.75; High 3.76-4.75; and >4.75. Overall mean soil health score with a decimal value >0.75 is rounded to the next whole number (e.g., a score of 1.8 is rounded to 2.0).
This score reflects the average of the six indicators above. A medium rating indicates that your soil is biologically functional but could benefit from improvements to support long-term productivity and resilience. The goal should be to increase the soil’s biological function and organic matter content to reach a high or very high category over time.
Table 1. Summary of six soil health indicator interpretation ranges, soil health status/implication, and percentile of Missouri (MO) soils under five different soil health categories.
| Soil Health Category | Health Test Ranges | Soil Health Status/Implication | MO Soil* Percentile |
|---|---|---|---|
| Total Organic Carbon (%) | |||
| 1. Very Low | < 0.75 | Severely depleted soil organic matter; limited nutrient retention, microbial life, and structure. High risk of erosion and compaction. Requires major restoration | 0-5 |
| 2. Low | 0.75 – 1.5 | Reduced biological and physical functioning; suboptimal productivity. Indicates recent degradation or low input history. | 6-25 |
| 3. Medium | 1.6 – 2.5 | Adequate carbon level for moderate productivity. Needs improvement for long-term sustainability. | 26-80 |
| 4. High | 2.6 – 3.5 | Well-structured, fertile, and biologically active soil. Supports resilient cropping systems. | 81-95 |
| 5. Very High | > 3.5 | Exceptional soil quality; may support ecosystem services beyond crop production (e.g., carbon sequestration); high microbial and nutrient potential. | 96-100 |
| Permanganate Oxidizable Carbon (POXC) (mg C kg-1 or ppm) | |||
| 1. Very Low | < 200 | Poor biological activity; depleted microbial food base. Often compacted or over-tilled soils, low fertility. | 0-5 |
| 2. Low | 200 – 400 | Microbial activity and nutrient cycling are limited. Needs organic inputs and cover crops. | 6-25 |
| 3. Medium | 401 – 600 | Moderate microbial function. Can support productivity with balanced management. | 26-80 |
| 4. High | 601 – 800 | High biological activity and potential nutrient turnover. Indicates active soil management. | 81-95 |
| 5. Very High | > 800 | Very active microbial system; strong indication of biological soil health and carbon inputs. | 96-100 |
| 3-Day Soil Respiration (mg CO2 kg soil-1 3-day-1) | |||
| 1. Very Low | < 300 | Microbial dormancy; indicates biological inactivity, possible compaction or low organic matter. | 0-5 |
| 2. Low | 300 – 550 | Limited microbial turnover; may indicate stress or need for organic inputs. | 6-25 |
| 3. Medium | 551 – 950 | Functioning microbial system; moderate nutrient cycling and soil life. | 26-80 |
| 4. High | 951 – 1300 | High biological activity and good organic matter decomposition. | 81-95 |
| 5. Very High | > 1300 | Very active system; excellent biological health but must be balanced to avoid rapid soil organic matter depletion. | 96-100 |
| Wet Aggregate Stability (%) | |||
| 1. Very Low | < 10 | Very unstable soil structure; high erosion risk and poor water retention. | 0-15 |
| 2. Low | 10 – 25 | Weak structure; likely surface crusting and low porosity. | 16-50 |
| 3. Medium | 26 – 45 | Moderately structured; can support crops but sensitive to disturbance. | 51-75 |
| 4. High | 46 – 70 | Stable structure; good infiltration and microbial habitats. | 76-95 |
| 5. Very High | > 70 | Excellent aggregation; supports soil aeration, root growth, and resilience to stress. | 96-100 |
| Autoclaved Citrate-Extractable (ACE) Soil Protein (g kg-1) | |||
| 1. Very Low | < 2.5 | Poor soil N mineralization potential; microbial biomass limited. | 0-5 |
| 2. Low | 2.5 – 4.0 | Low microbial nutrient access; needs OM input and less disturbance. | 6-25 |
| 3. Medium | 4.1 – 7.0 | Moderate soil protein availability; balanced biological N cycling. | 26-80 |
| 4. High | 7.1 – 10.0 | Good protein and nutrient cycling potential; resilient system. | 81-95 |
| 5. Very High | > 10.0 | High N mineralization and biological activity. May support N credits in management. | 96-100 |
| Potentially Mineralizable Nitrogen (mg N kg-1 or ppm) | |||
| 1. Very Low | < 30 | Very low N availability; likely N deficiency unless supplemented. | 0-5 |
| 2. Low | 30 – 60 | Suboptimal N cycling; reliance on synthetic N expected. | 6-25 |
| 3. Medium | 61 – 100 | Moderate potential for organic N release; supports partial N supply. | 26-80 |
| 4. High | 101 – 140 | High N supply potential; supports reduced N fertilization. | 81-95 |
| 5. Very High | > 140 | Excellent N mineralization; may allow crediting N in recommendations. | 96-100 |
| *Based on over 13,000 cover crop cost-share data across different soil textures in Missouri. | |||
Soil texture analysis
Soil texture analysis determines the relative proportions of sand, silt, and clay in a soil sample, allowing it to be classified into a specific textural class. This classification influences key soil properties such as water holding capacity, drainage, nutrient retention, and root penetration. Understanding soil texture is critical for making informed decisions about crop selection, irrigation management, tillage practices, and nutrient applications.
Because soil texture is a physical property that changes very slowly, over decades or centuries under natural conditions, it is typically measured only once per location. For this reason, follow-up soil health samples do not include texture analysis, as it is assumed to remain constant.
Particle size analysis: Sand: 1.3%; Silt: 78.9%; Clay: 19.8% (See Figure 1)
Textural class: Based on particle size analysis, this soil falls into the Silt Loam textural class.
Management recommendations
1. Very Low soil health (overall score <1.76)
- Adopt no-till immediately to reduce erosion and preserve remaining topsoil.
- Use cover crops intensively, ideally every year, with diverse species mixes to build organic matter and provide winter protection.
- Apply high rates of manure, if nutrient tests indicate a need, to jump-start biological activity.
- Diversify rotations with legumes and deep-rooted crops to improve aggregation and nitrogen cycling, avoiding monoculture systems.
- Avoid bare fallow — maintain soil cover year-round.
- Be patient, improvements may take several years, but erosion control and soil cover offer immediate benefits.
2. Low soil health (overall score 1.76 – 2.75)
- Maintain no-till and cover cropping; positive trends are beginning, but more improvement is needed.
- Maximize living roots year-round to enhance soil biology and structure.
- Ensure adequate fertility for both cover crops and cash crops to support biomass production.
- Diversify rotations with legumes and deep-rooted crops to improve aggregation and nitrogen cycling, avoiding monoculture systems.
- Incorporate organic amendments, like manure, to build soil carbon and nutrients.
- Minimize compaction via controlled traffic and cover crop roots.
- Avoid bare fallow — maintain soil cover year-round.
- Soil test every 3-4 years to track progress and guide inputs.
3. Medium soil health (overall score 2.76 – 3.75)
- Continue core practices: no-till, cover crops, and diverse rotations.
- Introduce multi-species cover crop mixes (legumes + grasses + brassicas).
- Optimize cover crop management, allowing more spring growth if it doesn’t interfere with planting.
- Continue organic inputs, focusing on manure for stable carbon. Consider adding carbon-rich amendments (e.g., biochar) if erosion or leaching is a concern.
- Enhance nutrient cycling with practices like precision fertilization and split applications.
- Manage crop residues in place to reduce disturbance and retain carbon.
- Keep improving diversity above and below ground.
- Avoid setbacks, such as deep tillage or long bare fallow periods.
- Soil test every 3-4 years to track progress and guide inputs.
4. High soil health (overall score 3.76 – 4.75)
- Maintain current practices, no-till, cover crops, with continued diversity and minimal disturbance to preserve soil function.
- Select cover crops strategically (e.g., legumes for nitrogen, grasses for carbon) to support biological processes.
- Monitor nutrient levels, higher organic matter may support nutrient supply but also increases removal from high yields.
- Fine-tune nutrient management using soil health data (e.g., credit more nitrogen if respiration, ACE protein, and PMN are high). Avoid over-application of synthetic nitrogen to maintain microbial balance.
- Monitor long-term trends and weather-induced variability.
- Trial innovative practices like companion cropping or biological amendments to further optimize.
- Begin to document carbon sequestration gains if considering carbon markets.
- Use flexible practices cautiously, allowing only occasional intensive tillage when absolutely necessary for weed and pest management.
- Stay proactive to maintain gains; soil can decline quickly without consistent management.
5. Very High soil health (overall score >4.75)
- Continue all core soil health practices; these fields are high-performing assets.
- Explore innovative practices like precision nutrient management, interseeding cover crops, or livestock integration.
- Prevent degradation: watch for overuse of inputs, overgrazing, or tillage creep.
- Monitor soil health metrics regularly (e.g., aggregate stability, microbial activity) to ensure continued success.
- Educate and share: These soils could serve as benchmarks or demonstration plots.
- Experiment carefully with new practices, documenting impacts.
- Consider ecosystem service monetization (e.g., carbon credits, water quality credits).
- Avoid complacency; high-functioning soils can degrade rapidly with mismanagement.
- Protect long-term productivity by treating these fields as models of conservation and resilience.
References
Zuber, S. M., Veum, K. S., Myers, R. L., Kitchen, N. R., & Anderson, S. H. (2020). Role of inherent soil characteristics in assessing soil health across Missouri. Agricultural & Environmental Letters, 5, e20021.