Annual Reports
Our goal is to share trial details, summary of trials across years and trial reports for individual trials after we have at least two years of data.
On-going Trial Reports
- Soybean R3 Fungicide Comparisons (2018 to present)
- Planting Soybean into the Green (2016-2023) (PDF)
- Cover Crop Comparison
- Nitrogen Response
- Cost/Benefit of nitrogen fertilizer strip trials (PDF)
- Corn Nitrogen Response: Plus/Minus strip trial summary: 2016-2023 (PDF)
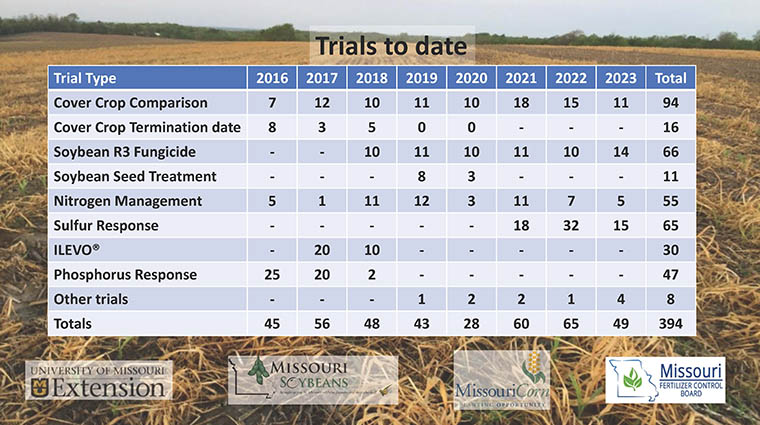
Completed Trials
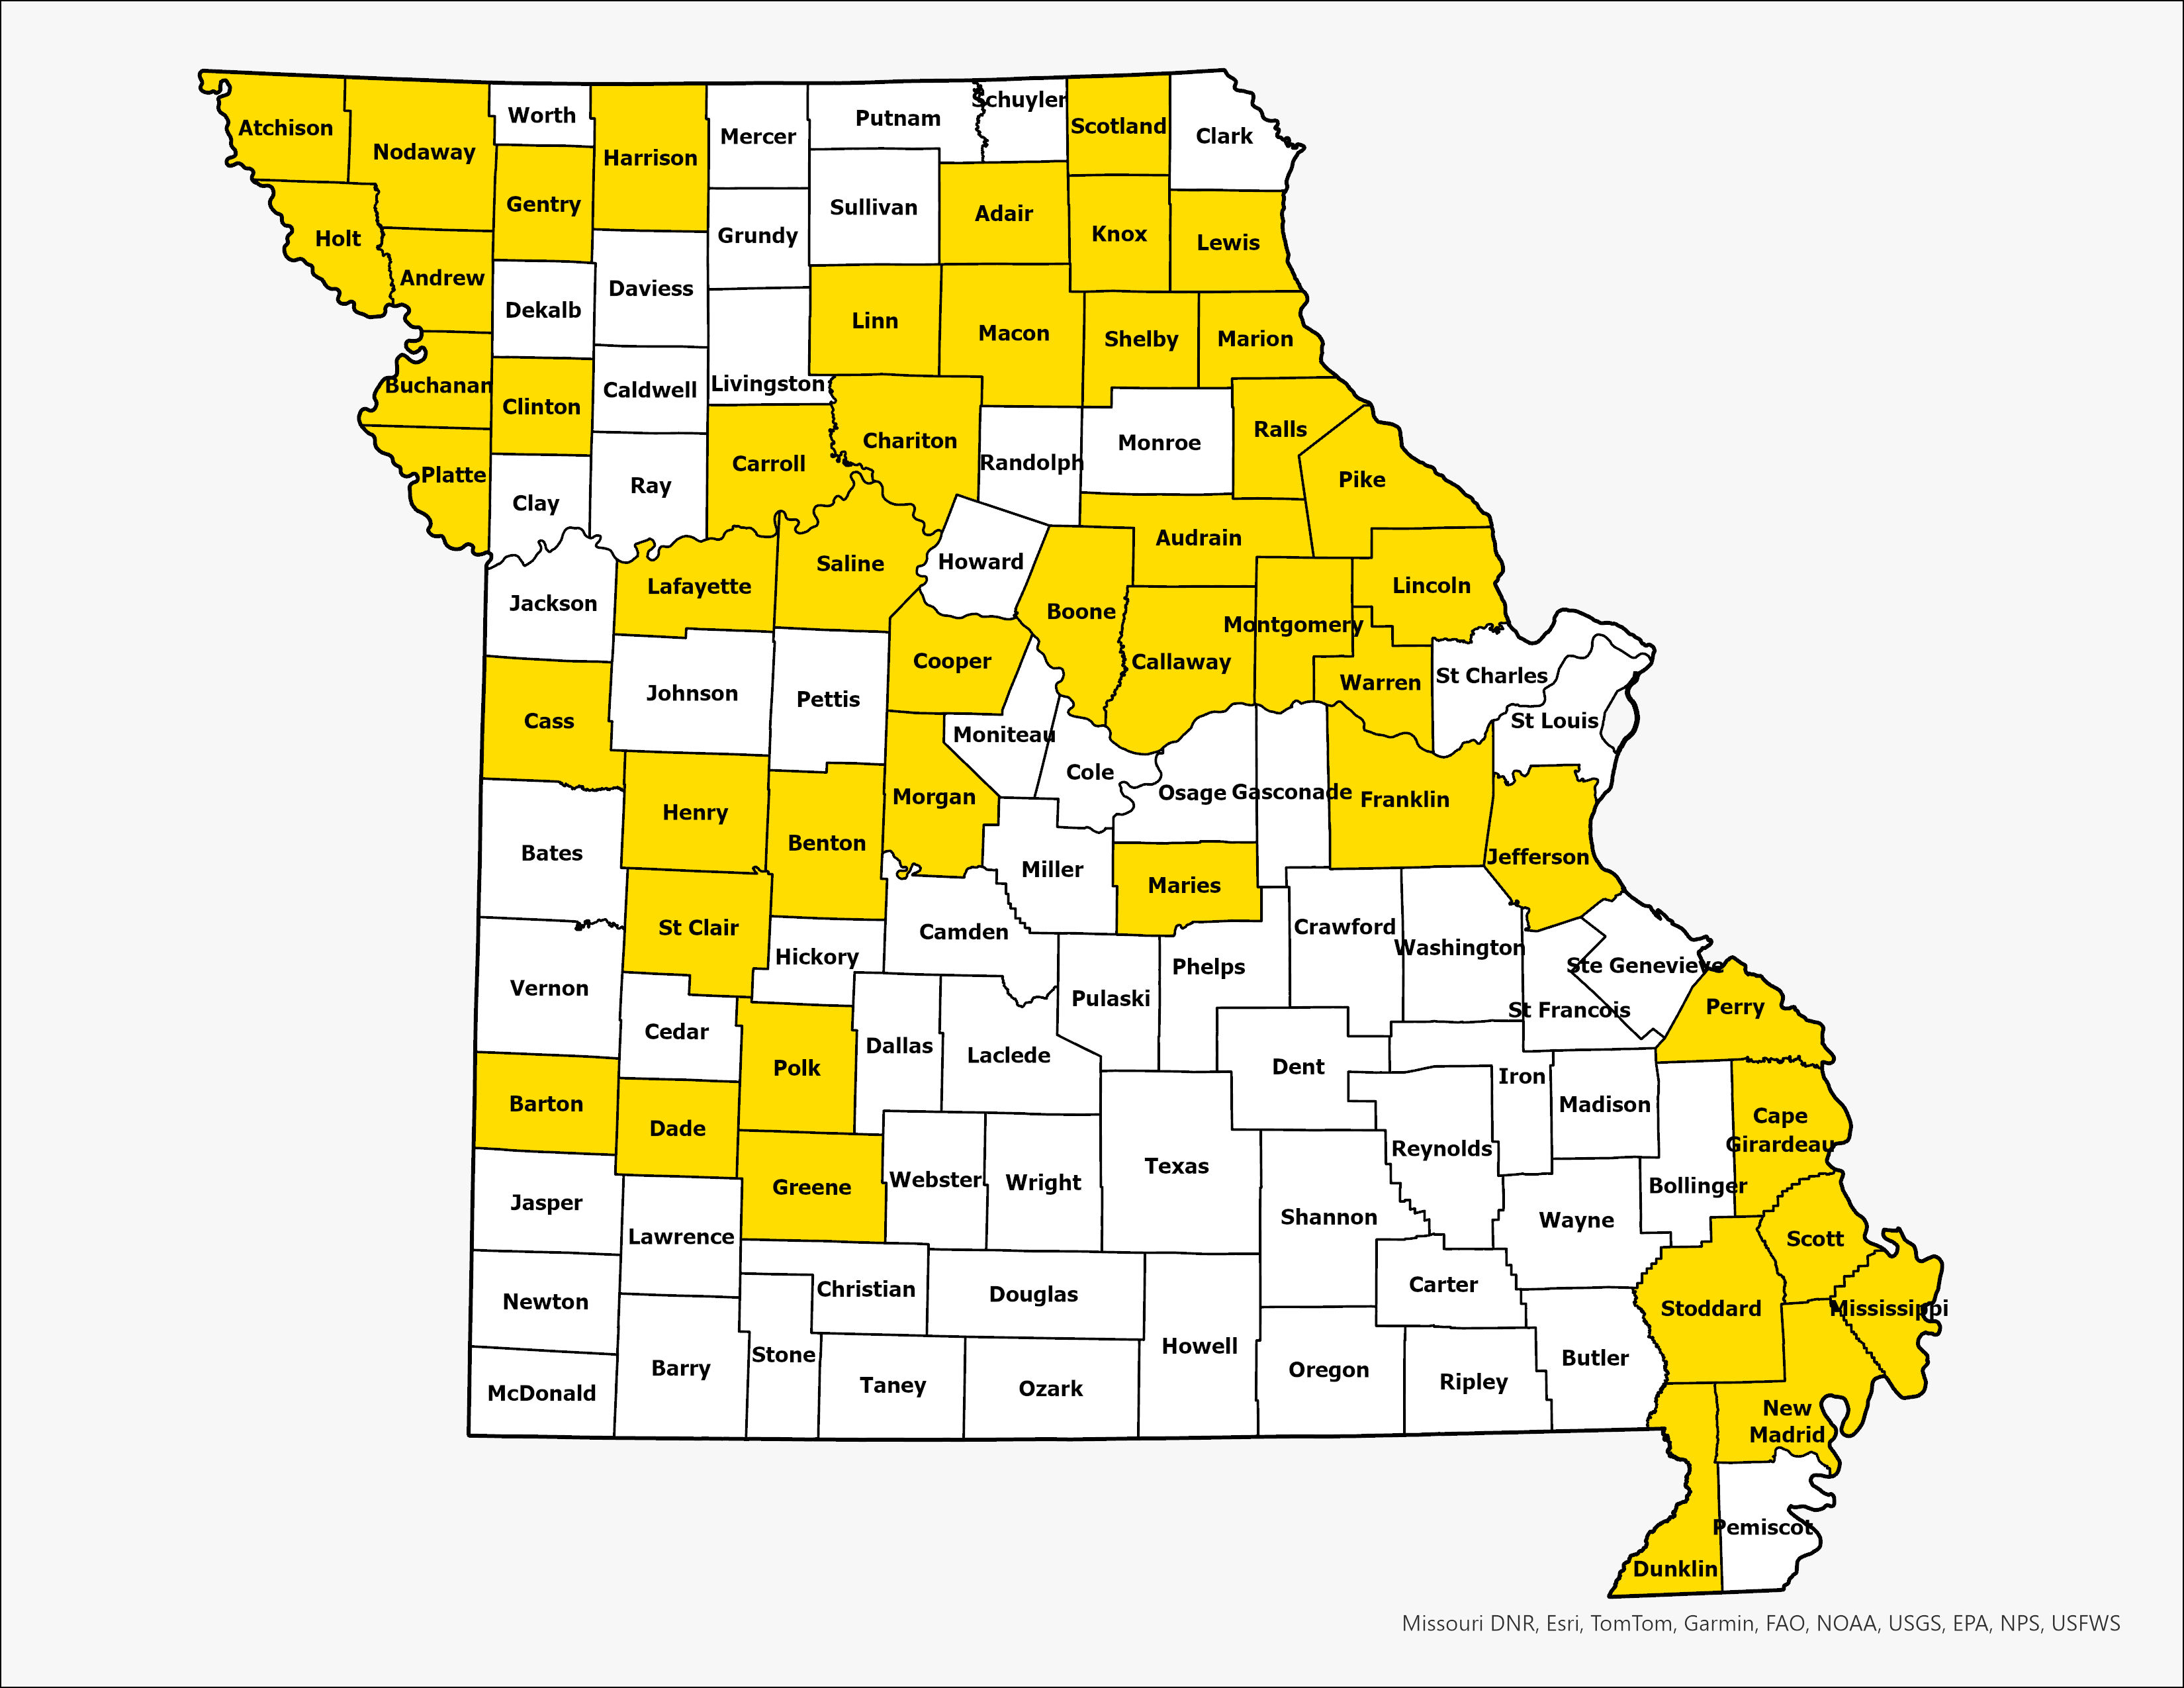
Locations of trials
On-farm strip trials have been conducted in nearly half of Missouri counties.
Types of trials