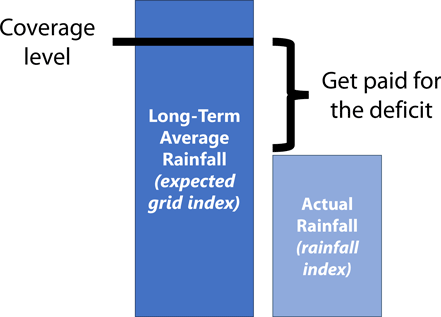
Forage and livestock producers can buy insurance to mitigate forage production risk due to lack of precipitation. Pasture, rangeland, forage (PRF) insurance was developed by the U.S. Department of Agriculture (USDA) Risk Management Agency (RMA). PRF insurance is based on a rainfall index and provides coverage when the precipitation in an area declines from its long-term, historical norm (Figure 1). The deadline to enroll for this insurance is December 1 before the calendar year being covered.
How PRF insurance works
Producers choose at least two 2-month periods when precipitation is important for their operation. For the selected periods, the rainfall index, which reflects an estimate of observed rainfall, is compared to the long-term precipitation (also called the expected grid index, and reflects 100% coverage). An indemnity is paid when the rainfall index falls below a coverage level — the trigger grid index.
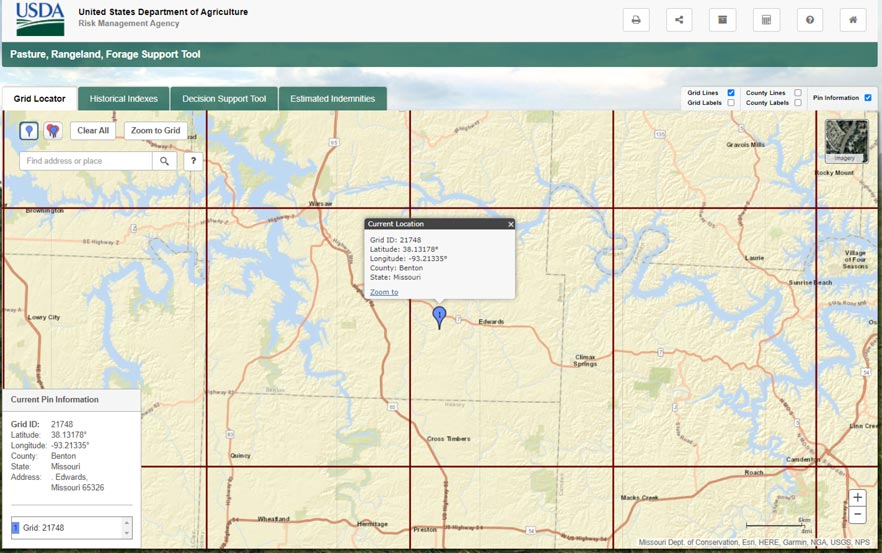
A relevant characteristic of PRF is that precipitation data is not based on individual farm or weather station records but is rather interpolated from data collected across multiple weather stations. Data is sourced from the National Oceanic and Atmospheric Administration Climate Prediction Center that is specific to grid locations. Each grid area is 0.25 degrees in latitude by 0.25 degrees in longitude (approximately 17 miles by 13 miles in Missouri). The grids do not follow state, county, or other geopolitical boundaries.
Producer choices
Various coverage options are accessible to ensure protection for a farm. Producers should select among 8 aspects detailed below. Premiums will vary by the selections made by the producer.
Intended use
A producer can have more than one PRF insurance policy, but each policy must select only one intended use, which can be either grazing or haying purposes. For example, for the same farm, a producer can have 50 acres in one field for grazing and another field of 50 acres for haying. Each intended use has its own base county value. Table 1 shows the range of county base values in Missouri for 2024. The RMA assigns each grid area a base dollar value per acre, which is defined by:
- Grazing: accounting for the costs of alternative feeds when forage is unavailable.
- Hay (non-irrigated, certified organic or not): incorporating hay yield and price data for individual counties.
- Hay (irrigated): reflecting the cost of additional irrigation needed due to lack of precipitation.
Table 1. Missouri county base values by use in 2024.
| Intended use | Low | High | Average |
|---|---|---|---|
| Grazing | $37 | $63 | $50 |
| Non-irrigated haying | $148 | $281 | $219 |
| Irrigated haying | $62 | $91 | $76 |
| Certified organic haying (non-irrigated) | $178 | $338 | $263 |
| Source: USDA Risk Management Agency | |||
Coverage level
Coverage levels range from 70 to 90 percent. The coverage level establishes the trigger rainfall index, therefore determining when insurance pays an indemnity. The government subsidizes different coverage levels at different rates. The government will pay 51 percent of the total premium at the 90 percent coverage level, 55 percent for 80 and 85 percent coverage, and 59 percent for the 70 and 75 percent coverage levels.
Productivity factor
The productivity factor allows producers to customize their PRF insurance policy based on the specific productivity of their land. Producers may select a productivity factor between 60 and 150 percent and this will adjust the county base value per acre accordingly. For example, if a farmer feels that a heavily fertilized hay crop needs more protection than the original county base level, then that farmer would select a productivity factor greater than 100 percent to increase the level of protection.
Index intervals
Index intervals
- January and February
- February and March
- March and April
- April and May
- May and June
- June and July
- July and August
- August and September
- September and October
- October and November
- November and December
Figure 2. Producers must choose coverage in at least two of these two-month intervals that do not overlap.
Producers choose coverage in two-month intervals (Figure 2). Factors to consider when determining which intervals to cover include the type of forage or crop, the intended use and the time period when precipitation is needed under normal conditions for the insured crop. Producers must allocate the percent of value across the chosen intervals to equal 100 percent. A minimum of two separate and non-overlapping intervals must be selected. A minimum of 10 percent and maximum of 60 percent of the coverage may be attributed to any one interval.
Grid location
A farm’s grid identification is based on a point of reference selected by the producer. The point of reference must be within the boundaries of the acreage to be insured. RMA’s website provides a grid locator tool for identifying your land, establishing a point of reference and determining the grid identification (Figure 3). Multiple points of reference may be needed if acreage is noncontiguous or overlays into multiple grids, or if the intended use — haying or grazing — is different for part of the acreage. A producer may choose multiple points of reference within the insured acreage that are in different grids and have different base values and historical precipitation amounts.
Indemnity payments
An indemnity is paid when the interpolated precipitation is less than the trigger grid index, which is the specified percentage of the rainfall index. The trigger grid index is determined by the level of coverage selected (70 to 90 percent). For example, if a farmer selected 90 percent coverage, then the final grid index must be below 90 for that two-month interval to trigger an indemnity payment. Actual indemnity payments are proportional to the deviation of the rainfall index from the trigger index. For example, if the rainfall index is 50% of the trigger index for a given index interval, the indemnity will be equal to 50% of the policy protection for that period. Because this insurance does not measure, capture or use any actual crop production, a producer could experience a loss of production and not receive an indemnity payment, or could receive a payment without suffering an actual loss of production.
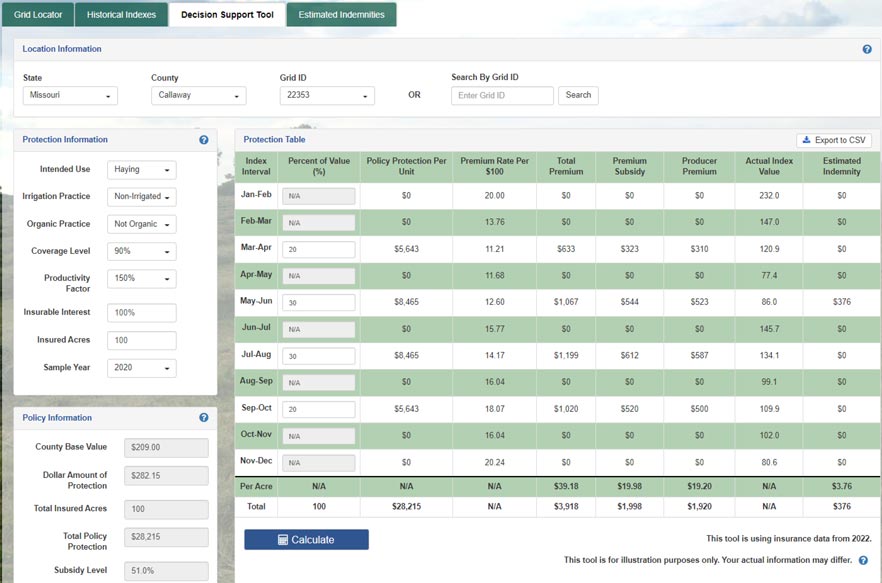
Decision support tools
A decision support tool is available to look at historical PRF policy information (Figure 4). Producers can select a grid location, enter their coverage and view the protection level, premiums, subsidies, index value and indemnities would have been for any historical year. Entering policy selections into this tool is a great way to analyze PRF and how it would have performed in past years. Another decision tool developed by Utah State University has a user friendly layout and is also available for PRF analysis.
Haying example
A producer located in Livingston County, Missouri, has a high-quality hay crop. The field had a grid location number of 23846. The intended use of the land was non-irrigated and non-organic hay production, and the producer elected the 90 percent coverage level and 150 percent productivity factor for this land. The producer opted to use the March–April and May–June index intervals at 50 percent and 50 percent, respectively.
Table 2 indicates what the results of this scenario would have been in 2023 — a major drought year. Each index interval resulted in indemnities as they were below the trigger grid index of 90. The producer would have paid premiums of $23.82 per acre and received indemnity payments of $144.69 per acre.
Table 2. PRF insurance, haying example, per acre.
| Index interval | Percent of value | Producer premium | Index value | Indemnity per acre |
|---|---|---|---|---|
| March–April | 50 | $11.81 | 71.8 | $36.17 |
| May–June | 50 | $12.01 | 35.4 | $108.52 |
| Total | 100 | $23.82 | NA | $144.69 |
Grazing example
The same producer located in Livingston County, Missouri, grid location number 23846, insured grazing pasture. The producer elected the 90 percent coverage level and 150 percent productivity factor for this land.
The producer opted to use the March–April and May–June intervals at 50 percent and 50 percent, respectively. Table 3 indicates what the results of this scenario would have been in 2023. The producer would have paid premiums of $5.36 per acre and received indemnity payments of $32.55 per acre.
Table 3. PRF insurance, grazing example, per acre.
| Index interval | Percent of value | Producer premium per acre | Index value | Indemnity per acre |
|---|---|---|---|---|
| March–April | 50 | $2.66 | 71.8 | $8.14 |
| May–June | 50 | $2.70 | 35.4 | $24.41 |
| Total | 100 | $5.36 | NA | $32.55 |
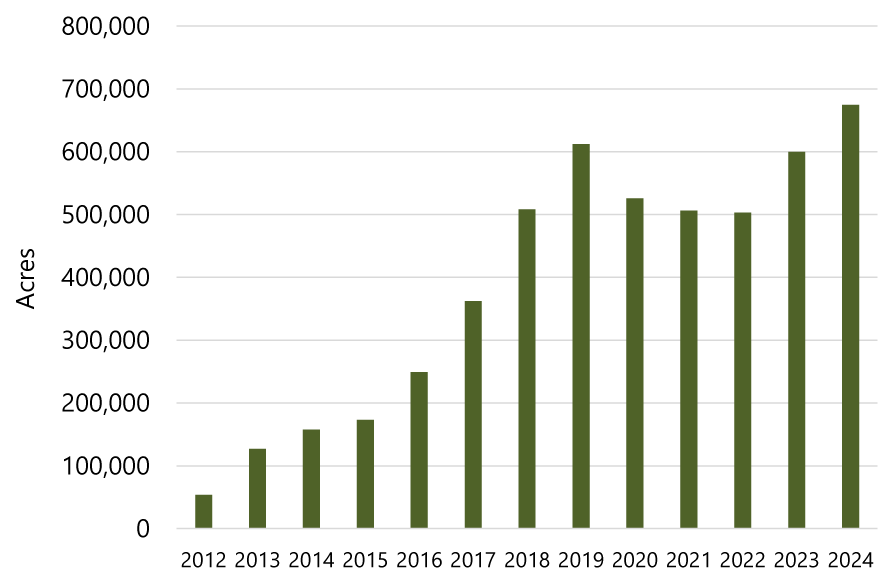
History of PRF insurance in Missouri
Missouri is a significant forage-production state. In Missouri, about 6.9 million acres are in permanent pasture and 3.1 million acres of hay are harvested annually. Historical use of PRF insurance in Missouri can be found in Figure 5 from USDA RMA.
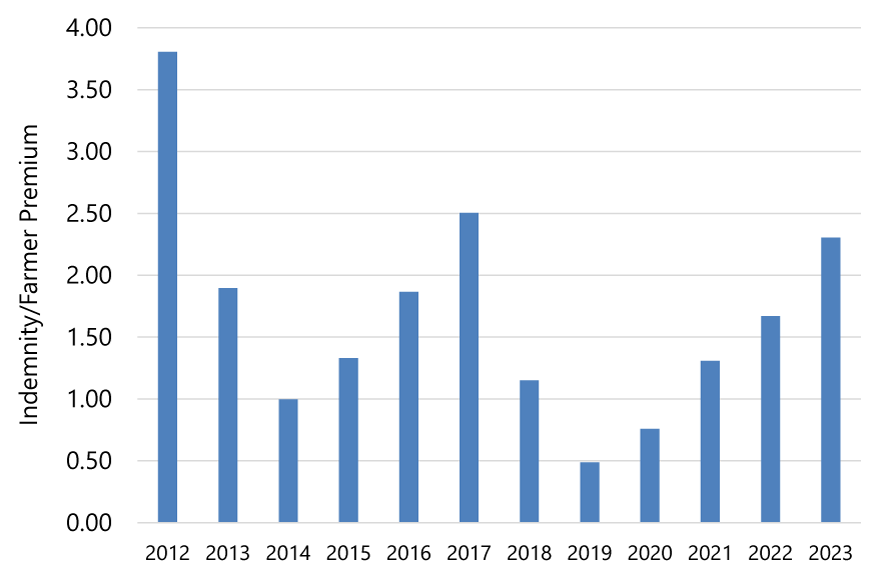
A farmer premium loss ratio can be defined as the indemnities that were paid out to farmers divided by the actual premiums paid by farmers. To show past levels of PRF insurance payments to Missouri farmers, Figure 6 identifies the Missouri farmer premium loss ratio for the years 2012 to 2023. In 2023, PRF insurance resulted in a farmer premium loss ratio of 2.3. This means a farmer premium of $1.00 resulted in $2.30 in indemnities when averaged across the state. Over the last 12 years, Missouri farmers received an average of $1.67 in indemnities for every $1.00 spent in premiums, which explains the increasing acreage covered by PRF insurance over the last 12 years.
For more information
For more information about this insurance plan, contact a crop insurance agent. Crop insurance agents are the best sources of information about these policies and can help you understand how the policies could be customized for your farm.