Editor’s note
For historical information, view opinion survey archives from previous years. Learn more about how we collect data by viewing our survey questionnaire.
In Missouri, land sale prices are not required to be reported to any government or public agency. In turn, it is challenging to understand current values and forward-looking projections for the state’s farmland market. This report summarizes results from a web-based survey conducted by the University of Missouri Extension Agricultural Business and Policy group, which aims to lend insight into perceived changes in farmland values across Missouri. This information supplements state-level estimates published by the U.S. Department of Agriculture (USDA) National Agricultural Statistics Service (NASS).
The most recent survey was conducted between March 2025 and May 2025 and collected 417 responses. Landowners accounted for 37% of responses, lenders 13%, farm managers 9%, government employees 6%, appraisers 3% and individuals with other occupations 32%. Based on their knowledge of land transactions in the past year, each respondent could report land values for up to three counties; land types include cropland, pastureland, timberland and hunting/recreation land. In total, the survey captured 2,072 land-value observations.
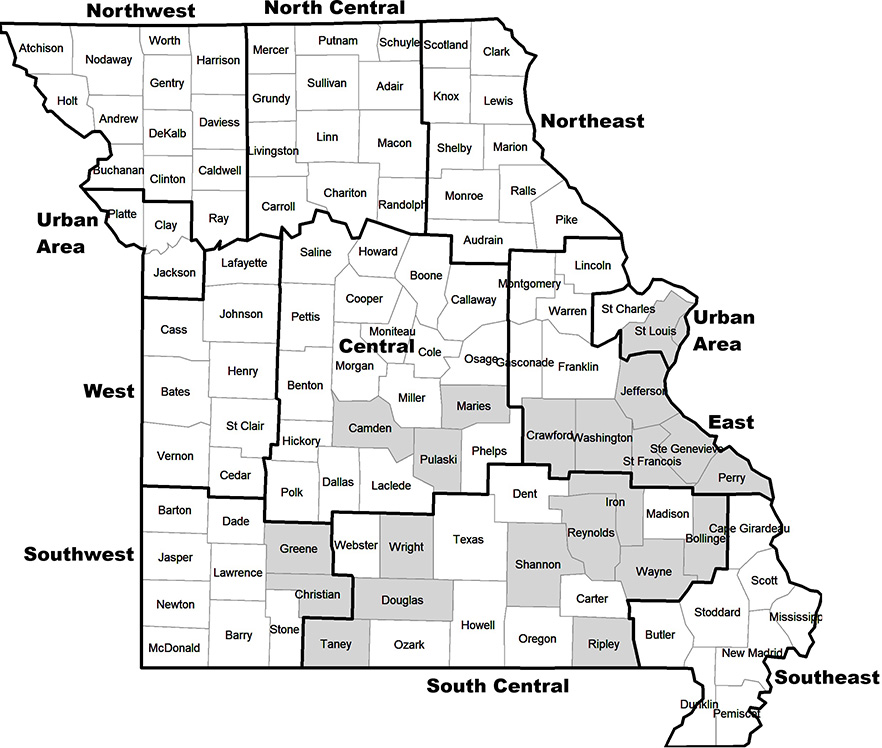
USDA Agricultural Statistics Districts (ASD) boundaries were used to aggregate the data, capturing variation in geography, climate and cropping practices. This categorization divides Missouri into nine regions: Northwest, North Central, Northeast, West, Central, East, Southwest, South Central and Southeast. A 10th Urban region was created for the state’s urban areas, comprising Platte County, Clay County, Jackson County, St. Charles County and St. Louis County. Figure 1 denotes these regions with dark borders. Counties in gray indicate areas from which no survey responses were collected across any type of land, and regional estimates may or may not reflect land values in nonreporting counties.
Average value of land
Respondents were asked to provide estimates of land values for three classes of cropland and pastureland (good, average, poor), irrigated cropland, timberland (with valuable trees) and hunting/recreation land (with little productive agricultural value but desirable aesthetic qualities or natural amenities). “Good” land is defined as land with yields more than 10% above the county average; “poor” land is defined as land with yields more than 10% below the county average.
Table 1 reports farmland values in dollars per acre at the state and regional levels based on 2025 survey data. In Missouri, the average value of “good” nonirrigated cropland was estimated at $8,596 per acre, a negligible change from 2024 survey responses. The statewide value of “average” nonirrigated cropland was $7,129 per acre, a 1.9% increase from 2024. Irrigated cropland was reported at a statewide average of $9,356 per acre, down $768, or 7.6%, per acre from 2024. “Good” pastureland and “average” pastureland values decreased from 2024 responses 0.6% and 0.4%, respectively. Timberland had the largest statewide value increase in 2025 — 14.7%, with an average value of $5,185 per acre. Hunting/recreational land saw an estimated 7.7% increase in 2025, with an average land value of $5,073 reported. Overall, nonirrigated cropland and pastureland were relatively stable from 2024 to 2025 in Missouri’s land market. The results also suggest farmland values were higher in the state’s East Urban region (St. Louis) and lower in the South Central region. Table 1 highlights the regional average for each land type.
Table 1. 2025 Missouri Farmland Values Opinion Survey results (dollars per acre).
| Area | Cropland | Pastureland | Timber-land | Hunting or rec land | |||||
|---|---|---|---|---|---|---|---|---|---|
| Irrigated | Good | Average | Poor | Good | Average | Poor | Average | Average | |
| State | |||||||||
| Missouri average | 9,356 | 8,596 | 7,129 | 5,962 | 5,651 | 5,022 | 4,512 | 5,185 | 5,073 |
| Region | |||||||||
| Northwest | 11,281 | 8,510 | 7,233 | 5,929 | 5,606 | 4,869 | 4,393 | 4,806 | 4,951 |
| North Central | 10,900 | 8,226 | 6,376 | 5,073 | 4,930 | 4,170 | 3,550 | 4,108 | 3,963 |
| Northeast | 10,527 | 10,314 | 8,167 | 6,593 | 6,167 | 5,626 | 4,828 | 5,372 | 5,782 |
| West | 8,419 | 7,671 | 6,823 | 6,107 | 5,842 | 5,363 | 4,793 | 5,034 | 5,204 |
| Central | 8,438 | 8,204 | 6,404 | 4,911 | 5,188 | 4,662 | 3,995 | 5,651 | 5,092 |
| East | 7,600 | 8,492 | 7,458 | 7,444 | 6,065 | 5,370 | 6,009 | 5,466 | 6,071 |
| Southwest | 10,036 | 8,357 | 7,248 | 6,321 | 7,304 | 6,408 | 5,821 | 6,760 | 6,003 |
| South Central | 6,000 | 6,444 | 5,100 | 3,889 | 4,309 | 3,561 | 2,833 | 2,958 | 2,804 |
| Southeast | 10,875 | 9,500 | 8,100 | 6,300 | 3,938 | 3,313 | 2,463 | 3,325 | 3,875 |
| East Urban Area (St. Louis) | NA | 15,625 | 15,875 | 16,000 | 14,188 | 14,938 | 16,188 | NA | 16,125 |
Methodology
The 2025 survey collected 2,072 observations across 417 respondents between March and May of 2025. The state and regional averages were calculated as an average of all reporting counties. Each county’s average was derived from all submitted responses.
During the data cleaning process, 39 outliers were removed, including observations that were $300 or less per acre or $50,000 or more per acre. These parameters were set after evaluating the full distribution of the data.
Regional and statewide averages may be impacted by year-to-year changes in geographic response rates. For example, the 2025 survey collected no data for the West Urban region (Kansas City), indicating that Urban Area estimates in Table 1 only represent the estimated farmland values in the East Urban region of Missouri. This region collected the fewest responses by category and as a result, averages for irrigated cropland and timberland were not provided given that fewer than five survey responses were collected.
Table 2 shows the distribution of the collected survey responses of farmland values by region and land type. More farmland values were collected in the North and Central regions of Missouri. The Southeast and Urban Area regions had the fewest reported farmland values this year.
Table 2. Number of reported farmland value observations in the 2025 Missouri Farmland Values Opinion Survey.
| Region | Cropland | Pastureland | Timber-land | Hunting or rec land | |||||
|---|---|---|---|---|---|---|---|---|---|
| Irrigated | Good | Average | Poor | Good | Average | Poor | Average | Average | |
| Northwest | 13 | 41 | 41 | 38 | 37 | 39 | 37 | 32 | 35 |
| North Central | 13 | 37 | 38 | 36 | 37 | 37 | 38 | 37 | 35 |
| Northeast | 20 | 33 | 32 | 30 | 31 | 30 | 29 | 27 | 29 |
| West | 19 | 24 | 22 | 21 | 23 | 25 | 22 | 21 | 20 |
| Central | 28 | 55 | 53 | 48 | 55 | 53 | 51 | 53 | 54 |
| East | 7 | 20 | 20 | 21 | 21 | 21 | 22 | 20 | 22 |
| Southwest | 12 | 13 | 13 | 13 | 16 | 18 | 16 | 13 | 16 |
| South Central | 6 | 9 | 9 | 9 | 23 | 26 | 23 | 22 | 22 |
| Southeast | 7 | 6 | 6 | 6 | 5 | 5 | 5 | 5 | 5 |
| East Urban Area (St. Louis) | 1 | 5 | 5 | 5 | 5 | 5 | 5 | 4 | 5 |
| Note: Average farmland values were not reported in Table 1 if there were fewer than five observations in the category. | |||||||||
Who bought and sold farmland in the past 12 months?
Respondents were asked to share their opinions on who bought and sold Missouri farmland, based on their own experience and observations. There were six predefined buyer categories.
Responses suggest a split in buyers of Missouri farmland (Table 3). Across the state, local farmers were reported as nearly 35% of buyers. Investors and recreational-land-and-lifestyle buyers were reported as the most common purchasers. New farmers and relocating farmers were reportedly less than 10% of buyers.
Table 3. Types of Missouri farmland buyers in the past 12 months.
| Buyer type | Percent | Number of respondents |
|---|---|---|
| Local farmers | 35% | 286 |
| Recreational land and lifestyle buyers | 25% | 204 |
| Investors | 23% | 182 |
| New farmers | 10% | 84 |
| Relocating farmers | 6% | 47 |
| Institutions | 0% | 0 |
| Note: Regional breakdowns are available from the authors upon request. | ||
In a follow-up question, survey respondents were asked their opinions about the buyer’s intended use of the land (Table 4). Statewide, respondents believed that more than 40% of buyers planned to farm the land themselves. Almost 30% of buyers were believed to be planning to use the land for hunting and recreational purposes. Respondents reported that 26% of farmland purchasers planned to rent out the land, whereas only 3% of Missouri land buyers were perceived to be purchasing land to develop renewable energy, such as wind and solar.
Table 4. Buyers’ plans for purchased Missouri farmland.
| Plan for land | Percent | Number of respondents |
|---|---|---|
| Operate the farm themselves | 42% | 276 |
| Use for hunting and recreational purposes | 29% | 193 |
| Rent the land out | 26% | 169 |
| Develop renewable energy (solar and wind) | 3% | 19 |
| Note: Regional breakdowns are available from the authors upon request. | ||
On the seller side of land values, respondents were given five options and asked for their opinion on who sold farmland in the past year. Across the state, respondents reported that a significant share of land sales were part of estate sales (37%) or from retiring farmers (35%), while active farmers represented a smaller share (14%) similar to investors (13%) (Table 5). Respondents were also asked to infer the primary reason farmland was being sold; 40% identified favorable market prices, followed by 36% selecting family succession plans as a driver of farmland sales in Missouri. A need for cash was believed to motivate 15% of sales, on average, and 9% were presumed to be part of an adjustment in the seller’s investment portfolio (Table 6).
Table 5. Types of Missouri farmland sellers in the past 12 months.
| Seller type | Percent | Number of respondents |
|---|---|---|
| Estate sales | 37% | 248 |
| Retired farmers | 35% | 232 |
| Active local farmers | 14% | 96 |
| Investors | 13% | 90 |
| Institutions | 0% | 0 |
| Note: Regional breakdowns are available from the authors upon request. | ||
Table 6. Sellers’ reasons for selling Missouri farmland.
| Reason for selling | Percent | Number of respondents |
|---|---|---|
| Good market prices | 40% | 245 |
| Part of family succession plan | 36% | 217 |
| Need cash | 15% | 91 |
| Adjust investment portfolio | 9% | 55 |
| Note: Regional breakdowns are available from the authors upon request. | ||
Factors affecting land values
The survey also asked respondents to rank the relative influence of 11 factors on 2025 Missouri farmland values. These factors were net farm income, crop prices, livestock prices, interest rates, alternative investment, exports, inflation, liquidity, agricultural policy, land transition to nonfarm purposes, and quality of land available for sale.
Figure 2 shows the average levels of impact affecting Missouri farmland values in 2025. Many responded that they believed livestock prices (currently strong) and quality of available land for sale (low) applied strong upward pressure to Missouri farmland values in 2025. Additionally, alternative investments, inflation and land transition to nonfarm purposes were seen as drivers of increased farmland values.
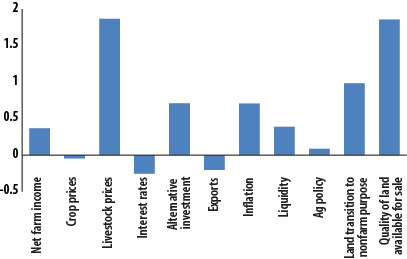
When considering negative impacts on Missouri’s farmland market, respondents cited crop prices, interest rates and exports as primary factors applying downward pressure. It should be noted that, although higher interest rates may impact farmers’ willingness to pay for land, not every farmer needs to finance land purchases.
Overall, we observed a slow increase or flat trend in farmland values from the 2024 survey — except for decreasing irrigated cropland values — and continued increases in timberland and hunting/recreational land values. The relatively stable farmland values may be due to low crop prices and high interest rates, which have tightened landowners’ financial positions. However, increasing interest in nonfarm purposes and a limited supply of land continue to serve as a tailwind for timberland and hunting/recreational land in Missouri’s land market.
Outlook
Survey respondents also shared expectations regarding 2026 farmland values (Table 7). On average, respondents expect Missouri cropland and pastureland prices to increase roughly 3% and “other” land to increase 2.8%. In particular, the state’s Urban region had the highest projected changes in cropland and pastureland values. Respondents also expected significant increases in land values in the Central and South Central regions of the state. A full breakdown of estimated changes in land values can be found in Table 7.
Table 7. Respondents’ expectations about changes in Missouri farmland values in 2026.
| Area | Average cropland value (percent) | Average pastureland value (percent) | Average other land value (percent) |
|---|---|---|---|
| State | |||
| Missouri average | 3.0% | 3.5% | 2.8% |
| Region | |||
| Northwest | 3.7% | 4.0% | 3.7% |
| North Central | 1.6% | 3.9% | 0.5% |
| Northeast | 0.9% | 1.5% | 0.4% |
| West | 1.9% | 2.9% | 2.7% |
| Central | 4.6% | 3.2% | 4.5% |
| East | 3.6% | 3.9% | 2.9% |
| Southwest | 1.8% | 2.6% | 2.1% |
| South Central | 4.9% | 6.1% | 4.3% |
| Southeast | 0.8% | 0.5% | 0.0% |
| Urban Area | 7.0% | 7.3% | 7.0% |
Although authors observed increases in expected average Missouri farmland values, several future uncertainties may still offset those anticipated gains. Based on the Rural and Farm Finance Policy Analysis Center Spring 2025 Outlook (PDF), 2026 Missouri net farm income is projected to decrease by 23% as government payments drop to historic averages while production costs remain high. Low quality of available farmland on the market, high interest rates, tariffs or other government policies’ impact on agriculture may put downward pressure on Missouri’s land market in 2026.