The Fourth National Climate Assessment report, released in 2018, uses the highest estimates of greenhouse gas emissions (called RCP 8.5) of the Intergovernmental Panel on Climate Change to forecast substantial economic losses in the U.S. The section on agriculture warns that food and forage production will decline, soil and water resources will degrade, and human and livestock health will be challenged. While the potential to adapt to climate change exists within many parts of the agriculture sector, the report predicts large economic burdens are associated with these adaptations.
The section on Midwest U.S. agriculture states “increased rainfall from April to June has been the most impactful climate trend for agriculture.” The report warns that five-day maximum temperatures could move further above optimum conditions and closer to reproductive failure temperatures in many plant species. Climate change estimates, if realized, would increase environmental degradation from agricultural land use decisions.
Farmers face two pressures from climate change. First, productivity and profitability may decrease. The variability of yields from extreme weather is difficult to manage. Second, many think agriculture, particularly animal agriculture, is a significant contributor to climate change. While many of the greenhouse gas (GHG) emissions associated with meat production are from manure and enteric fermentation emissions, many are also traced back to feed crop production. Both crop and animal farmers are under pressure to reduce their GHG emissions.
This guide presents basic information on agriculture’s role in GHG emissions. It draws heavily upon a report issued in 2021 by the Environmental Protection Agency (EPA) titled Inventory of U.S. Greenhouse Gas Emissions and Sinks: 1990-2019. It also presents recent proposals for carbon reductions and a perspective on United Nation reports on agriculture and climate change.
Greenhouse gases in the U.S.
Greenhouse gases are gases in the atmosphere which capture solar radiation to warm the surface of the earth. Without GHG, earth’s average daily surface temperature would be about minus 2 degrees Fahrenheit rather than its current temperature of about 59 degrees Fahrenheit. The concern among many scientists is that the concentration of GHGs has increased significantly since the beginning of the industrial revolution in the 1800s. Scientists hypothesize these increased concentrations of GHGs can significantly warm the surface of the earth and cause changes in climatic conditions. Common naturally occurring greenhouse gases, in order of relative abundance, include: water vapor, carbon dioxide, methane, nitrous oxide, and ozone.
This guide will focus on the GHG concentrations affected by agricultural activity: carbon dioxide, methane, and nitrous oxide. Carbon dioxide is the most well-known GHG because it is the most prevalent, making up more than 80 percent of greenhouse gas emissions related to human activity. Carbon dioxide is associated with burning fossil fuels. However, methane and nitrous oxide actually capture more heat in the atmosphere than carbon dioxide on a per unit basis.
Methane contributes 25 times the impact of carbon dioxide to global warming. Any quantity of nitrous oxide in the atmosphere exerts 298 times the impact an equal amount of carbon dioxide. All GHGs are reported as carbon dioxide equivalents (abbreviated CO2e).
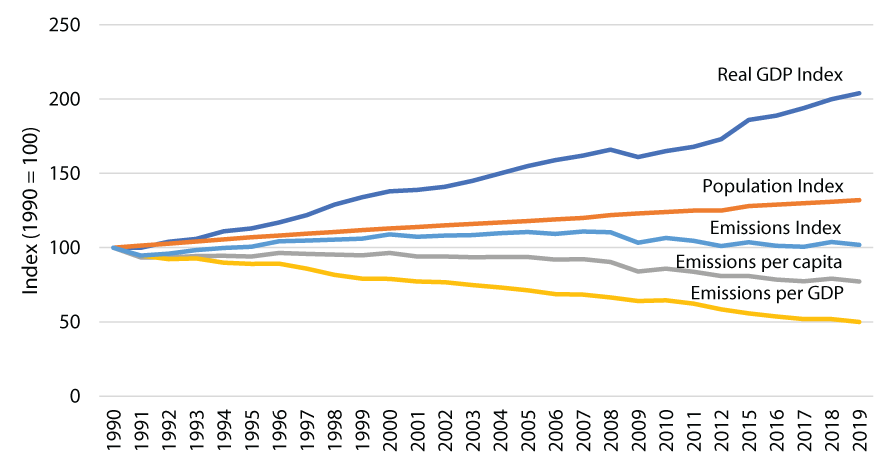
In 2019, U.S. GHG emissions totaled 6,577 million metric tons (MMT) CO2e. Total annual 2019 U.S. GHG emissions were two percent higher than in 1990. During this same time period the U.S. population increased 32 percent and the country’s real gross domestic product (GDP) increased 104 percent (Figure 1). Changes in emissions are frequently associated with changes in population, economic growth, energy price, seasonal temperatures, and technology. The declining GHG emissions per capita and per dollar of gross domestic product indicate increased efficiency.

1. GDP = gross domestic product, the total market value of all goods and services produced in the U.S. annually.
A portion of GHG emissions can be offset when carbon in the atmosphere is captured and stored, or sequestered, by plants and soil. In 2019, the EPA estimated carbon sequestration by forests, trees in urban areas, agricultural soils, and other sources offset 789 MMT CO2e, or 12 percent of total emissions.
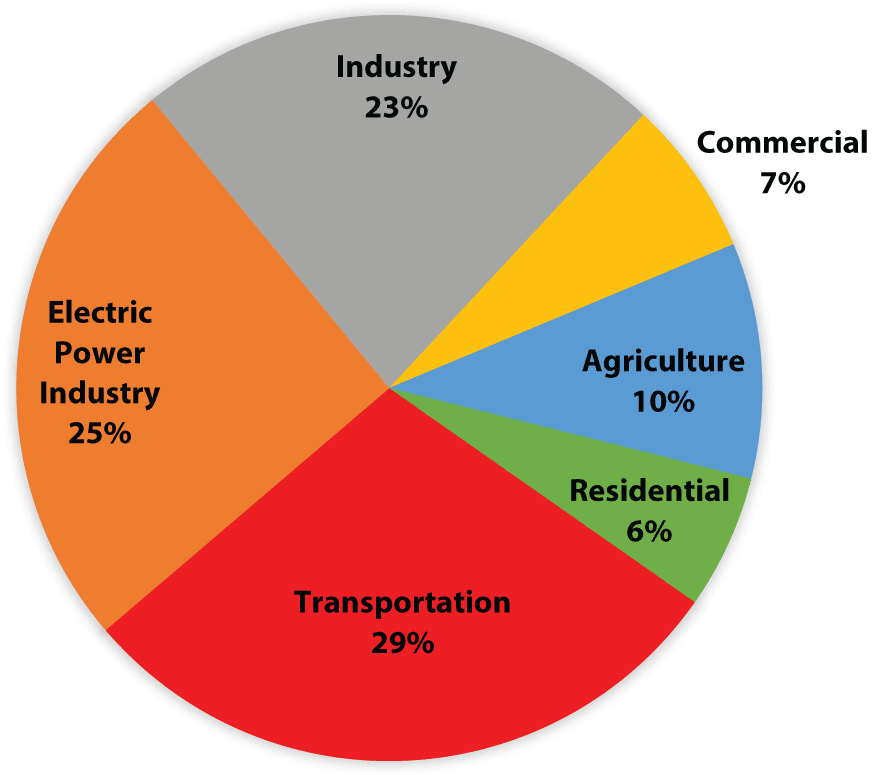
The EPA distributes GHG emissions among six economic end-user sectors – industrial, transportation, residential, commercial, electric power, and agriculture. Agriculture is estimated to be responsible for 10 percent of the GHGs emitted in the United States in 2019 (Figure 2).

Agricultural GHG emissions
Most agricultural businesses are not required to measure or report their actual GHG emissions to the EPA. The EPA uses models to estimate agricultural emissions discussed below.
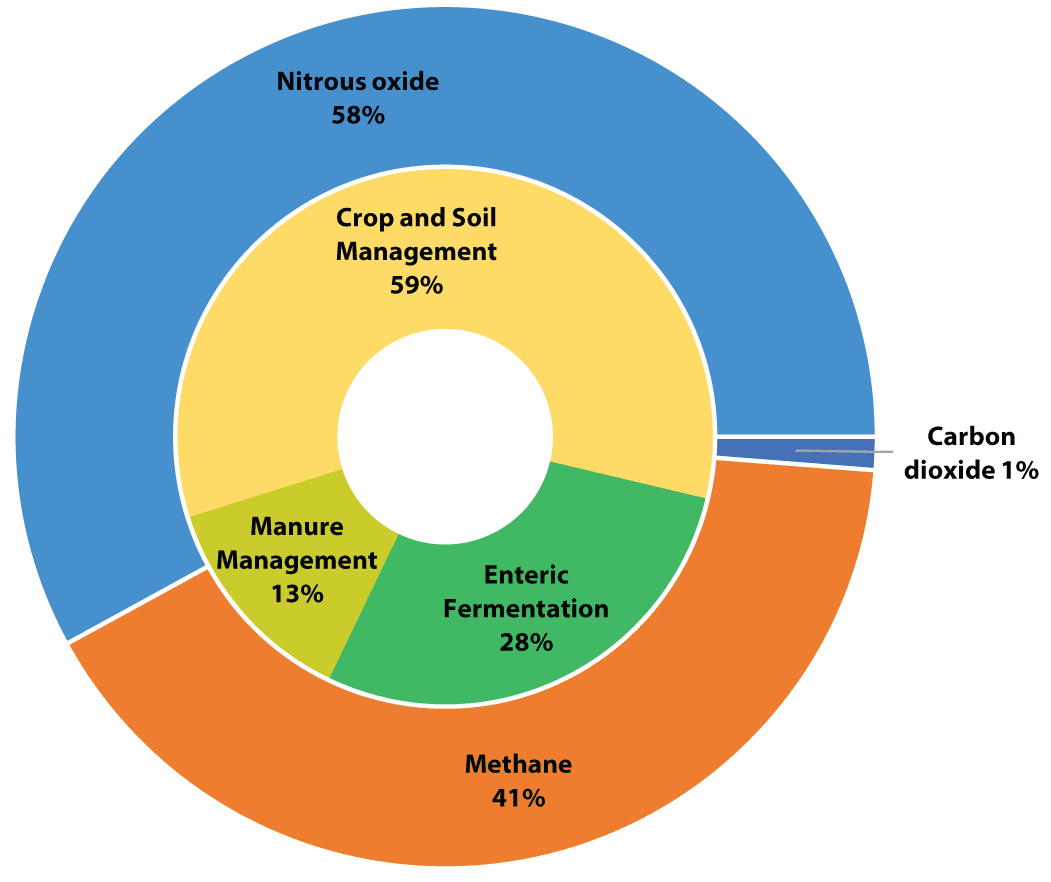
Agriculture contributes to GHG through crop and soil management, enteric fermentation in domestic livestock, and livestock manure management. Greenhouse gas emissions associated with the production and use of electricity occur within each of these activities. Agriculture is estimated to have directly released 629 MMT of CO2e in 2019. When electric-related emissions are distributed to the economic sectors, agriculture released an additional 35 MMT CO2e for a total of 664 MMT of CO2e in 2019.
Carbon dioxide accounts for only about 1 percent of direct agriculture-related GHG emissions. Nitrous oxide (N2O) and methane (CH4) are the primary greenhouse gasses emitted by agricultural activities. Total nitrous oxide emissions from agriculture were 364 MMT CO2e, or 58 percent of total agricultural CO2e in 2019. In 2019, 28 percent of CO2e released in agriculture came from enteric fermentation release of methane. Another 10 percent of CO2e in the form of methane was released from manure management.

From 1990 to 2019, agricultural emissions have increased 13 percent from 555 to 629 MMT of CO2e. Climatologists consider total emissions to be the critical metric driving climate change and are concerned that U.S. emissions have increased during this period.
Decreasing total emissions from agriculture require either decreasing agricultural production that release GHGs or decreasing the amount of GHG released per unit of production, or both. The trend of global population growth necessitates increasing agricultural output throughout the foreseeable future.
Yield-scaled emissions, which measure the amount of GHG released per unit of production, are computed by dividing GHG emissions by units of industry output. Agricultural yield-scaled emissions have been decreasing. USDA reports that total agricultural output increased by 31% from 1990 to 2017. GHG emissions per unit of total agricultural production have decreased 15% over the same time period.
The increases in total agricultural emissions have been the result of increased quantity of crops and livestock produced. The decrease in yield-scaled emissions have been the result of increased efficiencies.
A GHG source is designated a key category by the EPA when it has a “significant influence on the country’s total inventory of GHG in terms of the absolute level of emissions, the trend in emissions, or both.” The EPA considers the following agriculture GHG sources as key categories: CO2 emissions from liming farmland; methane emissions from enteric fermentation, manure management, and rice cultivation; direct nitrous oxide emissions from agricultural soil management; indirect nitrous oxide emissions from applied nitrogen and emissions from land use change.
Crop and soil management
The EPA estimated crop and soil management was responsible for 368 MMT of CO2e emissions in 2019. The bulk of the CO2e emitted via crop and soil management was in the form of nitrous oxide. Nitrous oxide is produced naturally in the soil but is released in larger quantities by human activities that increase soil mineral nitrogen. The EPA states the following activities directly increase nitrous oxide emissions: commercial nitrogen fertilization, application of manure or other organic materials as fertilizer, retention of crop residues, production of nitrogen fixing crops and forages, drainage of soils with high organic matter content, irrigation, drainage, tillage practices, and fallowing of land. Practices which indirectly increase nitrous oxide emissions are volatilization and subsequent atmospheric deposition of applied nitrogen, and surface runoff and leaching of applied nitrogen.
Direct nitrous oxide emissions tend to be high in regions of high nitrogen fixation by soybeans and high nitrogen fertilization. The highest nitrous oxide emissions include the Midwestern Corn Belt, the Lower Mississippi River Basin and highly productive irrigated areas.
Rice production contributes 15 MMT CO2e. Soil microbes in flooded fields produce methane. This methane escapes to the atmosphere where it captures heat 25 times more effectively than CO2. Field burning of crop residues is not considered a net source of actual CO2 emissions because it releases CO2 that was captured from the atmosphere during the growing season. However, other gases released during the burning including methane, carbon monoxide, nitrous oxide and other nitrogen oxides are considered a release of GHGs. Although residue burning is perhaps the most visible release of gas into the atmosphere, it is a minor contributor. The EPA estimated 0.6 MMT of CO2e, approximately 0.1 percent of total agriculture-related emissions, resulted from field burning in 2019.
Manure management
Manure management is a source of methane and nitrous oxide emissions. The EPA estimated manure management was responsible for 82 MMT of CO2e emissions in 2019.
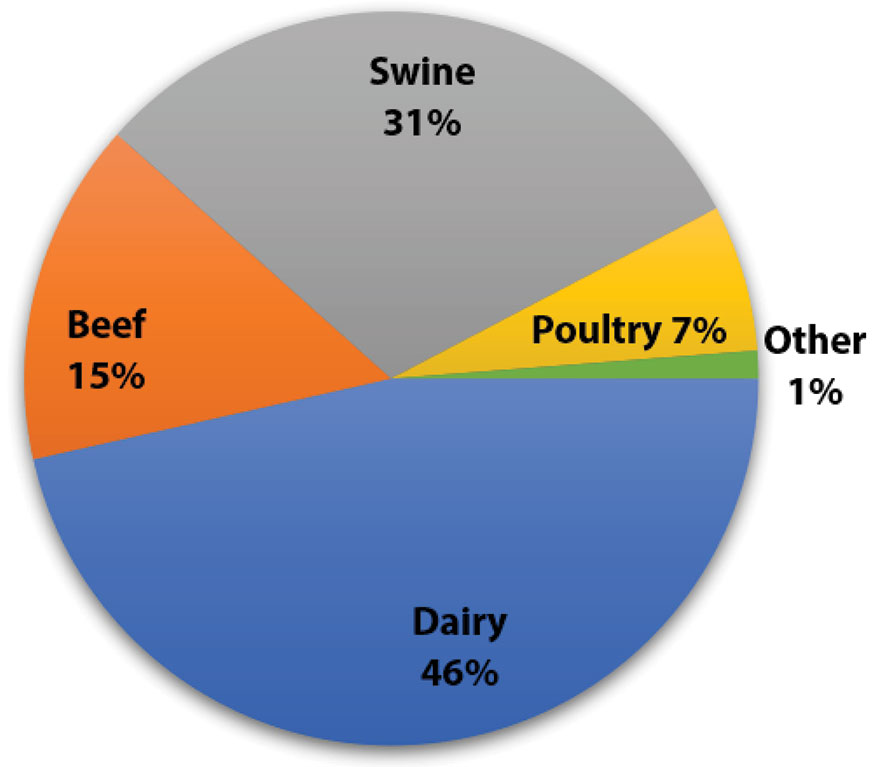
Most GHG emissions from manure management are in the form of methane, coming mostly from liquid manure management systems on dairy and swine operations (Figure 4). Swine and dairy GHG emissions from manure increased during the 1990’s and first decade of the 2000’s when production moved towards confinement systems with liquid manure storage systems. While continuing to increase, the rate of increase in emissions from dairy and swine has declined over the last decade.

Methane production occurs when manure is handled under anaerobic conditions such as in liquids and slurries. When manure is handled as a solid, little or no methane is produced. The amount of methane produced is affected by temperature, moisture, time in storage, manure composition and storage system.
Nitrous oxide is produced from organic nitrogen in both manure and urine. Solid manure management systems produce nitrous oxide because they have both aerobic and anaerobic decomposition which nitrifies and then denitrifies the nitrogen in the manure and urine.
Enteric fermentation
Methane production by enteric fermentation is a part of normal digestive processes in animals, especially ruminant animals such as cattle, sheep, and goats. The amount of methane produced is affected by the number of livestock in the United States and by the amount and type of feed they consume. Livestock fed higher quality feed produce less methane than those grazing low quality forages.
The EPA estimated enteric fermentation was responsible for 179 MMT of CO2e emissions in 2019. Beef and dairy cattle were responsible 96 percent of emissions from enteric fermentation. All other classes of livestock contributed 4 percent.
Land use and land use changes
Land use and land use changes resulted in a net carbon sequestration of about 789 MMT of CO2e, roughly 12 percent of total U.S. GHG emissions in 2019. The largest sources of carbon sequestration in the U.S. are attributed to forest land. Forest lands were estimated to sequester 775 MMT of CO2e in 2019.
Crop and range land use activities cause both emissions and sequestrations of carbon. The emission and removal of carbon from the atmosphere is called a GHG flux. The EPA reports agricultural fluxes in the following land use/change categories: cropland remaining cropland, land converted to cropland, grassland remaining grassland, and land converted to grassland. Net U.S. carbon emissions from these four categories was 32 MMT of CO2e in 2019.
Within the United States, cropland remaining cropland was estimated to sequester a net 15 MMT of CO2e. Land converted to cropland were estimated to release 54 MMT of CO2e. Grassland remaining grassland released 15 MMT CO2e in 2019. Land converted to grassland sequestered 23 MMT CO2e in 2019.
Sequestration of carbon from land management activities are more challenging to estimate. Soil type, annual weather conditions, types of fertilizer used, timing of fertilizer application and tillage method are a few of the activities that influence carbon release or sequestration. The models combine data on the prevalence of various management practices and annual weather with estimates of the impact for individual activities. How all the various factors interact to release or sequester carbon is a matter for continued research.
U.S. summary
Agriculture released 641 MMT of CO2e in 2019. In addition, 32 MMT CO2e was released by agricultural land use and land use changes in 2019. Forest lands sequestered 775 MMT CO2e. A summary of this information can be found in Table 1.
Table 1. Summary of carbon dioxide equivalent emissions and sinks.
| Sector | MMT CO2e |
|---|---|
| Total U.S. (all sectors) | 6,557 |
| Total Agriculture | 641 |
| Crop and Soil Management | 345 |
| Enteric Fermentation | 178 |
| Manure Management | 83 |
| Electricity Related | 35 |
| Agricultural Land Use Flux | 32 |
| Sequestration by Forest Lands | -775 |
The Biden administration has indicated that they consider agriculture to be an important player in reducing carbon in the atmosphere. They have proposed establishing a Carbon Bank to finance large scale investments in regenerative agriculture and incentivizing climate smart agriculture with crop insurance and loan programs managed by the USDA.
Many businesses that provide inputs and services to agriculture are developing programs to engage farmers to reduce carbon emissions or to capture and store carbon. Farmers can participate in carbon sequestration related financial opportunities by changing crop or livestock production practices. Reduced tillage and use of cover crops are proposed as ways to sequester more carbon in the soil. Capturing methane emissions from manure storage structures and using that methane as transportation fuel or to create electricity would also reduce GHG emissions from agriculture.
Farmers will be impacted by climate policies. They may financially benefit from reducing carbon emissions on their farms. They may also experience higher costs for fuel, fertilizer and chemicals due to policies affecting these industries. The net benefit to farmers of efforts to reduce carbon in the atmosphere is not yet clear.
United Nations reports
This guide has focused on U.S. emissions as estimated by the EPA. Various United Nations (U.N.) agencies have produced reports that are often mentioned in the popular press. Understanding these reports fosters informed conversations about the impact of agriculture on climate change.
The U.N. Food and Agriculture Organization (FAO) published a report entitled Livestock’s Long Shadow in 2006. This report summarized that livestock production alone released 18 percent of all global GHG emissions. This report, after publication, was found to contain several errors that were acknowledged by the authors. Though no longer a valid estimate of GHG emissions from animal agriculture, Livestock’s Long Shadow is still quoted and remains available on the FAO website.
In 2013, the FAO published Tackling Climate Change through Livestock where they estimate the livestock sector releases 14.5 percent of human-induced GHGs. Beef and dairy cattle production are estimated to release 61 percent of all GHGs. Hogs release nine percent and poultry release eight percent. Of the emissions from livestock production, they estimate 45 percent is due to feed production and processing. Feed processing includes deforestation due to expansion of pasture and feed crops. While the U.S. is not experiencing deforestation, some contend that U.S. decisions affect global deforestation and therefore is a U.S. concern.
Both FAO reports state that ruminant production systems with low feed digestibility, less efficient management and low reproductive performance have higher yield-scaled emissions. These characteristics do not describe U.S. beef production. U.S. meat production systems are managed in a way that reduces GHG emissions relative to the rest of the world.
The relative efficiencies of U.S. animal production have been documented by life cycle analyses of U.S. meat production. Multiple research studies have documented how yield-scaled GHG emissions from U.S. farms has significantly decreased during the last 50 years. A 2021 U.N. research paper found that the per capita GHG emissions from food systems has decreased in all world regions from 1990 to 2015.
Resources
The following reports were used in the creation of this guide.
- Global Change Research Program. Agriculture and rural communities, In Impacts, risks, and adaptation in the United States: Fourth national climate assessment, Volume II.
- U.S. EPA. Inventory of U.S. greenhouse gas emissions and sink: 1990-2019.
- USDA. U.S. agriculture and forestry greenhouse gas inventory: 1990-2013 (PDF).
- U.N. Food and Agriculture Organization. Livestock’s long shadow.
- U.N. Food and Agriculture Organization. Tackling climate change through livestock: a global assessment of emissions and mitigation opportunities (PDF).
- Crippa, M. and others. 2021. Food systems are responsible for a third of global anthropogenic GHG emissions. Nature Food 2(3):198-209.
- Capper, J. and others. 2009. The environmental impact of dairy production: 1944 compared with 2007. Journal of Animal Science 87:2160-2167.
- Capper, J. 2009. The environmental impact of beef production in the United States: 1977 compared with 2007. Journal of Animal Science 89:4249-4261.
- Putman B. and others. 2018. A retrospective assessment of U.S. pork production: 1960–2015. University of Arkansas.