Top 15 world crops ranked by area and total production | Top 15 U.S. crops ranked by area harvested and total value | Top 10 Missouri crops ranked by area harvested and total value | Acres and total land dedicated to Missouri's 10 primary crops | Historical overview of land dedicated to Missouri's Top 10 crops
Top 15 world crops ranked by area and total production
| Crop | Hectares | Acres | Rank | Production (MT) | Rank |
|---|---|---|---|---|---|
| Wheat*# | 220,107,551 | 543,665,651 | 1 | 749,460,077 | 3 |
| Corn*# | 187,959,116 | 464,259,017 | 2 | 1,060,107,470 | 2 |
| Rice*# | 159,807,722 | 394,725,073 | 3 | 740,961,445 | 4 |
| Soybean*# | 121,532,432 | 300,185,107 | 4 | 334,894,085 | 6 |
| Barley* | 46,923,218 | 115,900,348 | 5 | 141,277,993 | 8 |
| Sorghum*# | 44,771,056 | 110,584,508 | 6 | 63,930,558 | 10 |
| Rapeseed* | 33,708,547 | 83,260,111 | 7 | 68,855,446 | 9 |
| Millet* | 31,705,489 | 78,312,558 | 8 | 28,357,451 | 12 |
| Cotton# | 30,206,843 | 74,610,902 | 9 | No data | No info |
| Dry beans* | 29,392,817 | 72,600,258 | 10 | 26,833,394 | 13 |
| Peanut* | 27,660,802 | 68,322,181 | 11 | 43,982,066 | 11 |
| Sugar cane | 26,774,304 | 66,132,531 | 12 | 1,890,661,751 | 1 |
| Cassava | 23,482,052 | 58,000,668 | 13 | 277,102,564 | 7 |
| Potato# | 19,246,462 | 47,538,761 | 14 | 376,826,967 | 5 |
| Oat*# | 9,433,141 | 23,299,858 | 15 | 22,991,780 | 14 |
| Legend: *Grain crop #Grown in Missouri |
|||||
Source: Food and Agriculture Organization of the United Nations (FAO)
Did you know...
- Grain crops account for 73 percent (11) of the top 15 world crops.
- Grain crops are important to people because they are an excellent source of calories, highly adaptable to where people live and easily stored.
- The top three crops account for 56 percent of the total area of production of the 15 listed crops.
- Grain crops are harvested dry (<15 percent moisture), while other important crops — such as sugar cane or potatoes — are harvested wet (>50 percent moisture).
Top 15 U.S. crops ranked by area harvested and total value
| Crop | Area (acres) | Rank | No. 1 state | Value (million U.S.$) |
Rank |
|---|---|---|---|---|---|
| Soybean*# | 89,522,000 | 1 | Illinois | 41,008 | 2 |
| Corn*# | 82,703,000 | 2 | Iowa | 48,466 | 1 |
| Hay# | 53,784,000 | 3 | Texas | 16,155 | 3 |
| Wheat*# | 37,586,000 | 4 | Kansas | 8,142 | 4 |
| Cotton# | 11,349,000 | 5 | Texas | 7,227 | 5 |
| Sorghum*# | 5,045,000 | 6 | Kansas | 1,175 | 11 |
| Rice*# | 2,374,000 | 7 | Arkansas | 2,246 | 7 |
| Dry beans* | 2,013,000 | 8 | North Dakota | 1,013 | 13 |
| Canola* | 2,002,000 | 9 | North Dakota | 532 | 16 |
| Barley* | 1,954,000 | 10 | Montana | 614 | 15 |
| Peanut* | 1,756,000 | 11 | Georgia | 1,638 | 8 |
| Sunflower* | 1,345,000 | 12 | North Dakota | 389 | 17 |
| Sugar beet | 1,114,000 | 13 | Minnesota | 1,312 | 10 |
| Potato | 1,026,000 | 14 | Idaho | 4,561 | 6 |
| Sugar cane | 893,000 | 15 | Florida | 1,044 | 12 |
| Legend: *Grain crop #Grown in Missouri | |||||
Source: U.S. Department of Agriculture/National Agricultural Statistics Service
Did you know...
- Grain crops account for 67 percent (10) of the top 15 U.S. crops.
- Two crops — soybean and corn — account for 58 percent of the total area devoted to the top 15 crops.
- North Dakota produces 80 percent of U.S. canola.
Top 10 Missouri crops ranked by area harvested and total value
| Crop | Area (acres) | Rank | No. 1 county | Value (million U.S.$) |
Rank |
|---|---|---|---|---|---|
| Soybean* | 5,910,000 | 1 | New Madrid | 2,722 | 1 |
| Corn* | 3,325,000 | 2 | Saline | 1,823 | 2 |
| Hay | 3,000,000 | 3 | Sullivan | 556 | 3 |
| Wheat* | 540,000 | 4 | Mississippi | 161 | 5 |
| Cotton | 297,000 | 5 | Dunklin | 261 | 4 |
| Rice* | 160,000 | 6 | Stoddard | 143 | 6 |
| Sorghum* | 23,000 | 7 | No info | 7 | 9 |
| Oat* | 13,000 | 8 | No info | 3 | 12 |
| Potato | 11,000 | 9 | No info | 28 | 7 |
| Melon | 3,000 | 10 | No info | 8 | 8 |
| Legend: *Grain crop | |||||
Source: U.S. Department of Agriculture/National Agricultural Statistics Service
Did you know...
- Grain crops account for 60 percent (six) of the top 10 Missouri crops.
- Two crops — soybean and corn — account for 70 percent of the total area devoted to Missouri's top 10 crops.
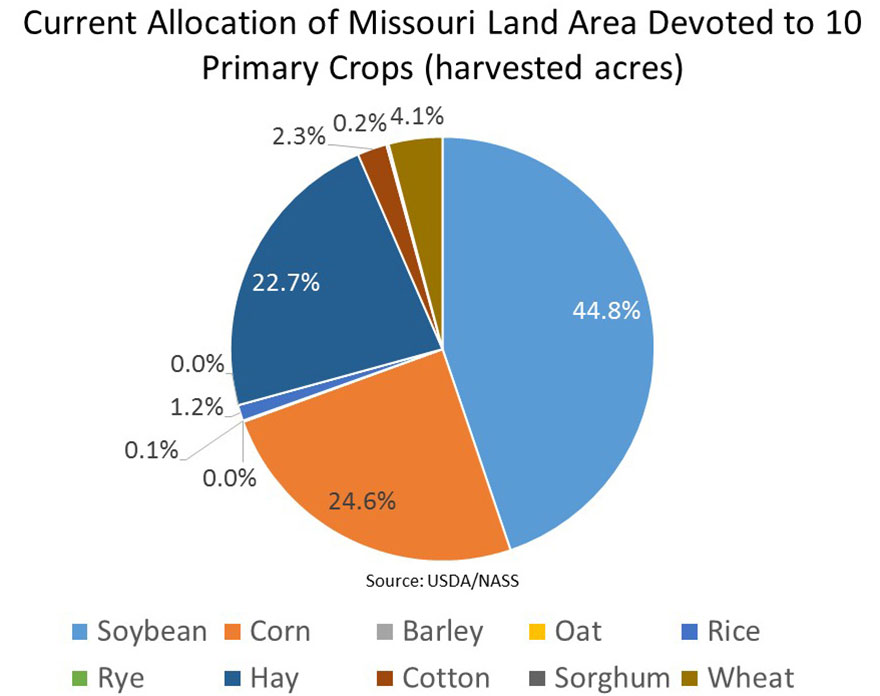
Acres and total land dedicated to Missouri's 10 primary crops

 of Total Land Area Devoted to 10 Primary Missouri Crops")
Historical overview of land dedicated to Missouri's 10 primary crops
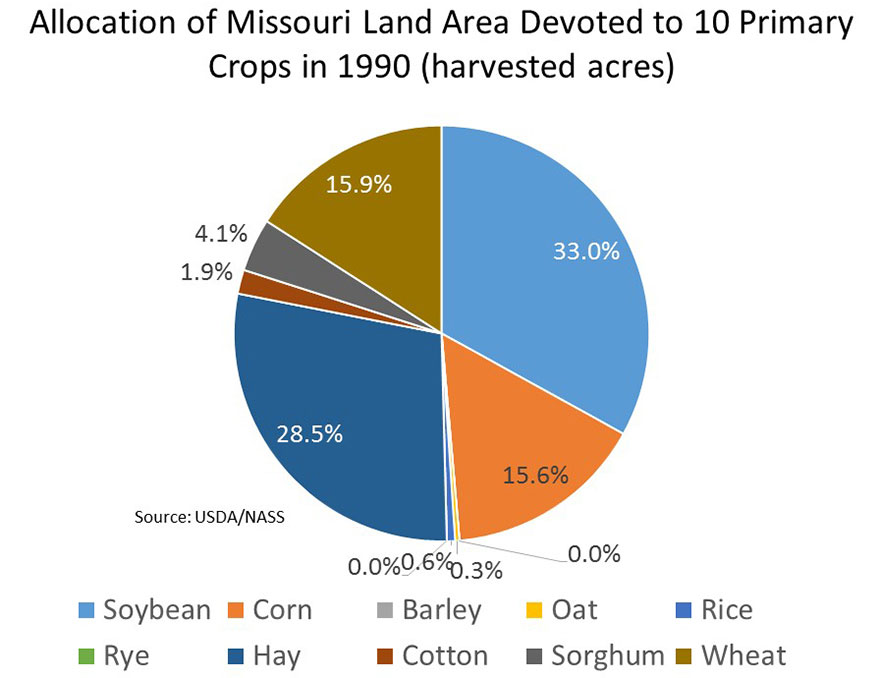
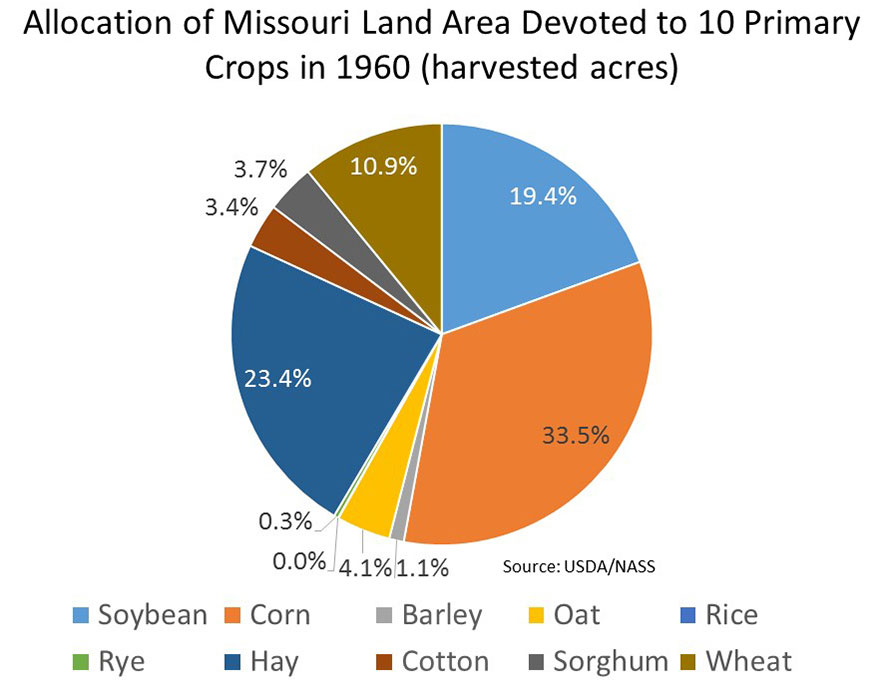
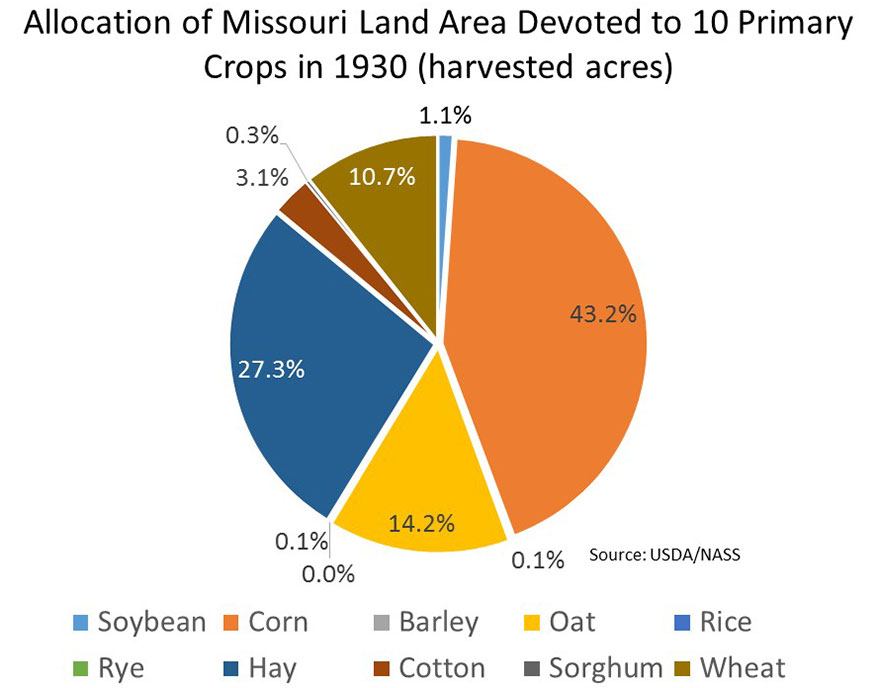
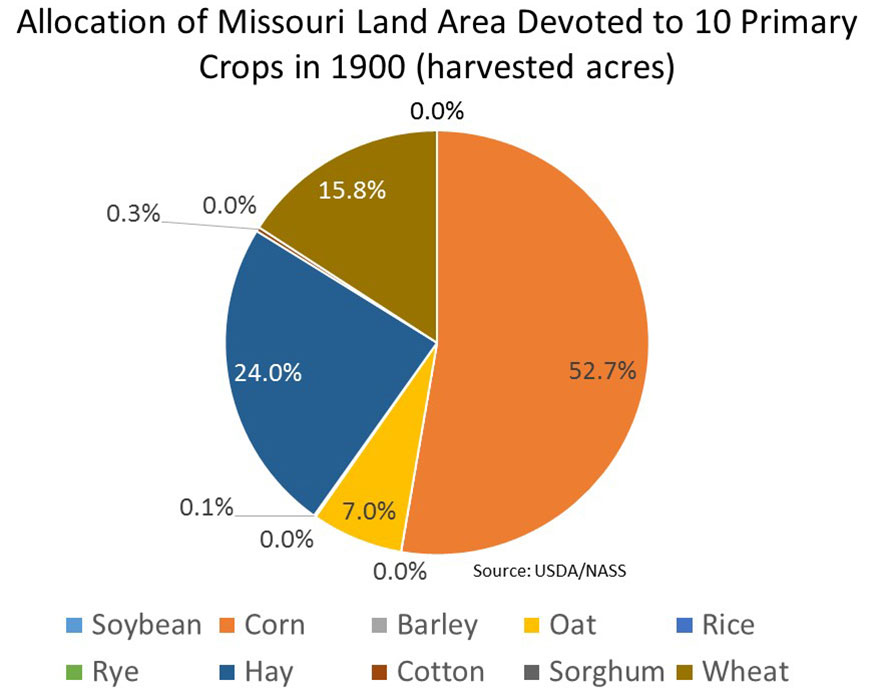
Allocation of Missouri land area devoted to 10 primary crops
| Crop | Current | 1990 | 1960 | 1930 | 1900 | |||||
|---|---|---|---|---|---|---|---|---|---|---|
| Acres (#) | Portion (%) | Acres (#) | Portion (%) | Acres (#) | Portion (%) | Acres (#) | Portion (%) | Acres (#) | Portion (%) | |
| Barley | 0 | 0 | 0 | 0 | 136,000 | 1.1 | 13,000 | 0.1 | 2,000 | 0 |
| Corn | 3,250,000 | 24.6 | 1,960,000 | 15.6 | 4,041,000 | 33.5 | 5,412,000 | 43.2 | 7,700,000 | 52.7 |
| Cotton | 297,000 | 2.3 | 235,000 | 1.9 | 412,000 | 3.4 | 383,000 | 3.1 | 49,000 | 0.3 |
| Hay | 3,000,000 | 22.7 | 3,580,000 | 28.5 | 2,822,000 | 23.4 | 3,414,000 | 27.3 | 3,500,000 | 24.0 |
| Oat | 13,000 | 0.1 | 42,000 | 0.3 | 499,000 | 4.1 | 1,783,000 | 14.2 | 1,020,000 | 7.0 |
| Rice | 160,000 | 1.2 | 80,000 | 0.6 | 3,800 | 0 | 0 | 0 | 0 | 0 |
| Rye | 0 | 0 | 0 | 0 | 41,000 | 0.3 | 14,000 | 0.1 | 21,000 | 0.1 |
| Sorghum | 23,000 | 0.2 | 520,000 | 4.1 | 452,000 | 3.7 | 32,000 | 0.3 | 0 | 0 |
| Soybean | 5,910,000 | 44.8 | 4,150,000 | 33.0 | 2,344,000 | 19.4 | 138,000 | 1.1 | 0 | 0 |
| Wheat | 540,000 | 4.1 | 2,000,000 | 15.9 | 1,321,000 | 10.9 | 1,336,000 | 10.7 | 2,315,000 | 15.8 |
Source: U.S. Department of Agriculture/National Agricultural Statistics Service