Recent issues
Vol. 7, Issue 9: Young Workers Trends – July 13, 2026 (PDF)
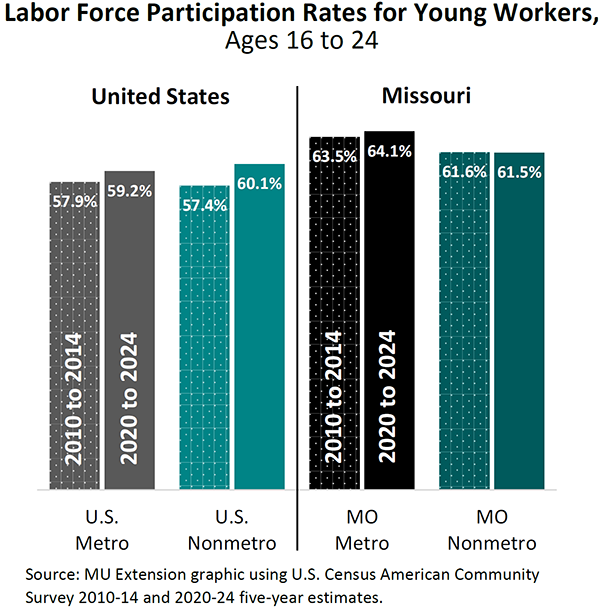
Missouri’s young labor force is shrinking: the population aged 16 to 24 declined 2.8% over the past decade, leaving 21,000 fewer potential youth workers. Despite this decline, Missouri youth participate in the labor market at a rate above the national average. 16% of Missouri’s private-sector jobs are held by employees under age 25, with most employment in restaurants and retail. As the youth population continues to shrink, upskilling and career advancement will become increasingly important.
Vol. 7, Issue 8: Farmers Markets and Direct Sales – June 15, 2026 (PDF)

Among border states, Missouri leads in the number of farms (3,215) selling direct-to-consumer, with sales reported in 106 of 114 counties. Roughly 2/3 of Missouri counties have at least one farmers market, with St. Louis (12), Jackson (9), and Green (8) having the highest concentrations. About 1/3 of Missourians have made local food purchases from a venue other than a farmers market (e.g., on-farm sales, community supported agriculture).
Vol. 7, Issue 7: Newcomers Bring Community Change – May 18, 2026 (PDF)
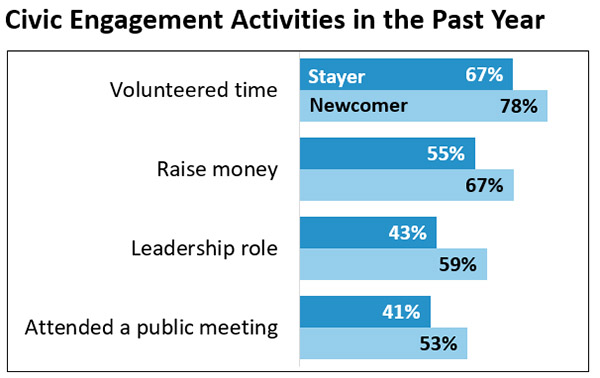
From 2020–25, net migration increased the average Missouri county population by 2.1%, with nonmetro counties experiencing a greater share of in-migrants compared to metro counties. A 2025 Northwest Missouri survey finds that area ties and health care access are top location considerations for all respondents. However, newcomers placed greater importance on amenities such as broadband access than did longtime residents.