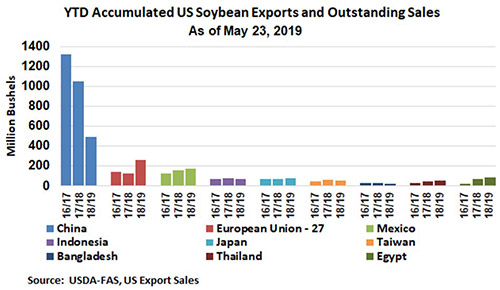
 Trade negotiations between the United States and China remain volatile and for the moment appear to be at an impasse after what appeared to be considerable progress in April. As of May 23, 2019, year-to-date outstanding sales and accumulated soybean exports for the 2018/19 marketing year to China are down 53%, and total U.S. soybean exports are down 25.3%. Year-to-date exports amount to 241 million bushels, leaving 255 million bushels in outstanding sales. There is concern that some of these outstanding sales may be canceled, although Bloomberg reports that the Chinese state grain traders indicate that there are no plans to cancel previous purchases of U.S. soybeans.1
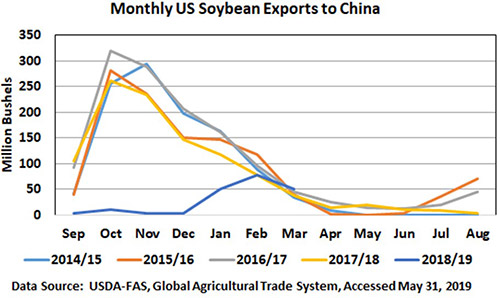
 In years prior to the trade war, China typically switched soybean purchases from the United States to South America in late February to early March. Note that China’s “goodwill” purchases in February and March 2019 were very similar to historical purchases.
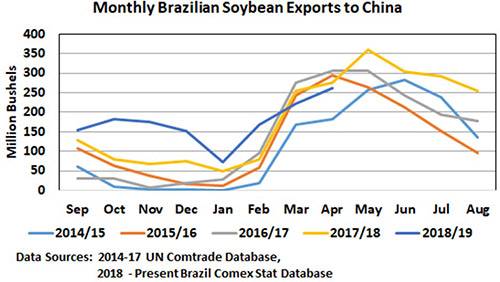
For the most part, South American soybeans have replaced U.S. exports to China. In 2018, many of the South American exports came from Brazil because of the drought in Argentina.
Argentina even imported some U.S. soybeans to keep its crushing plants running, while continuing to export to China, effectively arbitraging US soybeans. Looking at China’s monthly purchases of Brazilian soybeans shows that its exports were considerably higher over May 2018 through February 2019. Brazilian soybean exports to China in March and April of 2019 are running below volumes exported the past three years. The decline in Brazilian exports is thought to be the result of weaker Chinese demand due to African swine fever (ASF).
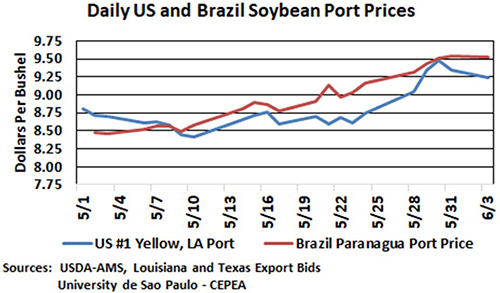
U.S. and Brazilian port prices haven't separated much since trade negotiations fell apart
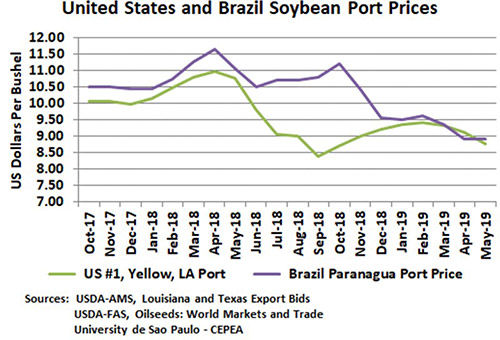 Port prices at the U.S. Gulf and at Brazil’s Paranagua port are still relatively close, and the price gap has not widened like it did in 2018 over the July to November period. A closer look at the daily prices for May 2019 reveals some widening of the gap between the ports since the beginning of May, but these gaps are 20 to 30 cents per bushel, compared with the October 2018 gap of $2.50 per bushel.
 With the reignition of the trade war, why hasn’t the gap between U.S. and Brazilian prices expanded to the levels experienced last October? Or will it still do this? Part of the reason stems from the uncertainty in the market caused by U.S. planting delays and the magnitude of damage caused by ASF on the Chinese swine herd. The decline in both U.S. and Brazilian soybean prices from March 2018 to May 2019 is clear. The market has lost at least $2.00 per bushel, and that reflects abundant supplies of soybeans combined with weak demand from China. But now there is an offsetting factor creating uncertainty about how many US soybean acres will planted if delays continue. In addition, arguably the market has now figured out the pathway to arbitrage U.S. soybeans. If Argentina or Brazil is concerned about not having enough soybeans for domestic use after exporting to China, they could import U.S. soybeans. Note that this arbitrage possibility would not eliminate the gap in port prices, but it should help limit the size of the gap to transportation costs.
1Bloomberg News, “China Puts U.S. Soy Buying on Hold as Tariff War Escalates”, May 30, 2019.