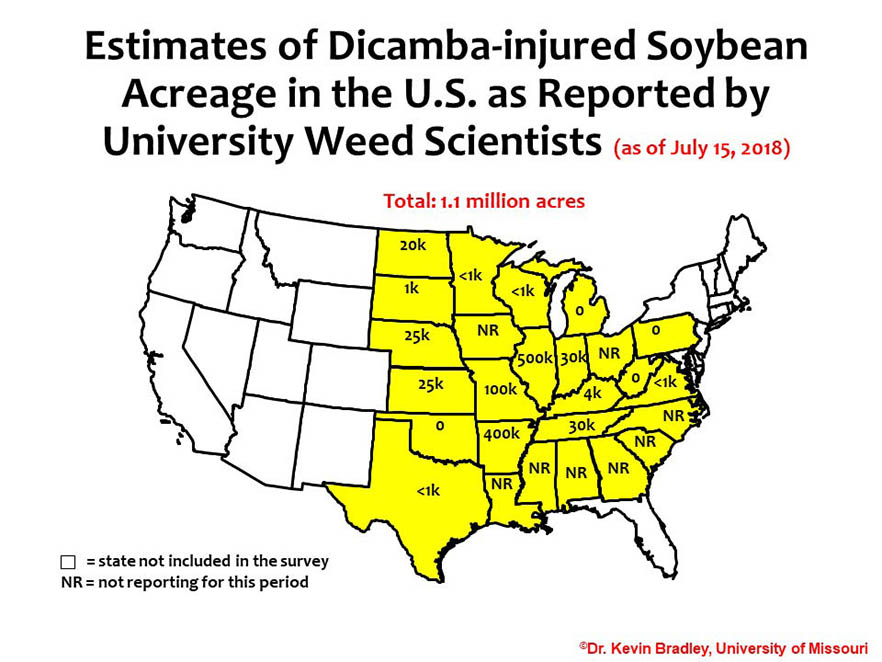
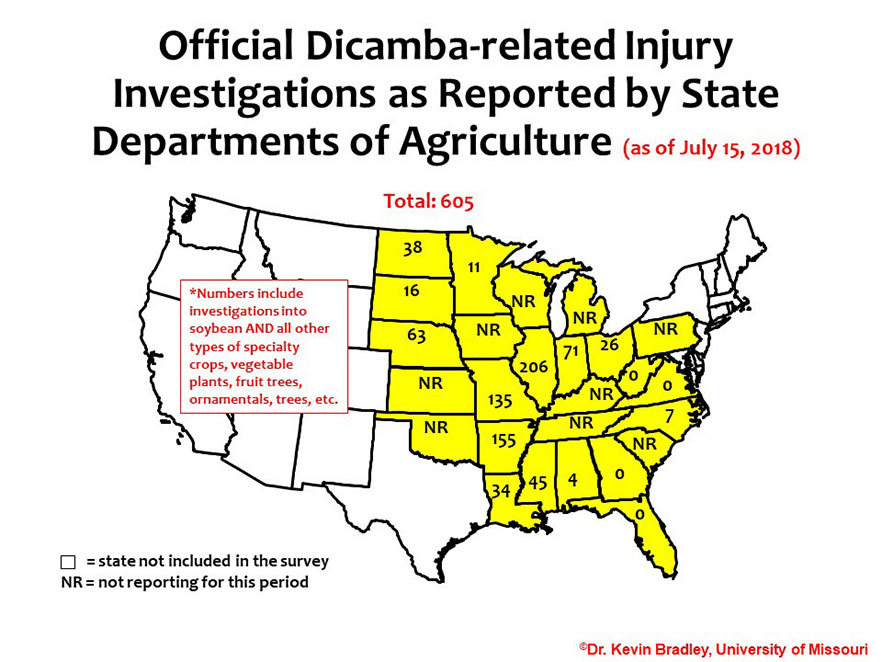
As explained in previous articles from this season (Dicamba Injury Mostly Confined to Specialty Crops, Ornamentals and Trees so Far, Dicamba Injured Crops and Plants Becoming more Evident: June 15th Update), I have attempted to provide updates as to the extent of dicamba injury throughout the United States, either in the form of official dicamba-related cases that are currently under investigation by the state Departments of Agriculture, or as estimates of dicamba-injured soybean acreage from university weed scientists. Herein, I provide the maps below as an update of the situation as of July 15th.
Because there seems to be great confusion and/or controversy over the maps, I just want to explain once again what these maps contain. First, university weed scientists estimate to what extent they are seeing dicamba injury in their respective states. It is an estimate. My colleagues use extension agents and other trusted sources throughout their state to generate these estimates just like I do in my own state. Hopefully everyone on all sides of this issue can appreciate that much more happens than what actually gets turned into the state Departments of Agriculture; that is the reason for the map of estimates.

The second map contains the number of actual dicamba-related injury investigations that are being conducted by the various state Departments of Agriculture. These are ongoing investigations and are not final. Given the significant strain that has been placed on these agencies who are now dealing with 2 to 3 times the number of investigations as in the past (usually without any added personnel or funding), I doubt these cases will be able to be finalized any time soon.

As for the information within the maps, as a point of reference, last season the first time we published any U.S.-wide information was on July 25th (Ag Industry, Do we have a problem yet?). At that time, there were 1,411 dicamba-related injury investigations being conducted by the various state Departments of Agriculture while university weed scientists estimated approximately 2.5 million acres of soybean had been injured with dicamba. To date, at about the same time in 2018, we have somewhere around 600 cases being investigated by the state departments of agriculture and approximately 1.1 million acres of soybean estimated with dicamba injury by university weed scientists. This information, of course, is only as good as the source and it should be noted that these totals do not reflect what has happened in those states who were unwilling to participate and provide information for this survey. I would also be remiss if I did not mention that these numbers are reflective of what has happened after tighter label restrictions, cut-off dates in certain states, and mandatory training which were not in place in 2017.
As I’ve said from the beginning on this whole issue, there are great differences in perspective about the extent of this problem and what constitutes success with this technology. Unfortunately, one’s perspective on this issue within agriculture seems to be closely linked to the company you work for or the type of seed you buy; a fact which I must confess disappoints me greatly and in my opinion is incredibly short-sighted.
In the first draft of this article, I started to go on and “wax eloquent” here about all of those issues again but upon re-reading, I deleted all of it. The truth is, as I was looking back to that first 2017 report (Ag Industry, Do we have a problem yet?), I stumbled onto the last two paragraphs of that article which contained two questions that, for the most part, I had pretty much forgotten about. One year later, I realized the most productive way I could end this article is to leave you with these same (modified) questions:
First, does 605 official dicamba-related injury investigations and/or approximately 1.1 million acres of dicamba-injured soybean constitute a problem for U.S. agriculture?
Second, can you look at the scale and the magnitude of the problem on these maps and really believe that all of this can collectively be explained by some combination of physical drift, sprayer error, failure to follow guidelines, temperature inversions, generic dicamba usage, contaminated herbicides, and improper sprayer clean out, but that volatility is not also a factor?