Recent public initiatives and USDA programs are putting a focus on producers to improve the health of their soils. Soil health is defined by the USDA-NRCS as “the continued capacity of the soil to function as a vital, living ecosystem that sustains plants, animals, and humans.” Soil health encompasses the biological, physical, and chemical aspects of soil function. Improving soil health will lead to a more sustainable agricultural system by protecting the soil resource while maintaining productivity and reducing environmental degradation.
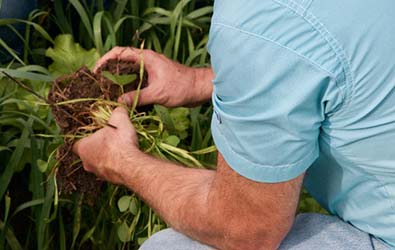 Figure 1. Farmers are increasingly interested in understanding how to measure the health of their soils, especially the impact of management changes such as cover crops. (Credit: R. Myers)
Current practices that producers can implement to improve their soil health include reduced tillage or no-till, cover crops, intercropping, manuring and more diverse crop rotations. Integration of livestock with cropping systems, such as grazing cover crops, can also boost soil health. Improving soil health may take time and will need to be monitored following appropriate sampling and testing protocols.
Several commercial soil testing laboratories offer soil health packages that measure biological, physical, and/or chemical soil characteristics. Some of these packages also provide an interpretation of the data, such as a soil health score, or may provide management recommendations in addition to the raw laboratory data. Assessing soil health is challenging and complex due to all the different functions that soil can perform. Therefore, a meaningful soil health assessment typically includes multiple measurements that provide a comprehensive picture of the status of the soil.
Most people in agriculture are familiar with collecting soil samples for a standard soil fertility test, but there are considerations to keep in mind to successfully collect soil health samples. Soil health sampling is different from soil fertility sampling in several ways. Unlike soil fertility testing, soil health indicators are focused on soil microorganisms and their habitat. These biological and physical indicators are more sensitive to changes in management practices and environmental conditions — precisely the reason they were selected as soil health indicators in the first place. However, this makes creating a sampling plan (a sampling protocol) for soil health testing ahead of time very important. This is also why consistent execution of that protocol for all future, repeat sampling is essential.
In designing a soil health sampling plan, keep in mind that soil is not the same across an entire field, and measurements from one part of a field can be very different from other parts. For example, soil at the top of a slope tends to differ from soil at the bottom of the same slope due to erosion and movement of soil. Therefore, in order to capture and understand how your soil is changing over time due to management, you must return to the same sampling spot each time. These considerations will be explored in more detail below.
Identifying your soil type and series
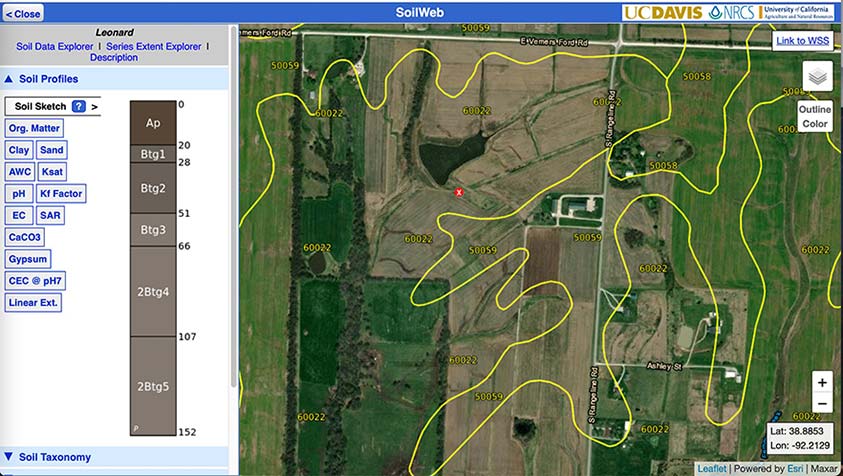
The simplest method to identify the soil types in your field and to identify soil type based zones is to use SoilWeb, a joint collaboration between University of California-Davis and USDA Natural Resource Conservation Service.
On the web — useful in planning out sampling zones based on soil type
- Go to SoilWeb.
- Go to Menu, then click on Zoom to Location. Enter address, ZIP code, GPS coordinates to find field of interest.
- Click on map to find soil map units, outlined in yellow.
- For each map unit, you can click through several categories to information about the soil, such as series description, drainage class, organic matter, and soil suitability ratings, etc.
Smartphone app — use in the field to see if you’re in the right spot
- Available from the Apple App Store (iOS) and Google Play (Android). Search for SoilWeb.
- Tap on Get Soil Data. You will probably need to enable location services for the app. It will load the soil map unit and soil series for your location.
- Click on Details or individual soil series name to see more information and series description.
Creating a sampling plan for soil health tests
Where to soil sample: Dividing your field
Zones
Similar to fertility testing, you should divide your field into sampling zones. However, soil health tests are more expensive than soil fertility tests (in general, $50 to $110 per sample compared to $7 to $14 per sample for most soil fertility tests). To minimize costs, select one or two small zones of interest to monitor rather than the entire acreage (e.g., a 15 to 20 foot diameter area). If you are using consistent agronomic management across the entire field, select different sampling zones based on productivity, soil type, or landscape position.
Zones based on yield
Sample your lowest-yielding areas to monitor, and then compare to the highest-yielding areas. If your low-yielding areas are limited by soil characteristics like low organic matter, poor water infiltration or drainage, or compaction, then those are the areas where you would expect to see greater soil health improvements in a short period of time. Higher yielding areas, especially if the soil health is already high, can provide an example of what the soil’s potential is, even though these areas are less likely to respond quickly to changes in management and may require many more years of monitoring to show a substantial change in the soil health test values.
Zones based on soil type and landscape
If you have several different soil types in the same field, you don’t need to sample each of them separately. Sample the two most predominant soil types and monitor them over time.
If you want to compare samples (compare multiple fields or different management), make sure the soils you are comparing are similar, with the same soil type and landscape position.
If soil type and landscape position are the same, then you are more likely to isolate the differences in soil health indicators that are due to management.
Reference sample
Consider also sampling an adjacent undisturbed area, such as a fence row, the edge of the woods, or possibly a long-term pasture to provide contrast. Undisturbed areas can provide an indication of the potential for this soil because these areas are more likely to represent the condition of the soil before it was farmed, and can provide a benchmark for your soil as you monitor improvements in soil health over time. We would expect the undisturbed soil to have higher soil health than the farmed soils, and this information will be especially useful by providing a personal threshold or goal to compare against in future years. The undisturbed soil will allow you to see how much improvement is possible in your soils and, as you monitor over time, you can see how quickly you are approaching these potential values.
Crop rows
Soil microbes like to be near plant roots, so where you sample – in rows or between rows - can impact your soil health results. But like many sampling recommendations, it doesn’t really matter whether you prefer to sample near crop roots, between rows or a mix of both, just be consistent and avoid fertilizer bands and wheel tracks.
History
Keep management history in mind. Even fields with the same soil type, same landscape position, and same management may demonstrate different soil health results if the management history was not the same. For example, a field that was previously cultivated for many decades with extensive tillage for annual crops will exhibit lower soil health when compared with a field that was previously in pasture, when all else is equal. Knowledge of previous management practices in a field is vital to understanding and interpreting soil health measurements.
When and how often to sample for soil health tests?
Frequency
Monitor changes in the soil health tests over time by sampling every three to five years. It’s highly unlikely to see significant changes in most soil health measurements in less than three years, though you may notice changes in earthworms or other indicators more quickly.
Previous crop matters
How often you repeat sampling should also take into consideration your crop rotation. If your field is in a two-year corn/soybean rotation, then repeat every four years so that you are following the same crop each time; whether sampling follows corn or soybean doesn’t matter as long as it is the same crop each time. Crop residues provide food for microbes and change the quality and quantity of organic matter, and the soil microbiology will respond differently to an abundance of slowly decaying corn stalks than to soybean stubble.
Cover crops
Cover crops may also need to be considered, especially if you are sampling in the spring or early summer — whether or not there are living roots from the cover crop or decaying residues can significantly affect the soil microbial community and, therefore, measurements of soil health.
Tillage and soil amendments
Tillage and soil amendments should also be kept in mind. Any recent disturbance of the soil or addition of chemicals or organic amendments can cause changes to the organic matter and microbial community. You’ll want to make sure you are comparing apples to apples as much as possible if monitoring a trend over time.
Season
What about season? The most important consideration is to be consistent each time you sample, so choose a time when you aren’t likely be busy in future years. If you get some free time to sample in the late spring but aren’t sure you’ll get to it in other years, it’s probably not a great choice. During the fall after harvest is often mentioned as the most practical for many farmers. Remember to keep in mind your crop rotation as mentioned above.
Temperature
Another factor to consider is that these tests focus on soil microbes, so you’ll likely have more useful results when the soils are not too cold — microbes will be more abundant and more active in warmer weather, so values for some tests may be low if you sample too early or late in the year when soils are colder. You should compare results from the same time of year across years (same season every year).
If you are comparing your results against threshold values provided by a soil health test or rating system, check with the lab service to see what time of year they recommend — it can make a difference.
Moisture
What’s the weather like? Microbes are sensitive to changes in environmental conditions, and this means temperature and moisture. Ideally, you’ve made sure to sample at the same time of year as the last time, but if you sampled when the field was bone-dry and this year the soils are saturated, your results are going to be really hard to compare. Moist but not saturated soils will allow for ease of sampling, so a little flexibility on the timing to account for weather is helpful. It doesn’t need to be the exact same day of the year each time — it’s better to sample two weeks later if the soils will be closer in moisture content to your last sampling event.
Ultimately, pick a time of year that works for you now as well as in future years. Stick to that timing for future sampling, but it’s okay to sample two weeks earlier or later to make sure that weather conditions are similar each time you sample for soil health.
How to collect the soil samples
Record the location
Keep the sample area/zone relatively small (e.g., a 15 to 20 foot diameter area) and make note of the location using GPS if possible for the purpose of returning to the same place for future sampling in order to monitor changes over time.
Plant residue
Remove plant residue (like corn stover, etc.) from the surface before collecting the samples.
Equipment
Different sampling equipment may be used, such as a soil probe (commonly used in fertility sampling) or soil rings. For the Missouri Soil and Water Conservation Program, rather than using soil probes, samples are collected using bulk density rings. Probes and rings come in different sizes.
Depth
Most soil health tests require a sampling depth of about 6 to 8 inches using a soil probe to represent the plow layer, or may be as shallow as 2 inches. Because soil health tests focus on soil biology, shallower sampling depths may be recommended, as soil microbial activity is greatest near the surface.
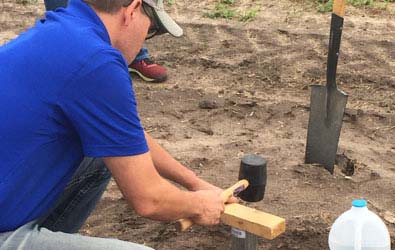 Figure 2. One of the methods for soil health sampling is to use a steel bulk density ring that is pounded into the ground with a block of wood and mallet, then the ring and soil sample is removed with a shovel. This method preserves the inherent structure of the soil, allowing bulk density to be measured, and also provides a good quality sample for other soil health tests. (Credit: R. Koelsch)
Soil probes should be inserted into the soil straight up and down to get an accurate depth (not at an angle). For the Missouri Soil and Water Conservation Program, bulk density rings are used to collect samples to a depth of 2.75 inches for the cover crop cost-share fields. A video demonstration from MU Extension is available on YouTube, but typically, bulk density rings are about 3 to 4 inches in diameter and are driven into the ground using a hammer and piece of wood. A shovel or scoop may be needed to remove the ring from the soil, scraping off the bottom of the sample to be even with the bottom of the ring for accurate volume. Be sure to follow proper procedure for bulk density rings to allow for accurate measurements — avoid compaction or repacking of the cylinder samples. If the soil is too wet or too dry, the bulk density rings will be difficult to use.
Be consistent in your sampling depth
If you are comparing your results against threshold values provided by a soil health test or rating system, check with the lab service to see what sampling depth they recommend — it can make a difference.
How much soil?
For rings, it’s best to get three to four bulk density ring samples from each zone/area being evaluated, taking the samples a few feet apart from each other. For soil probe sampling, collect at least 10 to 15 probe pulls for each designated sampling area/zone. You may end up with more soil than needed, but it is better to collect more to thoroughly represent your sample area/zone. Once the sample has been collected using a soil probe or soil ring, put it in a labeled plastic bag for shipping. Keep samples from each area/zone in separate, labeled bags.
Check with your service lab for specific information on how much soil is needed.
Take-home message about sampling for soil health tests
Overall, the most important thing is to be consistent. Record your protocol so that you know what you did and can repeat it next time. Record as many of the following items as possible:
- GPS coordinates of the center of your sample area (or measurements from a permanent post or marker)
- Soil depth of your samples
- Crop or residue on the field when sampling
- Proximity of samples to crop or cover crop row
- Most recent precipitation event
- Soil moisture — dry, moist or wet?
- Date of most recent tillage activity and type of tillage implement
- Date of application of other amendments (manure, NPK, lime, etc.)
- Label recorded on each sample bag
An example table and a blank table for recording this information are provided in Figures 3 and 4.
As a reference, take a picture of the soil and residues on the soil surface when you sample. A picture really is worth a thousand words.
This may seem like a lot of detail, but the more consistent you are when sampling, the better results you’ll get. When you are talking about $50 to $110 per sample, it’s important.
Figure 3. Sample soil health sampling conditions table.
Figure 4. Blank soil health sampling conditions table.
Choosing a lab and soil health tests
The next section will describe most of the soil health test options available at the University of Missouri Soil Health Assessment Center as well as many common tests available from other commercial soil testing laboratories. Here are a few points to keep in mind when choosing tests and labs:
Consistency
You should select the same lab and the same test(s) each time you do soil health testing to be able to monitor and compare results over time. Protocols and procedures vary between labs and even small differences in testing can skew your results. Once again, be consistent.
Shipping
It’s important to know shipping requirements before you select soil health tests. Some tests require field-moist soil samples to be kept on ice and sent overnight (or refrigerated until you can mail them as soon as possible) to obtain accurate measurements. One example of this is the phospholipid fatty acid analysis described in more detail later. If shipping and handling requirements for a test are not feasible for you, you should not select that test. Avoid wasting your money on analyses that won’t provide meaningful results. You can limit your soil health testing to simpler soil health tests (indicators) as needed.
Packages
Many soil health tests are available as a test package that includes at least five or more soil health indicators for each soil sample. These test packages usually also include an overall soil health score or index value that incorporates the results from all of the individual tests within that package. These scores can be useful to monitor your overall soil health improvements over time, but it is also important to look at the individual test results to be able to determine if any specific functions in your soils are performing poorly. These test packages range in price from $50 to $110. One example is the Comprehensive Assessment of Soil Health (CASH), available only from the Cornell Soil Health Testing Laboratory. Another is the Haney Soil Health Nutrient Tool, which is available from several different commercial soil testing laboratories. The Missouri Soil and Water Conservation Program uses a special package selected in conjunction with the University of Missouri Soil Health Assessment Center.
Rather than using a test package, you may prefer to select individual tests (a la carte pricing). If you are choosing only a few tests, we suggest the following core measurements:
- soil organic carbon
- active carbon
- aggregate stability
- soil protein
These indicators have been shown to be sensitive to crop management practices and thus provide a good soil health assessment for Midwest soils.
Description of common soil health measurements (indicators)
Below are a list of some of the most common soil health measurements, with short descriptions of each measurement or indicator. Measurements that are considered the most proven have been designated as “Tier 1” soil health measurements through a national scientific panel convened by the nonprofit Soil Health Institute and USDA-NRCS. Tier 1 measurements listed below are marked with a single asterisk (*). Soil health measurements that are likely to gain in popularity as new research is completed are Tier 2 indicators and are marked with two asterisks (**). Indicators that are part of the Missouri SWCP are marked with a dagger (†).
Soil organic carbon (organic matter)*†
This is a keystone soil health measurement that determines the amount of carbon stored in the organic matter within the soil. It is closely related to many soil processes, including nutrient cycling, water infiltration and holding capacity, soil structure, and microbial biomass and activity. It may be measured as soil organic matter or total soil organic carbon. Soil organic matter is a very common measurement, but often does not change as rapidly due to management as some other soil health indicators. To calculate percent organic matter from soil organic carbon, soil organic carbon percent is typically multiplied by 1.72.
Interpretation of results
We want to see an increase in soil organic carbon over time, but your management history and specific soil and climate characteristics are going to have an impact on how much of an increase is possible with your soils. Perennial systems may already have high levels of organic matter. Sandy soils or soils in warmer climates will never be able to accumulate as much carbon as soils with more clay in cooler climates. Also, applications of manure, biochar, or other organic amendments can cause large, short-term increases in soil organic carbon, but the long-term change may be small if the amendments are rapidly broken down by microbes in the soil.
Active carbon AKA permanganate oxidizable carbon (POXC)**†
This test represents the portion of the soil organic carbon (organic matter) that is only partially decomposed and is easy for microbes to access and use as food. As a readily available food source, more active carbon can support a larger and potentially more diverse microbial community. At the same time, the heavily decomposed organic matter (microbial leftovers) can build up as stable organic carbon stocks in the soil, as microbes are less likely to use it as a food source. Because of this, active carbon is often more sensitive to changes in management than soil organic carbon (organic matter), so it can be used as an early indicator of soil health changes.
Interpretation of results
Like soil organic carbon, we are looking for higher values to indicate a larger source of food available to support the microbes and greater soil health.
Water extractable organic carbon and nitrogen (WEOC and WEON)
This test measures the carbon and nitrogen extracted from soil with water instead of harsh chemicals. These measurements are part of the Haney Soil Health Nutrient Tool. Similar to active carbon, this test aims to represent a readily available food source for microbes, since it involves measuring carbon and nitrogen that dissolve easily in water.
Interpretation of results
As with other soil health measurements related to organic matter, we are looking for increasing values with higher soil health. Similar to active carbon, this indicator represents a pool of organic matter that potentially supports the microbial community. However, it also represents a pool of carbon and nitrogen that may be easily lost in runoff or through leaching.
Aggregate stability*†
Aggregate stability is an indicator of the soil’s ability to withstand erosion and other forces. Aggregates are particles of soil held together by glues primarily formed from microbial products as well as fine roots and fungal hyphae (filament-like structures). Stable aggregates reduce soil crusting and allow for better water infiltration, which reduces wind and water erosion. Better aggregate stability is also associated with improved habitat for plants and soil microbes, including more optimal soil moisture and oxygen levels within the soil. Aggregate stability is closely related to the organic matter content of the soil as well as soil texture, mineralogy, and microbial activity. Several different methods for measuring aggregate stability exist. Although different aggregate stability methods show the same management trends, the values can be quite different, so be consistent with the lab and method when monitoring this indicator over time.
Interpretation of results
This indicator is generally reported as a percentage of water-stable aggregates (% WSA), which is the percentage of the soil aggregates that do not break apart in water after being submerged repeatedly. Aggregate stability may sometimes be reported as an index of multiple stable aggregate sizes. In contrast, a sprinkle infiltrometer is used by the CASH to simulate rainfall disturbance rather than submergence. Higher values of WSA indicate more stable aggregates and better physical soil health.
Autoclave citrate extractable (ACE) soil protein**
Most of the nitrogen within soil organic matter is stored as proteins in soil microbial biomass. The proteins in this indicator serve a dual function as both an estimate of the amount of organic nitrogen that is cycling through the microbial biomass and the hyphae that act as glue for aggregation (see Aggregate stability). This represents a fraction of nitrogen that may be released into the soil in plant-available forms during the growing season.
Interpretation of results
Like other measurements related to soil organic matter, we are looking for higher values of soil protein. This means there are more soil microbes and there is more organic nitrogen available in the form of microbial proteins. These proteins act as structural supports for aggregation and as an organic nitrogen pool that can eventually cycle into plant- available forms to support crop growth. There are other soil health indicators that provide information related to organic nitrogen, such as potentially mineralizable nitrogen (PMN).
Potentially mineralizable nitrogen*†
This test measures the amount of organic nitrogen in the soil that may be converted into a plant-available form over a period of time. This indicator reflects both the organic nitrogen pool as well as the size and activity of the microbial community. Similar to the ACE Soil Protein measurement, it is an organic nitrogen pool, but it also reflects the activity of the microbes, similar to soil respiration. There are several variations of PMN tests available from different labs. The seven-day anaerobic test is the most common. Some labs subtract the initial inorganic nitrogen levels from the final value, while other labs do not. Therefore, as with all tests, be consistent when selecting a lab and a method. This indicator has been evaluated as a nitrogen fertilizer credit for farmers, but field conditions are very different from the laboratory, and there are many difficulties with using PMN for nitrogen fertilizer recommendations.
Interpretation of results
Looking for higher values, but excessively high values can indicate that losses to the atmosphere or leaching may occur.
Soil respiration*
Sometimes referred to as short-term carbon mineralization, soil respiration represents overall microbial activity as soil organic matter is broken down into CO2 over a period of time. Increased soil respiration is generally associated with increased soil organic carbon (organic matter) and a larger community of soil microbes. Soil respiration methods differ based on the length of incubation time and other important details. The most commonly available versions are the 96-hour/four-day measurement available from Missouri Soil Health Assessment Center and in the CASH, or the 24-hour “CO2 burst” measurement incorporated into the Haney Soil Health Nutrient Tool.
Interpretation of results
Like other measurements related to soil organic matter, we are looking for higher values of soil respiration. In general, higher values indicate more microbial activity and/or a larger microbial population, and reflect more soil organic matter. However, it should be noted that laboratory soil respiration measurements do not represent what soil microbes are doing in a field setting, but reflect relative differences in the potential for microbial activity and differences in the quality or quantity of the food source available to the microbes.
Enzyme activities**
Enzyme activities reflect the potential for microbes to convert and cycle nutrients through the soil system. This represents both the availability of soil nutrients and the size and activity of the microbial community. There are many different enzymes that can be measured in soil. Some of the most common are beta-glucosidase (BG) for carbon, N-acetyl-beta-D-glucosaminidase (NAG) for nitrogen and carbon, arylsulfatase for sulfur, and acid/alkaline phosphatase for phosphorus cycling.
Interpretation of results
Generally, higher enzyme activities are indicative of more healthy soils as they indicate better nutrient cycling and availability in the soil.
Phospholipid fatty acids**
This test provides an estimate of the size of the microbial community and information about general microbial groups within the soil. This test can track how the microbial community is shifting following a change in management. It is recommended that you wear non-latex gloves during soil sampling to avoid contamination. Samples must be shipped overnight on blue ice or kept frozen until overnight shipping is available.
Interpretation of results
Results from PLFA testing are challenging to interpret because there are currently no thresholds for individual measurements, and short-term changes in weather (temperature and moisture) can have a big impact on results. An increase in the fungi to bacteria ratio can be an indication of improved soil health. Some labs provide gram-positive to gram-negative bacteria and stress ratios that can provide more information about the microbial community composition; these are generally expected to decrease with better soil health. Certain microbial groups can be especially important, such as arbuscular mycorrhizal fungi (AMF), which play an important role in contributing to scavenging for nutrients and water through their symbiotic relationships with plants.
There are additional soil health and soil characterization measurements that are available and commonly included in soil health test packages. Most of these should be familiar from soil fertility testing and include soil pH, CEC, exchangeable cations including Ca, Mg, K, Na, H, and Al, as well as some measurement of P. For further information about these tests, refer to your specific soil testing lab to determine which tests are available and how to interpret results. In Missouri, these tests are available through the University of Missouri Soil and Plant Testing Laboratory. The Soil Health Assessment Center offers a Basic Soil Health Package to complement the fertility test.
References and other resources
- Friedman, D., M. Hubbs, A. Tugel, C. Seybold, and M. Sucik. 2001. Guidelines for Soil Quality Assessment in Conservation Planning (PDF). U.S. Department of Agriculture, Natural Resources Conservation Service.
- Lory, J., P. Scharf, and M. Nathan. 1998. Interpreting Missouri Soil Test Reports. MU Extension G9112.
- Lory, J. and S. Cromley. 2006. Soil Sampling Hayfields and Row Crops. MU Extension G9217.
- Moebius-Clune, B.N., D.J. Moebius-Clune, B.K. Gugino, O.J. Idowu, R.R. Schindelbeck, A.J. Ristow, H.M. van Es, J.E. Thies, H.A. Shayler, M.B. McBride, K.S.M Kurtz, D.W. Wolfe, and G.S. Abawi, 2016. Comprehensive Assessment of Soil Health — The Cornell Framework, Edition 3.2, Cornell University, Geneva, NY.
- Nathan, M. V. 2012. Soil Testing in Missouri. MU Extension EC923.
- Soil Health Institute. 2017. North American Project to Evaluate Soil Health Measurements — Tier 1 and 2 Indicators.
- Zuber, S. and E. Kladivko. 2018. How to Understand and Interpret Soil Health Tests (PDF). Purdue Extension. Indiana Soil and Water Series. AY-366-W.