Introduction
According to the American Meteorological Society (AMS), evapotranspiration (ET) is “the sum of water transferred to the atmosphere by evaporation from soil and plant surfaces and by transpiration from plants” (AMS Glossary). Together, these pathways and the movement of water from the land surface to atmosphere are a major component of the hydrologic cycle, especially during the warm season when vegetation is active and water demand is high.
As temperatures rise and solar radiation increases during spring and summer, ET rates increase. This decreases soil moisture, lowers water availability for vegetation, and increases humidity in the lower atmosphere. In Missouri, ET plays a central role in shaping local climate and weather patterns during the growing season. Higher ET and near-surface humidity can contribute to elevated heat index values, the “feels-like” temperature combining air temperature and humidity, which can worsen the effects of summer heatwaves, affecting both public health and agricultural productivity.
ET can also influence moisture gradients, or local to regional scale differences in atmospheric humidity, which interact with large-scale weather features like fronts, troughs, and pressure patterns. These gradients can also enhance local instability, increasing the likelihood of thunderstorm initiation or strengthening existing convection.
Missouri’s landscape adds further importance to this relationship. As of the 2022 USDA Census of Agriculture, cropland covers about 33% of the state, with corn accounting for approximately 21% of that area. Corn and similar annual crops have high transpiration rates during certain parts of their growth process, meaning that agricultural evapotranspiration can contribute significantly to regional moisture differences. These effects are not only critical for plant development and yield but also for understanding the feedbacks between land use and weather.
Understanding ET in Missouri is essential due to its wide-reaching effects on moisture, agricultural water use, human and animal comfort. ET governs complex interactions with the land and atmosphere making it a key variable in climate monitoring, forecasting, and long-term resource planning.
Given the importance of evapotranspiration (ET), there is growing interest in measuring and analyzing its patterns and trends across Missouri. This study seeks to better understand how ET impacts annual vegetation and atmospheric processes. For example, “corn sweat”, a term commonly used to describe an increase in transpiration near peak corn maturity, can increase regional humidity and this added moisture can raise the heat index, intensifying health risks during periods of extreme heat.
In agricultural settings, ET is vital for managing soil moisture. Many producers use rainfall measurements to help manage their crops, but comparing these measurements to ET provides a clearer picture of the entire water balance. When ET exceeds precipitation, especially during drought, soil moisture can decrease below the wilting point, stressing crops and reducing yields. ET data also helps to optimize irrigation. By adjusting water use based on real-time ET rates, farmers can avoid over or under-watering. Many modern systems now rely on ET-based models to automate irrigation and plan water budgets more efficiently.
Additionally, ET is a core variable in predictive models for both crop yield and atmospheric behavior. This study explores how ET responds to key climate factors, including temperature, drought, seasonality, and the El Niño-Southern Oscillation (ENSO). A focused case study on the 2012 drought will analyze how PET responded during this extreme event, providing insight into ET’s behavior under environmental stress.
To conduct this analysis, data from the Missouri Mesonet were used. While direct measurements of ET are limited, the Mesonet provides high-quality meteorological data used to calculate potential evapotranspiration (PET). Daily PET values were averaged to weekly and monthly scales to support comparisons with broader weather and climate patterns. These longer timescales provide context for understanding ET variability and lay the groundwork for future research on land–atmosphere interactions in Missouri and beyond.
Section 1: Climatology of potential evapotranspiration
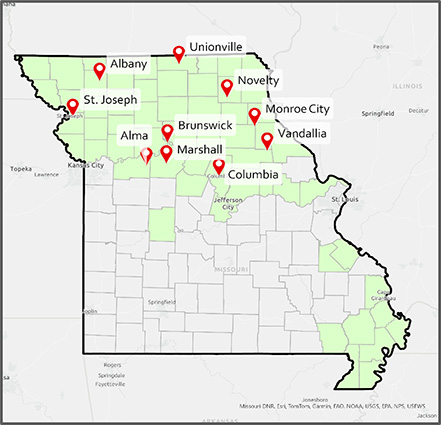
This section first examines a climatology of PET to better understand the seasonality and spatial patterns of ET. PET is a calculated as an estimate of actual ET. It is defined as the amount of moisture that, if available, would be removed from a given land area by evapotranspiration. Data were collected from the Missouri Mesonet, a network of automated weather observation stations located throughout Missouri, shown in Figure 1. These stations measure temperature, humidity, pressure, wind, precipitation, and solar radiation.
While ET cannot be directly measured at these sites, PET is calculated using temperature, solar radiation, humidity, and wind measurements. These variables were collected from January 1, 2010, to January 1, 2024, on a daily time scale and then averaged to weekly, monthly, and annual timescales.
The objective of this study is to examine trends and patterns of PET in areas with potentially enhanced ET from crop production. We selected Mesonet sites in northern Missouri, which contains the state's largest concentration of cropland within the Corn Belt region. Southern Missouri, by contrast, is largely dominated by forest, rangeland, or irrigated cropland where ET dynamics differ significantly. Future research will investigate ET behavior across varying land cover types.
The annual cycle of PET

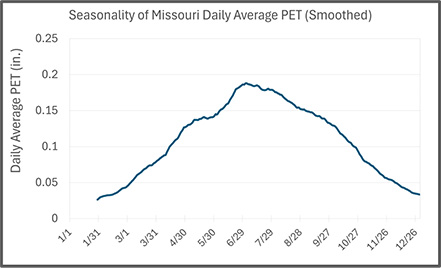
To calculate the seasonality of daily average PET, the daily PET data were averaged across all stations for the years of 2010-2024 (Figure 2). Throughout the year PET increases rapidly to its peak in early June, followed by a slower descent into the cold season. The annual cycle of PET can is tied to seasonal variations in solar radiation, temperature, and day length. The sharp increase in spring corresponds to rising temperatures and longer days which enhances the energy available for evaporation and plant transpiration. The gradual decline after the summer peak reflects decreasing solar radiation and cooler temperatures in the fall and winter. This pattern provides valuable insight into the timing and magnitude of moisture availability, plant water use, and potential impacts on agricultural practices and drought monitoring across Missouri. During a summer period with higher than average PET, actions might include increasing irrigation to compensate for greater water loss in crops or adjusting watering schedules for lawns and gardens to prevent drought stress. Understanding these seasonal trends also supports better predictions of water balance and ecosystem responses to changing climate conditions. Figure 3 displays the same seasonality of daily average PET using a 30-day moving average. This method smooths the daily variations in PET and helps to easier analyze the variability throughout the year. The smoothed graphs help to visualize when PET begins to decrease during the summer months and highlights the variability in PET seen in April and May when rainy periods can reduce PET.
The annual cycle of temperatures and precipitation
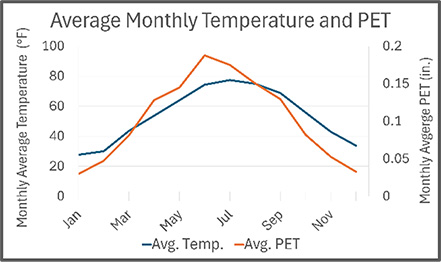
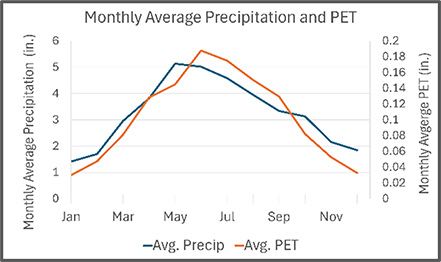
We can further understand PET by comparing it to other climatological factors such as temperature and precipitation. Figure 4 shows that as the monthly temperature increases, PET also increases. The annual cycle of PET and the annual cycle of temperature align very similarly throughout the entire year further reinforcing the relationship. Another important observation is the time lag between PET and temperature. PET peaks in early June while temperature peaks around mid-July. PET reaches its peak when the sun’s angle and energy is highest around the summer solstice. During this time, mature crops concurrently release copious amounts of moisture into the atmosphere through transpiration. Examining average monthly precipitation in the same fashion (Figure 5), the seasonality of PET is similar compared with precipitation peaking in May just before the peak of PET in June.
Average annual total PET
The amount of total potential evapotranspiration that accumulates throughout the year is useful for comparing annual PET across different areas. The difference between cumulative precipitation and PET can also be used to estimate a water balance over different timescales. Across northern Missouri, average annual PET varied from 32 – 38 in. (Figure 6). The highest average annual PET was at the Columbia-Sanborn Field location.
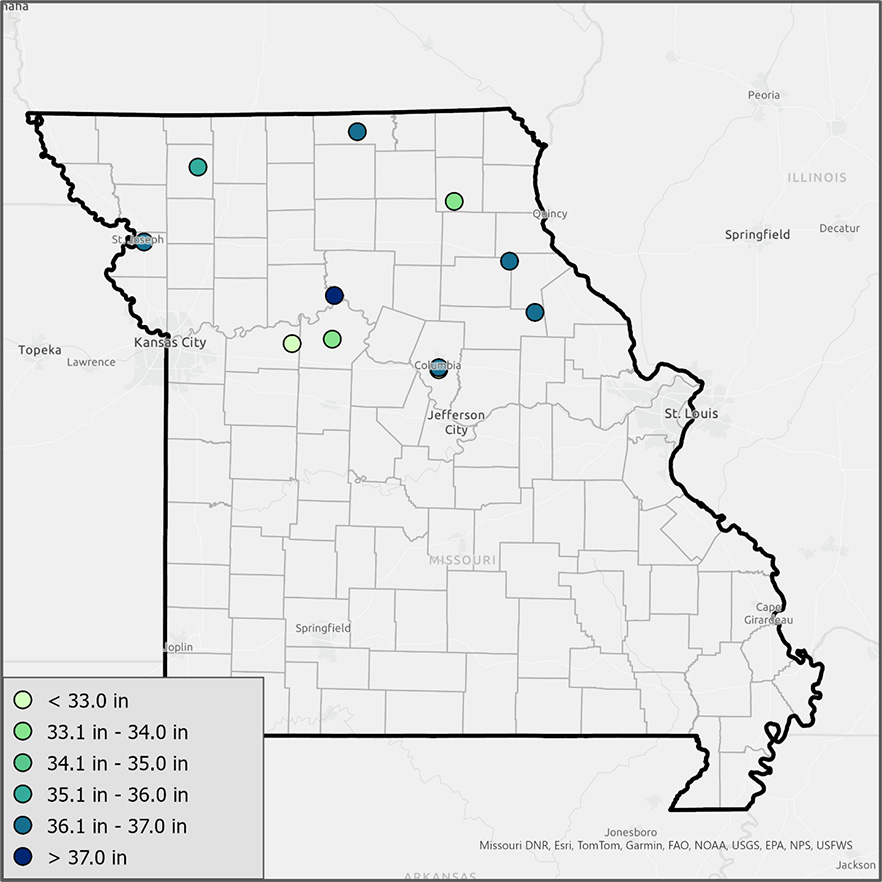
Daily maximum PET
Figure 7 displays the average highest daily PET accumulation for each site. Brunswick, Monroe City, and Vandalia all see the highest PET values on average with maximum daily values greater than 0.28”.
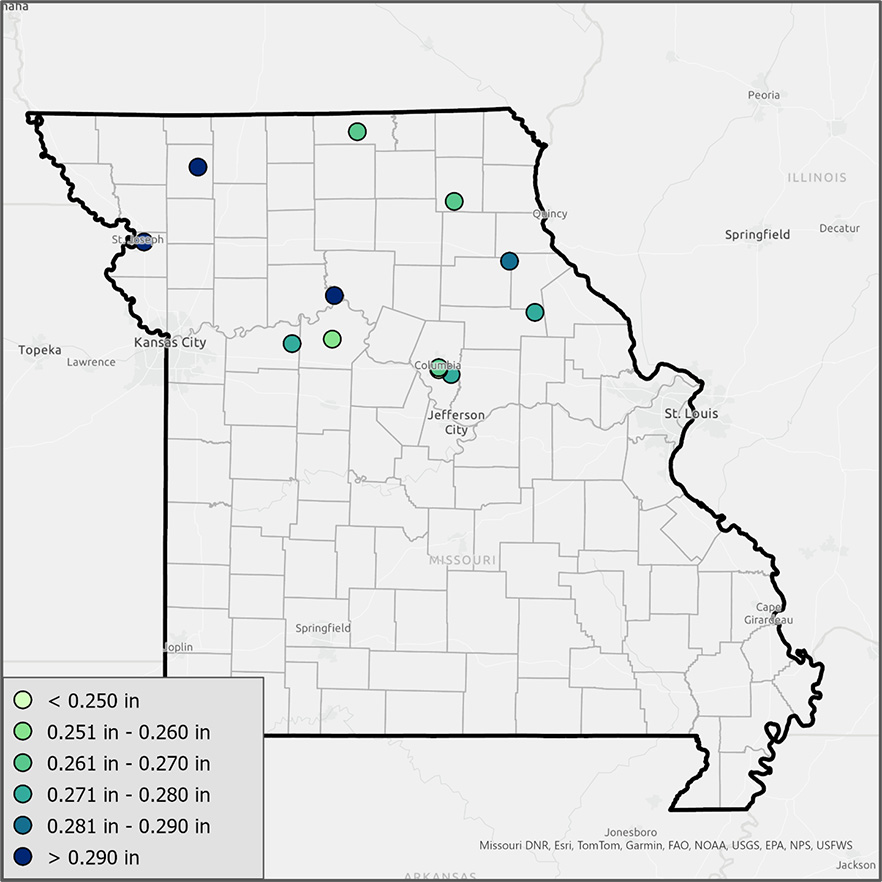
Record highest PET
Figure 8 displays the record highest daily ET accumulation for each site, which is very important for understanding in the extremes of the ET climatology in Missouri. The highest daily PET ever recorded was 0.364” on June 28, 2023.

Section 2: PET and its meteorological drivers
Understanding the seasonality of potential evapotranspiration (PET) in Missouri provides a foundational perspective on how atmospheric conditions typically evolve throughout the year. However, within this established seasonality, deviations from normal patterns can occur due to various meteorological factors, influencing both PET and overall weather conditions. These deviations, often driven by short-term weather events, highlight the transition from broad climatological trends to more immediate atmospheric dynamics.
One of the key drivers of PET variability is temperature. Heatwaves, characterized by prolonged periods of above-normal temperatures, can significantly amplify PET by enhancing evaporation rates and accelerating soil moisture depletion. The persistence and intensity of these heatwaves can contribute to drought development, reinforcing feedback loops that exacerbate temperature extremes. Understanding the relationship between temperature anomalies and PET during such periods is essential for assessing land-atmosphere interactions, including their influence on precipitation patterns and atmospheric stability.
Additionally, large-scale climate phenomena such as the El Niño-Southern Oscillation (ENSO) also affect PET fluctuations. ENSO phases, which involve oscillations between unusually warm (El Niño) and cool (La Niña) sea surface temperatures in the equatorial Pacific Ocean, typically last 9 to 12 months and recur every 2 to 7 years. These shifts influence regional weather by altering temperature and precipitation distributions, which in turn affect PET rates. ENSO may lead to drier or wetter conditions in different regions, thereby either reducing or increasing PET. Examining these teleconnections provides valuable insight into how broader climate systems interact with local meteorological processes in Missouri.
By analyzing these variations in PET within Missouri’s seasonal framework, including the influences of temperature extremes, ENSO phases, and drought conditions, we gain a deeper understanding of the interactions between climate and weather. Identifying what drives deviations from normal conditions helps contextualize broader meteorological trends and strengthens our ability to link short-term atmospheric processes with long-term environmental patterns.
Temperature and PET
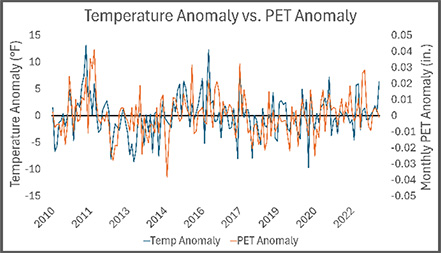
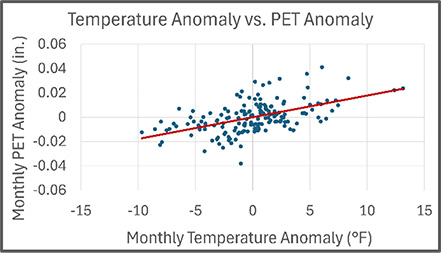
One of the most fundamental relationships in this study is between PET and temperature. Figures 9a and 9b illustrate how this relationship varies within the seasonal cycle by examining the monthly anomalies relative to the average, revealing the influence of short-term atmospheric conditions. In Figure 9a, while PET and temperature anomalies generally align, deviations occur due to transient weather patterns. Sharp increases in PET sometimes precede or exceed temperature anomalies, particularly during periods of high solar radiation and low humidity. Conversely, instances where PET lags temperature suggest the influence of higher atmospheric moisture, cloud cover, or recent precipitation events that suppress evaporation despite elevated temperatures. These fluctuations highlight that while temperature is a dominant driver, there are other variables and interactions that impact PET.
Figure 9b reinforces this relationship by showing a strong positive correlation between PET and temperature anomalies, yet the spread of the data points indicates notable variability. During summer, PET typically reaches its highest values, however, the range of PET anomalies for a given temperature anomaly suggests that other atmospheric factors, such as wind speed, soil moisture availability, and atmospheric mixing, influence the magnitude of evapotranspiration. The clustering of points along a steeper slope in warmer months suggests that PET is more sensitive to temperature variations when energy availability is highest. In contrast, during cooler months, the correlation appears weaker, likely due to shorter daylight hours and lower overall evaporation potential, which reduce the responsiveness of PET to temperature fluctuations.
Drought and PET
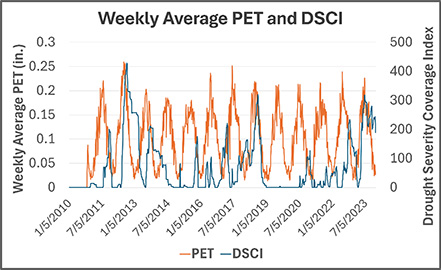
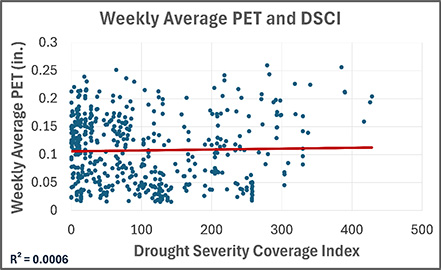
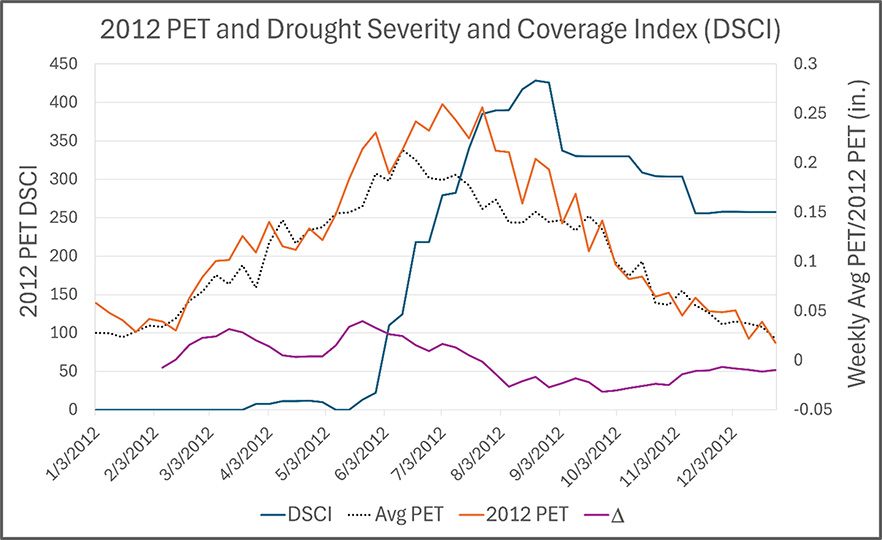
As PET interacts with other weather variables, we can take a more holistic approach and examine the relationship PET has with drought. In Figures 10a and 10b, we can identify a positive correlation between higher Drought Severity and Coverage Index (DSCI) values and higher PET values. This suggests that as drought approaches and worsens, PET responds with increased magnitude. The DSCI is calculated at a weekly timestep based on data from the U.S. Drought Monitor. A DSCI value of 0 indicates no dryness or drought conditions, while higher values correspond to increasing spatial coverage and greater severity of drought conditions. Since DSCI integrates both the extent and severity of drought across a region, it provides a robust and standardized method for assessing drought impacts. This allows for a clearer interpretation of how drought conditions evolve temporally and how closely PET tracks aligns with drought dynamics.
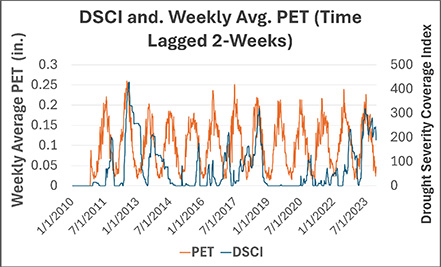
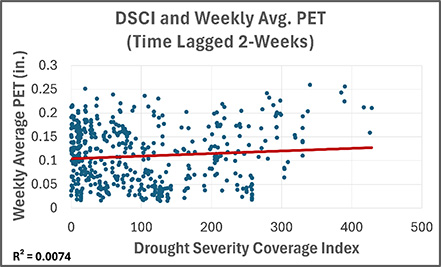
After applying a time lag, Figures 11a and 11b display a much more pronounced positive correlation. These figures again examine the relationship with the DSCI but incorporate a two-week time lag to examine how antecedent PET influences drought evolution. Results confirm that PET on average will typically show a noticeable increase in magnitude around two weeks before an uptick in drought severity or coverage. This relationship has been used recently to create evapotranspiration-based drought indices to aid meteorologists in monitoring short-term flash drought events. Such indices help experts recognize emerging drought conditions earlier, facilitating quicker and more effective responses for agricultural management and water resource planning. The predictive capability provided by this PET-DSCI relationship underscores the value of integrating evapotranspiration data into drought early warning systems.
Sea surface temperatures and PET
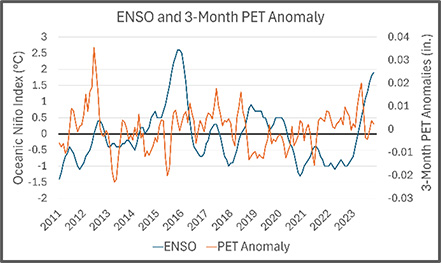
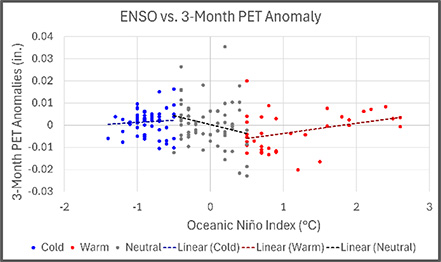
Figures 12a and 12b highlight the relationship between the Oceanic Niño Index (ONI) and average seasonal potential evapotranspiration (PET) anomalies in Missouri, revealing distinct patterns across different ENSO phases. Compared to the previous figures, these graphs show a marked difference in the behavior of PET in relation to ENSO variability. Most notably, the trendline have a different sign depending on the ENSO phase, with a positive relationship during cold (La Niña) phases and warm (El Niño) phases, with neutral phases displaying a negative trend. This divergence suggests that the phase of ENSO plays a significant role in modulating PET in Missouri. A closer examination of the time series in Figure 19a shows that during La Niña and El Niño events, PET anomalies often increase, sometimes subtly but at times with more pronounced spikes. This supports a consistent correlation between stronger ENSO phases and elevated PET values.
These results are meteorologically consistent with the known impacts of ENSO on Missouri’s climate. La Niña typically leads to cool and drier conditions across the central United States during the cool season and into spring, which can set the stage for increased PET heading into the growing season. El Niño phases often bring warmer and wetter conditions to Missouri, particularly during late fall and winter, which can suppress PET by increasing cloud cover, and enhancing soil moisture availability. These seasonal atmospheric shifts help explain that PET in Missouri is not only influenced by local weather conditions but also by large-scale climate patterns like ENSO. Understanding these teleconnections is crucial for improving seasonal drought outlooks and enhancing long-term water resource planning across the region.
Section 3: The drought of 2012 (a case study)
Overview
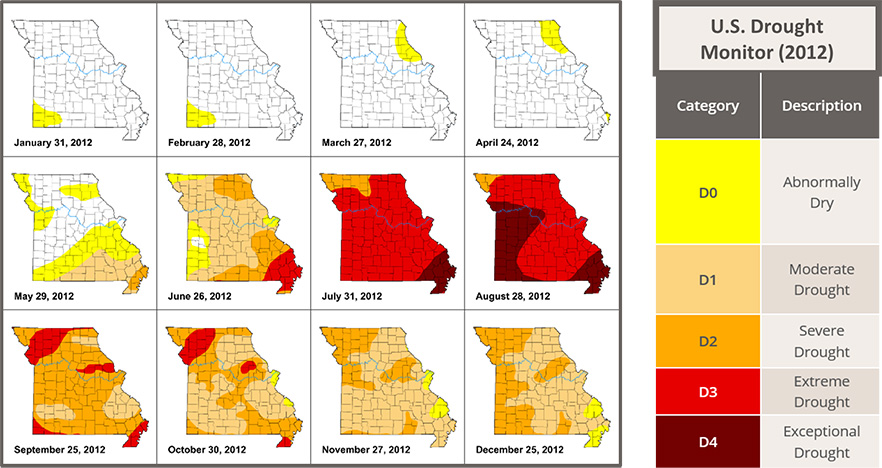
Beginning in the late spring of 2012, a widespread and historic drought took hold of Missouri and much of the United States with bone dry conditions that decimated hundreds of thousands of acres of cropland, and cost billions of dollars in losses across the country. Coming off the heels of a historically active year for severe weather in 2011, unusually warm and dry conditions began to set in during Spring 2012. It wasn’t until May, however, that drought conditions began to spread in the Bootheel of Missouri and 2.5% of the state was classified as D2 (Severe Drought) by the USDM (Figure 13). From there, as spring turned to summer, conditions also took a turn for the worse. At the end of June, conditions emerged with D3 (Excessive Drought) conditions emerged. Just one month later, those conditions spread throughout almost the entirety of Missouri with nearly 85% of the state classified with at least D3 drought conditions, while D4 (Exceptional Drought) conditions appeared in the bootheel region. D4 drought conditions eventually covered approximately 35% of the state. The state recorded its highest DSCI value ever of 428.5 on August 21st, 2012. Thankfully, on the last day of the month, the remnants of Hurricane Isaac made their way across southern Missouri, and for most of Labor Day weekend, widespread, steady rain finally brought relief to the state. In September, cooler temperatures paired with much needed rain brought further relief to the region and conditions continued to improve as autumn took hold.
The drought of 2012 — climatology
Average potential evapotranspiration
One of the most interesting findings from our research into PET is the relationship between potential evapotranspiration and drought. Missouri frequently experiences drought conditions due to its location near the boundary between humid continental and humid subtropical climate zones, where variability in jet stream patterns and periodic shifts in atmospheric circulation often result in extended periods of dryness. This relationship was discussed in Section 2, and this analysis is expanded using the 2012 Drought as a case study.
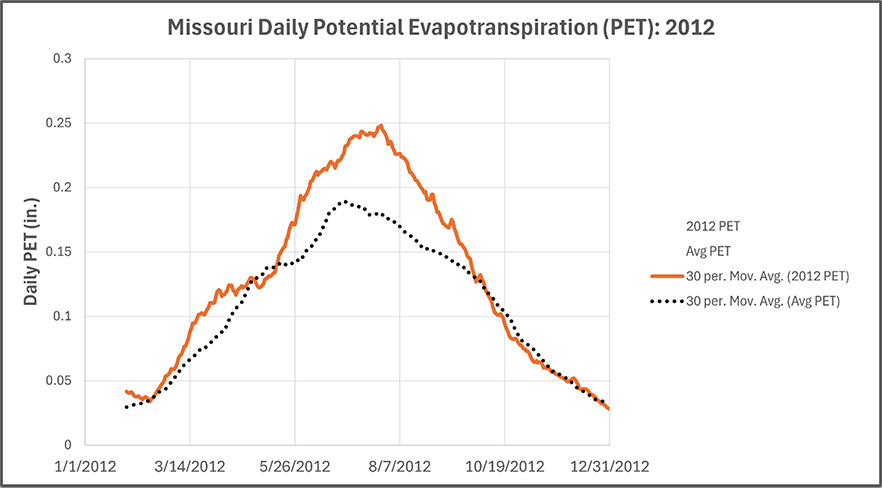
Figure 14 displays the daily average PET averaged across all stations for 2012. Overall, PET was substantially higher than normal during 2012, especially during the early Spring and growing season. The first few weeks of May experienced a notable spike in PET, due to abnormally warm temperatures, clear skies, and reduced humidity, facilitating increased evapotranspiration. Conversely, the sharp decline in PET during early October can be attributed to cooler temperatures and increased cloud cover, which significantly reduced evapotranspiration rates. When examining the differences in accumulated annual ET, the total for 2012 clearly exceeded the long-term average, emphasizing the year's anomalously intense evapotranspiration and highlighting its critical role in intensifying drought impacts across the region.
The El Niño southern oscillation
Another subtle, yet important climatological feature that can affect drought, and provide additional context, is the El Niño Southern Oscillation (ENSO). This oscillation is responsible for changes in sea surface temperatures (SSTs) in the equatorial Pacific Ocean. SST anomalies in this region can modulate the strength and placement of the upper-level jet stream that flows over the United States. Traditionally ENSO is measured using the Oceanic Niño Index (ONI) which uses SST anomalies of +/- 0.5°C in the Niño-3.4 region to determine an ENSO phase. Temperatures above 0.5°C constitute a warm or El Niño phase, while those colder determine a La Niña phase. Temperatures that fall in between +/- 0.5°C categorize a neutral ENSO phase.
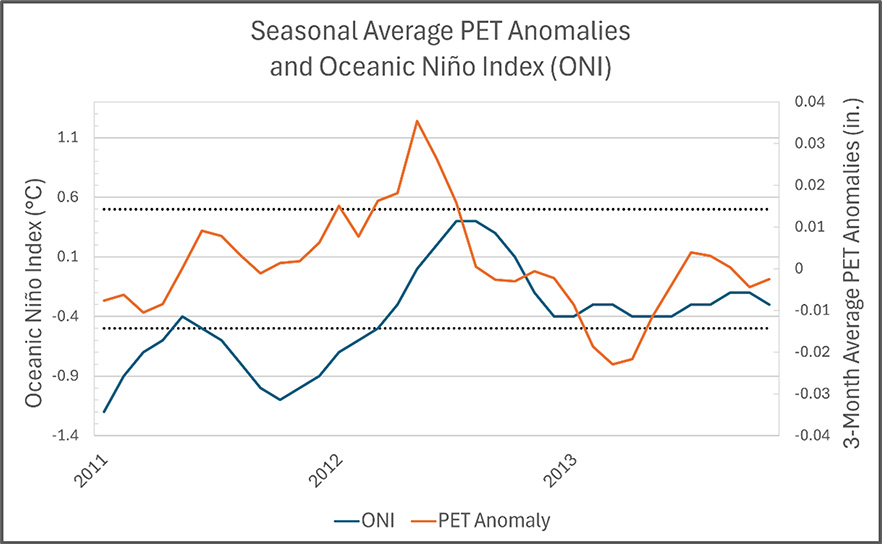
Figure 15 shows the ONI and seasonal average PET anomalies from 2011 to 2013. During 2011, ENSO was in a strong La Niña phase that persisted throughout much of 2012. During the summer of 2012, SSTs in the southern Pacific climbed slightly above average as ENSO transitioned to a neutral phase where it would remain through 2013. A noticeable trend on this chart is how PET anomalies tended to mimic the slope of ONI throughout the period, suggesting ENSO may have played a role in the magnitude of PET leading up to drought event in 2012. Figures 12a and 12b show a positive relationship between the DSCI and La Niña and this also occurred in 2012.
2012 water balance using PET and precipitation
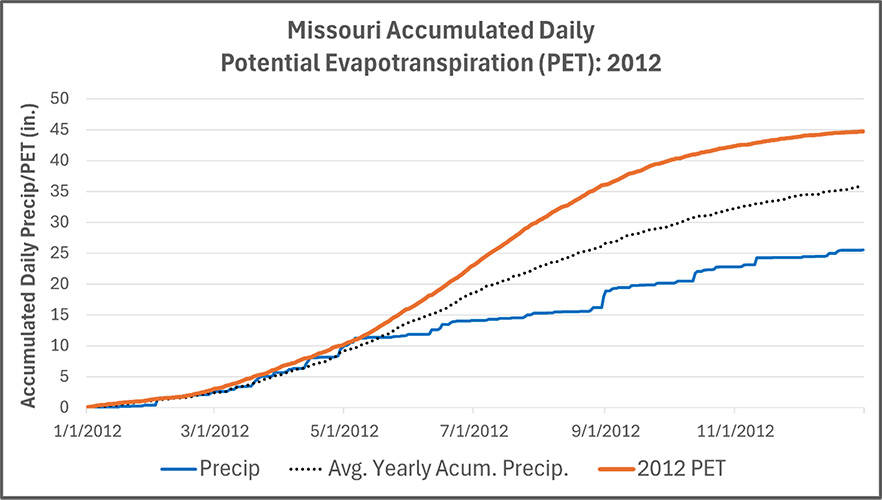
Figure 16 displays the water balance for 2012 using accumulated daily precipitation and potential evapotranspiration. This comparison between PET and precipitation is very important in determining drought conditions and the overall budget of water at the surface. This graph shows the large precipitation deficits in Missouri during this event. With such a low water balance, there were massive effects on agriculture. Plants had less water available for uptake, leading to increased water stress, reduced growth, and, in severe cases, plant mortality. As moisture levels declined, the water table also dropped, making it even more difficult for plant roots to access groundwater reserves. This decline in groundwater levels further impacted ecosystems, reducing the availability of water for streams, wetlands, and other surface water bodies that rely on underground flow.
The drought of 2012 — meteorology
The synoptic-scale setup
Synoptic-scale patterns play a crucial role in the development and persistence of drought conditions by influencing large-scale atmospheric circulation. Persistent ridging, trough placements, and jet stream behavior can either enhance or suppress precipitation over a region. To better understand the meteorological drivers of this drought, we will analyze a few notable upper-air maps from the height of the drought event. Using these, we can identify key features that provide insight into how atmospheric dynamics contributed to the prolonged dry conditions.
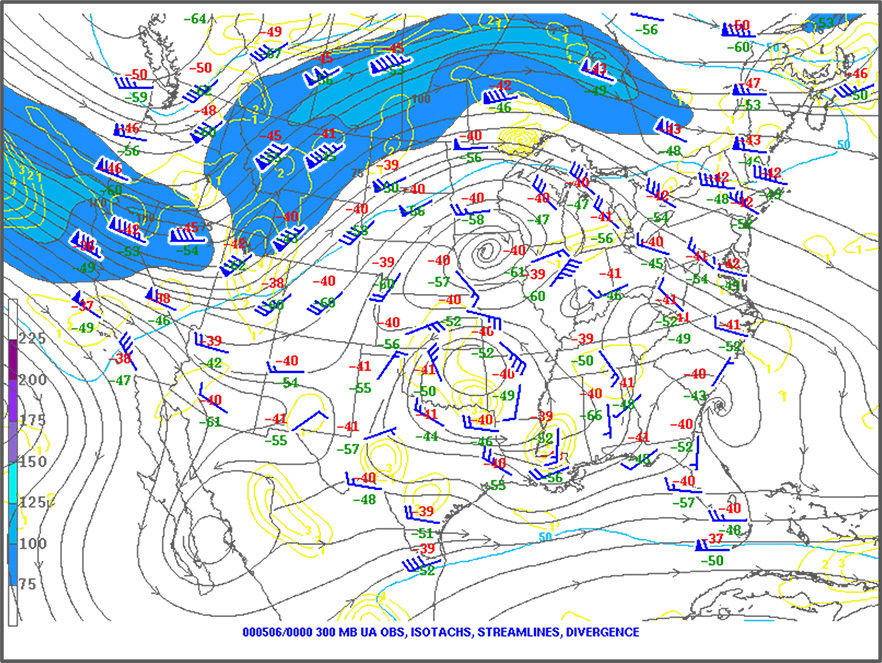
The first signs of a major drought appeared in May, when the US Drought Monitor introduced D1 drought intensity across most of southern Missouri, along with a small area of D2 intensity in the bootheel region. Figure 17 shows the 300mb upper-air observations for 00z on May 6th, 2012, highlighting an intense high-pressure ridge centered over the central United States and extending northward into Canada. A jet streak rounding the base of a negatively tilted trough in the Pacific Northwest flows over this prominent ridge, promoting clear, dry weather across the upper Midwest and northern Great Plains.
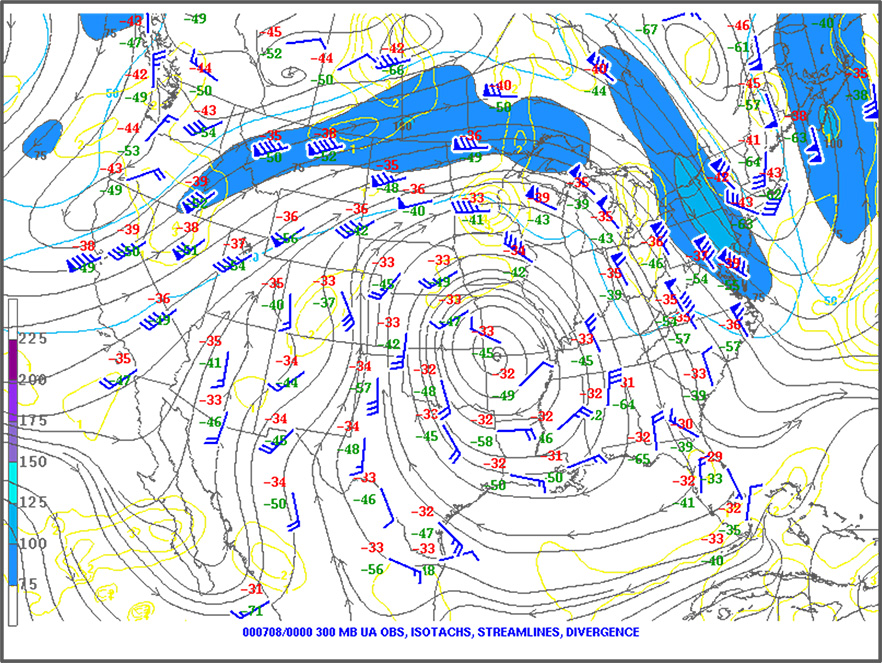
In July, extreme drought conditions took hold of the state of Missouri, with over 85% of the state experiencing D3 (Extreme Drought) criteria, marking one of the most intense drought episodes in recent history. The synoptic-scale pattern for the month was dominated by a persistent and expansive high-pressure system centered over the central United States, which continually weakened and intensified, reinforcing dry conditions. As shown in Figure 18, this high-pressure system funneled a large mass of hot, dry air from the desert southwest into the Midwest, raising temperatures and further accelerating evapotranspiration. Any Gulf moisture that managed to advect inland from the south was quickly mixed out due to strong subsidence and warm, dry boundary layer conditions, eliminating any potential for widespread precipitation. The overall setup supported a subtle omega block pattern, with a weak low-pressure center over the Baja region that enhanced the transport of dry air, and another low-pressure system over the Atlantic Ocean that diverted Gulf moisture away from the central U.S. This stagnant pattern resulted in minimal frontal activity and no significant disturbances to provide drought relief. Many areas experienced prolonged triple-digit temperatures, and rivers and reservoirs dropped to critically low levels. The feedback between high PET, extreme heat, and lack of rainfall created a self-reinforcing drought loop that defined the peak of the 2012 event.
Temperatures and PET
During the 2012 drought in the central United States, several temperature records were broken. The year 2012 was the warmest on record for the contiguous U.S., with an average temperature of 55.3°F, which is 3.2°F above the 20th-century average. It was aIso Missouri’s warmest year on record. In March 2012 alone, over 15,000 high temperature records were broken across the U.S., including many in the central region. Temperatures were nearly ten degrees above average this month, with every state, including those in the central U.S., experiencing record high temperatures. Additionally, in June 2012, the Midwest experienced extreme heat, with cities like St. Louis, Missouri, reaching 108°F on June 28, 2012. This broke the previous record temperature of 105°F set in 1954. Both St. Louis and Columbia experienced their warmest year on record during this time.
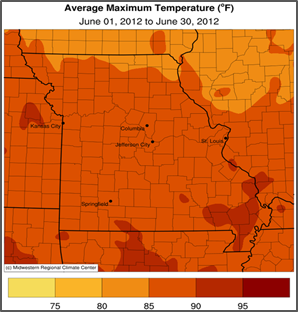
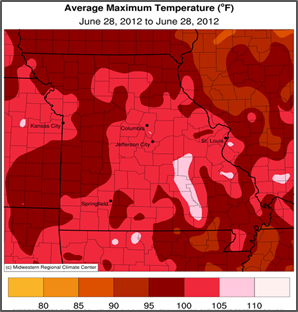
These record-breaking temperatures coincided with extremely high PET values, as shown in Figures 20a and 20b below. Drought conditions and high PET can make the apparent temperature warmer because there’s less moisture in the soil and air to cool the surface through evaporation. With less moisture available, the boundary layer, or the lowest part of the atmosphere, stays drier and heats up more quickly. On days like June 28th, 2012, statewide PET spiked to an incredible 0.309 inches, well above the June average of 0.232 inches, reflecting how intense the drying power of the atmosphere was during this extreme heat.
Figures 20a and 20b provide critical insight into the 2012 drought in Missouri by illustrating the strong relationship between temperature and potential evapotranspiration (PET) during that year. In Figure 20a, the time series shows that both daily average temperature and PET rose sharply through the spring and peaked during the summer months, coinciding with the height of the drought. These elevated values reflect the intensifying atmospheric demand for moisture, with sustained high temperatures driving higher PET rates and exacerbating soil moisture loss. Figure 30b further emphasizes this relationship with a scatterplot showing a clear positive correlation between PET and temperature. As daily average PET increases, daily temperatures also rise, reinforcing the idea that higher temperatures during the drought directly contributed to increased evaporative demand. Together, these figures underscore how extreme heat amplified drought severity in 2012 by increasing PET, placing additional stress on already limited water resources in Missouri.
Response of PET to the drought
Figure 21 shows how weekly average PET compared to the Drought Severity and Coverage Index (DSCI) during 2012. A rapid increase in PET occurred just before the onset of widespread drought, as indicated by the sharp rise in the delta PET line, highlighting a sudden increase in atmospheric moisture demand that likely accelerated soil drying. The seasonal PET peak occurred later than average, around early July, and was followed by a sustained period of above average values that extended well into August. During the drought in 2012, not only were multiple temperature records broken, but according to our analysis of Mesonet data, sites that were active during this time showed record levels of evapotranspiration.
The drought of 2012 — summary
The 2012 drought in Missouri offers a compelling case study on the role of potential evapotranspiration (PET) in the development, intensification, and monitoring of extreme drought conditions. PET values in 2012 were consistently higher than average, particularly during the spring and early summer months, when they peaked later than normal and remained elevated into August. This prolonged increase in atmospheric moisture demand, driven by persistent high temperatures, intense solar radiation, and minimal precipitation, contributed to a substantial water deficit across the state. The accumulated PET far outpaced precipitation during this period, as shown by the 2012 water balance analysis, which revealed an expanding deficit that stressed both vegetation and soil moisture. Notably, a rapid increase in PET was observed just prior to the sharp escalation of drought severity in June and July, with record PET levels recorded at several Missouri Mesonet stations. PET demonstrated a clear leading signal, increasing roughly two weeks before worsening drought conditions. This reinforces the utility of PET as a predictive tool, capable of offering early insight into drought onset before it is captured by traditional drought indices.
Additionally, the case study showed that PET anomalies tracked closely with the transition out of a strong La Niña phase in early 2012, aligning with previously established correlations between La Niña events and elevated PET in Missouri. Ultimately, this case study demonstrates how PET serves not only as a climatic response variable but also as an active driver in the evolution of drought conditions. Its behavior in 2012 emphasizes the importance of including PET in both drought monitoring systems and agricultural planning efforts, especially as climate variability continues to increase.
Conclusion
This study explored the relationship between potential evapotranspiration (PET) and key meteorological variables in Missouri, emphasizing its role in shaping local climate, drought patterns, and agricultural water management. By analyzing data from the Missouri Mesonet, we identified strong seasonal trends in PET, particularly its peak in early summer, which aligns with critical growth stages for crops. Our findings reinforce the importance of understanding evapotranspiration for optimizing irrigation strategies, predicting drought conditions, and improving overall resource management in Missouri’s agricultural sector.
Beyond agriculture, the implications of this research extend to broader atmospheric sciences. PET plays a role in land-atmosphere interactions, influencing local humidity levels, heat index values, and possibly even convective weather patterns. Given the established relationship between PET and drought, future research will explore whether high PET rates can contribute to thunderstorm initiation or intensification by increasing low-level atmospheric moisture and instability. Understanding these connections could improve weather prediction models and nowcasting techniques for severe weather, especially in agricultural regions.
However, our study has limitations. While PET is a useful proxy for evapotranspiration, it does not account for variations in soil moisture availability or vegetation-specific water usage. Additionally, our analysis primarily focused on broader climatological trends, meaning that finer scale land-atmosphere feedbacks require further investigation. Future research will aim to incorporate high-resolution PET data and additional meteorological observations into the Weather Research and Forecasting model (WRF) to refine our understanding of PET’s impact on local weather.
Ultimately, this research highlights the critical role of evapotranspiration in Missouri’s climate and agriculture. As climate variability increases, maintaining a comprehensive understanding of PET will be essential for managing water resources, mitigating drought impacts, and improving both agricultural efficiency and weather forecasting. By continuing to study these interactions, we can enhance our ability to anticipate and respond to environmental changes that directly impact farming, water availability, and extreme weather events in the region.
Appendix
The Missouri Mesonet
The Missouri Mesonet is a statewide network of automated weather stations that have been collecting data since the 1990s. To access data, navigate to the Missouri Mesonet - Weather Station Network and select your location.
Real time maps are available.
Each station’s webpage displays the previous day’s potential evapotranspiration in real time. Historical weather data including PET data can be downloaded.
These stations provide high-quality, site-specific observations of key atmospheric variables, including air temperature, relative humidity, wind speed, solar radiation, and precipitation.
To conduct this analysis, daily values for these variables were downloaded for the period January 1, 2010, to January 1, 2024, using the historical archive. Data was retrieved for all stations in the network with continuous observations during this timeframe, with a particular focus on northern Missouri, which overlaps the core of the Corn Belt and experiences elevated levels of agricultural evapotranspiration. I conducted several types of temporal aggregation and climatological analysis:
Additionally, precipitation data from the Mesonet were paired with PET to calculate surface water balance, revealing moisture deficits and highlighting drought onset and severity. This helped frame PET not just as a response variable but as a contributing factor to agricultural drought conditions.
The FAO 56 Penman-Monteith Equation for potential evapotranspiration
The FAO-56 Penman-Monteith equation is a standardized formula used to estimate reference evapotranspiration (ET₀), which is the rate at which water evaporates and transpires from a well-watered grass surface. Developed by the Food and Agriculture Organization (FAO), it combines weather data such as temperature, humidity, wind speed, and solar radiation. This equation provides a reliable method for determining irrigation needs in agriculture. By using it, farmers and water managers can better plan and manage water resources efficiently.
References
- The ASCE Standardized Reference Evapotranspiration Equation
- Step by Step Calculation of the Penman-Monteith Evapotranspiration (FAO-56 Method)
- Crop evapotranspiration - Guidelines for computing crop water requirements - FAO Irrigation and drainage paper 56
The ASCE-EWRI standardized reference ET equation based on the FAO 56 Penman-Monteith equation

Where,
- ETSZ - Standardized reference evapotranspiration [mm day-1],
- Rn - Net radiation at the crop surface [MJ m-2 day-1],
- G - Soil heat flux density [MJ m-2 day-1],
- T - Mean daily air temperature at 2 m height [°C],
- u2 - Wind speed at 2 m height [m s-1],
- eos - Saturation vapor pressure [kPa],
- ea - Actual vapor pressure [kPa],
- Cn - Numerator constant for the reference crop type and time step,
- Cd - Denominator constant for the reference crop type and time step,
- ∆ - Slope vapor pressure curve [kPa °C-1],
- γ - Psychrometric constant [kPa °C-1],
- 0.408 - Latent heat of vaporization [mm/MJ/m2].
Term by term
(1) Radiation term = 0.408∆(Rn - G)
This term calculates the energy available for evapotranspiration based on the net radiation (Rn) minus soil heat flux (G), scaled by the slope of the saturation vapor pressure curve (∆). The constant 0.408 is a conversion factor that adjusts the energy term into millimeters of water per day, reflecting the latent heat of vaporization (λ). It represents how much energy is available to drive evaporation and transpiration.
(2) Aerodynamic term = 
This term represents the evaporative demand of the atmosphere based on wind speed (u2) and the vapor pressure deficit (eos - ea). The variable gamma (γ) is the psychrometric constant, which reflects the influence of air pressure and humidity on evaporation. The term adjusted for temperature (T) and a crop-specific constant (Cn) to account for different surface types. It indicates how the atmosphere’s ability to transport moisture affects evapotranspiration.
(3) Resistance term = ∆+γ(1+Cd u2)
This term combines surface resistance (∆), which represents the resistance to water vapor movement from the crop surface to the atmosphere, and aerodynamic resistance (γ(1+Cd u2)), which accounts for the resistance due to atmospheric conditions and wind speed. The gamma (γ) is the psychrometric constant, reflecting the relationship between temperature, air pressure, and humidity. Cd is the crop-specific constant, and u2 is wind speed at 2 meters, which affects the ability of the atmosphere to remove moisture.
The Short Crop (ETos) version of the Penman-Monteith Equation

The Missouri Mesonet uses the short crop version of the FAO-56 Penman-Monteith equation to calculate daily average potential evapotranspiration based on weather data collected at each station. This helps support drought monitoring and irrigation management across the state.
Data sources
United States Department of Agriculture
We used several data products from the United States Department of Agriculture (USDA) to gather key statistics and visualizations relevant to agricultural production and drought conditions in Missouri.
The 2022 and 2017 Censuses of Agriculture provide comprehensive statistical data on corn production, including total acreage, yield per acre, and the number of farms producing corn in Missouri. This information helped me establish baseline production values and identify trends over time.
The U.S. Agricultural Commodities in Drought dataset, available through the USDA and the National Drought Mitigation Center, provides visual maps highlighting the extend of drought coverage over cropland. I used this information to determine which major crop-producing areas in Missouri were affected by drought conditions during the analysis period.
The Midwest Ag-Focus Climate Outlook, published by the USDA Climate Hubs, offers seasonal projections for temperature, precipitation, and drought risks. I referenced these outlooks to provide context for potential short-term agricultural impacts in Missouri, particularly during critical stages of the growing season.
- USDA Census of Agriculture – Missouri (2017 & 2022)
- U.S. Agricultural Commodities in Drought Map
- Midwest Ag-Focus Climate Outlooks
The Storm Prediction Center
The Storm Prediction Center (SPC), a division of the National Weather Service, specializes in forecasting severe convective weather and maintaining extensive meteorological archives. One such archive is the SPC Daily Upper-Air Analysis Archive, which contains daily synoptic scale upper-air maps derived from rawinsonde observations across the continental United States. This study used the SPC Daily Upper-Air Analysis Archive to retrieve historical 300mb upper-air amps for the Synoptic Setup section of the 2012 Drought Case Study.
The United States Drought Monitor
The United States Drought Monitor is a collaborative effort between the National Drought Mitigation Center (NDMC), the United States Department of Agriculture (USDA), as well as various divisions of NOAA and the National Weather Service, especially the Climate Prediction Center (CPC). It provides weekly assessments of drought conditions across the United States, combining quantitative data such as precipitation, soil moisture, and streamflow with expert analysis.
The Climate Prediction Center and NCEI
The Climate Prediction Center (CPC), part of NOAA’s National Weather Service, is responsible for monitoring and forecasting climate variability, including large-scale patterns such as El Niño and La Niña. The National Centers for Environmental Information (NCEI), also under NOAA, maintain one of the world’s largest archives of environmental data and provide detailed monitoring tools for assessing global climate patterns.
This project archived Oceanic Niño Index (ONI) data from the CPC and accompanying El Niño Southern Oscillation (ENSO) information and sea surface temperature (SST) datasets from the NCEI to evaluate the potential influence of ENSO on evapotranspiration trends in Missouri.
References
American Meteorological Society, 2025a: “Evapotranspiration.” Glossary of Meteorology.
American Meteorological Society, 2025b: “Potential Evapotranspiration.” Glossary of Meteorology.
American Meteorological Society, 2025c: “Derecho.” Glossary of Meteorology.
Aon Benfield, 2013: Annual Global Climate and Catastrophe Report: Impact Forecasting 2012.
Anderson, M. C., J. M. Norman, J. R. Mecikalski, J. A. Otkin, and W. P. Kustas, 2007: A climatological study of evapotranspiration and moisture stress across the continental United States based on thermal remote sensing. J. Geophys. Res.: Atmos., 112, D11102.
Hobbins, M. T., D. J. McEvoy, and C. Hain, 2017: Evapotranspiration, evaporative demand, and drought. In Drought and Water Crises, CRC Press, 167–190.
Hobbins, M. T., A. Wood, D. J. McEvoy, et al., 2016: The Evaporative Demand Drought Index. Part I: Linking drought evolution to variations in evaporative demand. J. Hydrometeor.
Lorenz, D. J., J. A. Otkin, M. Svoboda, C. R. Hain, M. C. Anderson, and Y. Zhong, 2017: Predicting U.S. Drought Monitor states using precipitation, soil moisture, and evapotranspiration anomalies. J. Hydrometeor.
Lorenz, D. J., J. A. Otkin, B. Zaitchik, C. Hain, and M. C. Anderson, 2021: Predicting rapid changes in Evaporative Stress Index (ESI) and soil moisture anomalies. J. Hydrometeor.
McEvoy, D. J., J. L. Huntington, M. T. Hobbins, et al., 2016: The Evaporative Demand Drought Index. Part II: CONUS-wide assessment against common drought indicators. J. Hydrometeor.
Missouri Climate Center, 2025: Missouri Climate Summary for 2012. University of Missouri Extension.
Mo, K. C., and D. P. Lettenmaier, 2018: Drought variability and trends over the central United States in the instrumental record. J. Hydrometeor., 19(7).
Rind, D., R. Goldberg, J. Hansen, C. Rosenzweig, and R. Ruedy, 1990: Potential evapotranspiration and the likelihood of future drought. J. Geophys. Res.: Atmos., 95, 9983–10004.
Um, M. J., Y. Kim, D. Park, et al., 2020: Impacts of potential evapotranspiration on drought phenomena. Sci. Total Environ., 703, 135590.
Zhao, M., Y. Liu, and A. G. Konings, 2022: Evapotranspiration frequently increases during droughts. Nat. Clim. Change, 12(11), 1024–1030.
Zotarelli, L., M. Dukes, C. C. Romero, K. W. Migliaccio, and K. T. Morgan, 2024: Step by Step Calculation of the Penman–Monteith Evapotranspiration (FAO-56 Method). EDIS Publication AE459