Crop-residue management through conservation tillage is one of the best and most cost-effective ways to reduce soil erosion. Conservation tillage and residue management may reduce machinery expenses and save soil, labor, fuel and money. Crop residues uniformly distributed over the soil surface will significantly reduce soil losses over an entire field. On terraced land, the resulting reduction in soil losses due to this residue cover can greatly reduce the cost of terrace maintenance.
The erosion process
Two mechanisms are involved in soil erosion: soil detachment and soil transport. Most soil detachment is caused by raindrop impact, a major factor in sheet erosion. The average erosion from cropland in Missouri is about 10 tons per acre per year, equivalent to about 0.07 inches (slightly over 1/16 inch). Sheet erosion can go almost undetected for years, often causing great losses in productivity before the landowner becomes concerned.
Some soil detachment is caused by flowing water, especially where water concentrates to cause gullies. Gullies created by flowing water may be either ephemeral or permanent gullies. Short-lived gullies may be filled in by heavy tillage operations but tend to reform annually in the same location.
How residue reduces erosion
Residue (and crop canopy) can reduce soil detachment by absorbing the impact of falling raindrops. Also, residue may form small dams which retard runoff and create puddles of water that can absorb raindrop energy, thus reducing both detachment and transport of soil particles.
Sufficient amounts of crop residue left on the soil surface can almost eliminate erosion on many fields and greatly reduce erosion on other fields. In areas of concentrated water flow, such as natural or designed drainage ways, crop residues alone generally are not enough to control erosion. Such areas may require permanent grass seedings and/or some structural measures such as diversions or terraces (especially to control gully erosion). On long slopes, detached crop residues may be floated away by the higher water velocities attained in sheet flow. Once removed, erosion due to detachment and transport will accelerate. Terraces and diversions, in combination with crop residues, may be needed to control sheet erosion.
Conservation tillage defined
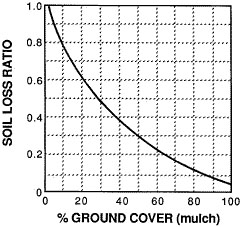
Conservation tillage is defined to be any tillage/planting system which leaves at least 30 percent of the field surface covered with crop residue after planting has been completed. Figure 1 shows that erosion is reduced by at least 50 percent (compared to bare, fallow soil) if 30 percent of the surface is covered with residue.
Enhancing residue management
Residue management (through conservation tillage) for erosion control can be enhanced by:
- Selection of crops that produce large amounts of residue (such as corn and grain sorghum) and/or a high degree of soil cover per pound of residue (such as wheat).
- Selection of a crop sequence that frequently renews the residue cover (e.g., double-cropping or use of winter cover crops).
- Use of crops that provide long-lasting residue (i.e., crops with a high carbon-to-nitrogen ratio, e.g., wheat).
- Uniform spreading of the residue by the combine (combines with headers 20 feet, or wider, may require special chaff spreaders).
- Minimizing the loss of cover due to tillage operations.
- Use of irrigation to produce high-yielding crops, especially in drought years.
Other conservation tillage benefits
Minor benefits from conservation tillage may result from less tillage leaving the soil surface rougher to retard runoff and increase infiltration. Random roughness may result in shallow puddles, which absorb some of the impact of falling raindrops (water deeper than the raindrop diameter can absorb a considerable portion of the raindrop energy). Contoured furrows, especially from twisted chisel points or ridge planting, may temporarily impound water during heavy rains. This impounded water can absorb raindrop impact and increase infiltration (especially if compared to furrows up and downhill).
However, little credit for soil-loss reduction is given to these factors, since these benefits may be temporary and usually are eliminated by future rains and/or additional tillage. Residue cover therefore is credited as the major factor for reducing soil loss with conservation tillage.
Estimating percent residue cover
Three methods are commonly used to estimate the percent residue cover remaining after tillage/planting operations.
The photo comparison method
Visual estimates may be made by looking straight down on the soil surface and comparing the appearance with photos of known percentages of the same type of residue. Do not try to estimate percent of cover by looking across a field; bare spots behind residue will be hidden from view.
A more time-consuming and accurate method involves projecting photographic slides of the surface onto a grid and determining the percent of grid intersections coinciding with a piece of residue sufficient to absorb the impact of a raindrop. This method is frequently used for research.
The line-transect method
The line-transect method is a practical field method of estimating the residue cover after any operation. This method involves stretching a 50- or 100-foot tape (or cam line) diagonally across the crop rows, and then checking at every foot mark to see if a piece of crop residue is lying under the mark.
When using a 100-foot tape, the percent cover is equal to the number of marks underlain with a piece of residue. When using a 50-foot tape, double the figure to obtain percentage of cover.
To use this method, look straight down at the same side of the tape and when in doubt if there is residue that will absorb the impact of a raindrop under a mark, do not count it. Care should be taken not to overestimate the percentage of cover. Take the average of at least three such readings at typical spots in the field to have a reliable estimate of the percentage of cover.
Calculating residue production
The following amounts of residue are commonly accepted to be produced by various crops:
| Crop | Residue produced per bushel of crop yield |
|---|---|
| Corn | 60 pounds |
| Grain sorghum | 70 pounds |
| Soybeans | 50 pounds |
| Small grain | 100 pounds |
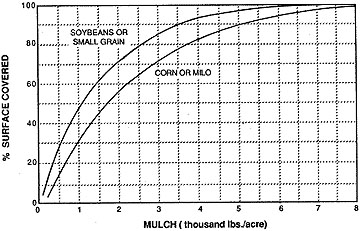
Figure 2 shows the relationship of the percent of surface cover to the amount of uniformly distributed residue mulch for various crops. Ninety-five percent surface cover will be provided by 4,500 pounds of small-grain residue or 6,000 pounds of corn or grain sorghum residue. Increasing weights of residue produce diminishing increases in percentages of surface cover, especially after the surface is 90 percent covered.
Post-operation calculations
To estimate the percentage of residue surface cover remaining after future tillage and planting operations, calculations may be made using the data from Table 1.
Table 1. Influence of field operations on surface residue.
| Implement | Percent residue remaining | |
|---|---|---|
| Non-fragile (corn) | Fragile (soybeans) | |
| Plows | ||
| Moldboard plow | 0 to 10 | 0 to 5 |
| Moldboard plow — uphill furrow | 30 to 40 | |
| Disk plow | 10 to 20 | 5 to 15 |
| Machines that fracture soil | ||
| Paratill/paraplow | 80 to 90 | 75 to 85 |
| V-ripper/subsoiler 12-14 inches deep, 20-inch spacing | 70 to 90 | 60 to 80 |
| Combination tools | ||
| Subsoil-chisel | 50 to 70 | 40 to 50 |
| Disk-subsoiler | 30 to 50 | 10 to 20 |
| Chisel plows | ||
| Sweeps | 70 to 85 | 50 to 60 |
| Straight chisel points | 60 to 80 | 40 to 60 |
| Twisted points or shovels | 50 to 70 | 30 to 40 |
| Combination chisel plows | ||
| Coulter-chisel plows with | ||
| Sweeps | 60 to 80 | 40 to 50 |
| Straight chisel points | 50 to 70 | 30 to 40 |
| Twisted points or shovels | 40 to 60 | 20 to 30 |
| Disk chisel plows with | ||
| Sweeps | 60 to 70 | 30 to 50 |
| Straight chisel points | 50 to 60 | 30 to 40 |
| Twisted points or shovels | 30 to 50 | 20 to 30 |
| Disk harrows | ||
| Offset | ||
| Plowing greater than 10-inch spacing | 25 to 50 | 10 to 25 |
| Primary greater than 9-inch spacing | 30 to 60 | 20 to 40 |
| Finishing 7- to 9-inch spacing | 40 to 70 | 25 to 40 |
| Tandem | ||
| Plowing greater than 10-inch spacing | 25 to 50 | 10 to 25 |
| Primary greater than 9-inch spacing | 30 to 60 | 20 to 40 |
| Finishing 7- to 9-inch spacing | 40 to 70 | 25 to 40 |
| Light tandem disk after harvest, before other tillage | 70 to 80 | 40 to 50 |
| One-way disk with | ||
| 12- to 16-inch blades | 40 to 50 | 20 to 40 |
| 18- to 30-inch blades | 20 to 40 | 10 to 30 |
| Single-gang disk | 50 to 70 | 40 to 60 |
| Field cultivators (including leveling attachments) | ||
| Field cultivators as primary tillage operation | ||
| Duckfoot points | 35 to 60 | 30 to 55 |
| Sweeps or shovels 6-12 inches | 35 to 75 | 50 to 70 |
| Sweeps 12 to 20 inches | 60 to 80 | 55 to 75 |
| Field cultivators as secondary operation following chisel or disk | ||
| Duckfoot points | 60 to 70 | 35 to 50 |
| Sweeps or shovels 6 to 12 inches | 70 to 80 | 50 to 60 |
| Sweeps 12 to 20 inches | 80 to 90 | 60 to 75 |
| Finishing tools | ||
| Combination secondary tillage tools with | ||
| Disks, shanks and leveling attachments | 50 to 70 | 30 to 50 |
| Spring teeth and rolling basket | 70 to 90 | 50 to 70 |
| Harrows | ||
| Spring tooth (coil tine) | 60 to 80 | 50 to 70 |
| Spike tooth | 70 to 90 | 60 to 80 |
| Flex-tine tooth | 75 to 90 | 70 to 85 |
| Roller harrow (cultipacker) | 60 to 80 | 50 to 70 |
| Packer roller | 90 to 95 | 90 to 95 |
| Rotary tiller | ||
| 3-inch deep (secondary) | 40 to 60 | 20 to 40 |
| 6-inch deep (primary) | 15 to 35 | 5 to 15 |
| Undercutters | ||
| Stubble-mulch sweep blade plows with | ||
| "V"-blades or sweeps, 30 inches or wider | 85 to 95 | 70 to 80 |
| Sweeps 20 to 30 inches wide | 80 to 90 | 65 to 75 |
| Rodweeders | ||
| Plain rotary rod | 80 to 90 | 50 to 60 |
| Rotary rod with semi-chisels or shovels | 70 to 80 | 60 to 70 |
| Strip tillage machines | ||
| Rotary tiller, 12-inch tilled on 40-inch rows | 60 to 75 | 50 to 60 |
| Row cultivators (30 inches and wider) | ||
| Single sweep per row | 75 to 90 | 55 to 70 |
| Multiple sweeps per row | 75 to 85 | 55 to 65 |
| Finger-wheel cultivator | 65 to 75 | 50 to 60 |
| Rolling-disk cultivator | 45 to 55 | 40 to 50 |
| Ridge-till cultivator | 20 to 40 | 5 to 25 |
| Drills | ||
| Hoe opener drills | 50 to 80 | 40 to 60 |
| Semi-deep furrow drill or press drill (7- to 12-inch spacing) | 70 to 90 | 50 to 80 |
| Deep furrow drill with greater than 12-inch spacing | 60 to 80 | 50 to 80 |
| Single-disc opener drills | 85 to 100 | 75 to 85 |
| Double-disc opener drills (conventional) | 80 to 100 | 60 to 80 |
| No-till drills and drills with the following attachments in standing stubble | ||
| Smooth no-till coulters | 85 to 95 | 70 to 85 |
| Ripple or bubble coulters | 80 to 85 | 65 to 85 |
| Fluted coulters | 75 to 80 | 60 to 80 |
| No-till drills and drills with the following attachments in flat residues | ||
| Smooth no-till coulters | 65 to 85 | 50 to 70 |
| Ripple or bubble coulters | 60 to 75 | 45 to 65 |
| Fluted coulters | 55 to 70 | 40 to 60 |
| Air seeders | Refer to appropriate field cultivator or chisel plow depending on type of ground-engaging device used. | |
| Air drills | Refer to corresponding type of drill opener. | |
| Row planters | ||
| Conventional planters with | ||
| Runner openers | 85 to 95 | 80 to 90 |
| Staggered double-disc openers | 90 to 95 | 85 to 95 |
| Double-disc openers | 85 to 95 | 75 to 85 |
| No-till planters with | ||
| Smooth coulters | 85 to 95 | 75 to 90 |
| Ripple coulters | 75 to 90 | 70 to 85 |
| Fluted coulters | 65 to 85 | 55 to 80 |
| Strip-till planters with 2- or 3-fluted coulters | 60 to 80 | 50 to 75 |
| Strip-till planters with row cleaning devices (8- to 14-inch wide bare strip using brushes, spikes, furrowing discs or sweeps) | 60 to 80 | 50 to 60 |
| Ridge-till planter | 40 to 60 | 20 to 40 |
| Unclassified machines | ||
| Anhydrous applicator | 75 to 85 | 45 to 70 |
| Anhydrous applicator with closing discs | 60 to 75 | 30 to 50 |
| Subsurface manure applicator | 60 to 80 | 40 to 60 |
| Rotary hoe | 85 to 90 | 80 to 90 |
| Bedders, listers and hippers | 15 to 30 | 5 to 20 |
| Furrow diker | 85 to 95 | 75 to 85 |
| Mulch treader | 70 to 85 | 60 to 75 |
| Climatic effects | ||
| Overwinter weathering (in northern climates with long periods of snow cover and frozen conditions, weathering may reduce residue levels only slightly, while in warmer climates, weathering losses may significantly reduce residue levels) | ||
| Following summer harvest | 70 to 90 | 65 to 85 |
| Following fall harvest | 80 to 95 | 70 to 80 |
| Data provided in Table 1 was developed from available research data, Natural Resources Conservation Service guides and equipment manufacturer trials. | ||
For a given implement, residue coverage is influenced by speed and depth of operation, soil moisture, texture and condition, plus the type and height of the residue. A disk or chisel will cover considerably more of a flat, fragile residue such as soybeans than of a sturdier, more erect residue such as corn or milo (grain sorghum).
High-yielding corn, grain sorghum and small grains generally leave about 95 percent of the soil surface covered with residue after harvest, if spread uniformly behind the combine. High-yielding soybeans typically produce an 80 to 85 percent residue cover.
The following examples illustrate how to use the data from Table 1 to predict the percentage residue cover remaining after various operations (use chain multiplication and convert percentages remaining for each operation to decimal equivalents).
Example 1
Assume a field of corn in northern Missouri yielded 100 bushels per acre. From Table 2, the residue produced is 60 pounds per bushel (total residue produced = 6,000 pounds per acre).
Table 2. Relationship of residue production to crop yield.
| Crop | Pounds of residue produced per bushel of crop yield |
|---|---|
| Corn | 60 |
| Grain Sorghum | 70 |
| Soybeans | 50 |
| Small Grain | 100 |
From Figure 2, 6,000 pounds of uniformly distributed residue per acre will cover 95 percent of the soil surface after harvest. Assume the following operations: Fall chisel with straight points, 10 percent residue decay over winter, spring disk (finishing) and drill soybeans with double-disc openers, conventional drill.
initial residue cover x chisel x winter decay x disk x drill = final residue cover
95 percent x 0.75 x 0.90 x 0.70 x 0.90 = 40 percent
The 40 percent residue cover remaining will qualify as conservation tillage (30 percent or more cover after planting) and will reduce erosion to about 40 percent of that from a fall plow system.
Example 2
Assume a field of soybeans yielded 40 bushels per acre. From Table 2, the residue produced is 50 pounds per bushel (total residue produced = 2,000 pounds per acre). From Figure 2, 2,000 pounds of uniformly distributed residue per acre will cover about 72 percent of the soil surface after harvest. Assume the following operations: 20 percent residue decay over winter, apply anhydrous ammonia and no-till plant corn with a fluted coulter.
initial residue cover x winter decay x ammonia applicator x plant = final residue cover
72 percent x 0.80 x 0.70 x 0.80 = 32 percent
The 32 percent cover after planting in the soybean stubble will reduce erosion to about 55 percent of that from a fall plow system.
The calculation points out the problems associated with keeping 30 percent residue cover after planting following soybeans due to the fragile nature of the residue. Obviously, no-till planting is the only system that can be relatively certain to qualify as conservation tillage following soybeans.
The calculations of predicted residue aren't as accurate as measurements after planting but do allow one to compare various systems on paper. By calculating the estimated percentage of cover remaining after planting, the corresponding "Soil Loss Ratio" can be estimated for each year of a crop rotation and the average "Soil Loss Ratio" can be calculated for the rotation. Thus, various rotations and tillage regimes can be compared to aid in selecting the most desirable system for a specific conservation plan.