Use the following equation to estimate the peak rates of runoff to be expected from watersheds smaller than 200 acres in Missouri:
Q = QT x L x I x T x S x V x C x P x F where
Q = Peak rate of runoff, cubic feet per second.
QT = Peak rate of runoff from a watershed with a specific set of watershed conditions (Table 1).
L = Watershed location factor.
I = Soil infiltration factor.
T = Topographic factor.
S = Watershed shape factor.
V = Vegetative cover factor.
C = Contouring factor.
P = Surface storage factor.
F = Runoff frequency factor.
Table 1
Peak rates of runoff, in cubic feet per second, to be expected from watersheds in Missouri under the following conditions.
- Watersheds located along line 1.00, Figure 1
- Soils with an average infiltration rate
- Land slopes average 8 percent
- A typical watershed shape
- In row crops, with the crop rows planted across the slope without terraces
- No appreciable surface storage
- 10-year frequency runoff
| Size of watershed | Peak rate of runoff |
|---|---|
| 5 acres | 19 cubic feet per second |
| 10 acres | 36 cubic feet per second |
| 15 acres | 52 cubic feet per second |
| 20 acres | 67 cubic feet per second |
| 25 acres | 81 cubic feet per second |
| 30 acres | 94 cubic feet per second |
| 35 acres | 107 cubic feet per second |
| 40 acres | 120 cubic feet per second |
| 45 acres | 132 cubic feet per second |
| 50 acres | 144 cubic feet per second |
| 55 acres | 155 cubic feet per second |
| 60 acres | 166 cubic feet per second |
| 65 acres | 175 cubic feet per second |
| 70 acres | 185 cubic feet per second |
| 75 acres | 195 cubic feet per second |
| 80 acres | 205 cubic feet per second |
| 85 acres | 215 cubic feet per second |
| 90 acres | 225 cubic feet per second |
| 95 acres | 235 cubic feet per second |
| 100 acres | 245 cubic feet per second |
| 110 acres | 265 cubic feet per second |
| 120 acres | 285 cubic feet per second |
| 130 acres | 304 cubic feet per second |
| 140 acres | 322 cubic feet per second |
| 150 acres | 340 cubic feet per second |
| 160 acres | 356 cubic feet per second |
| 170 acres | 372 cubic feet per second |
| 180 acres | 388 cubic feet per second |
| 190 acres | 404 cubic feet per second |
| 200 acres | 420 cubic feet per second |
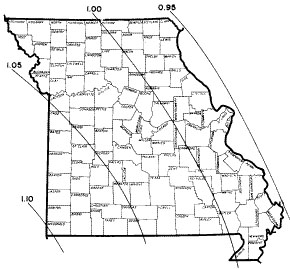 Figure 1
Location factors, L
Table 1 gives peak rates of runoff to be expected from various sizes of watersheds:
- Located along line 1.00 in Figure 1
- A soil of average infiltration
- Average land slope of 8 percent
- A typical watershed shape
- Planted to row crops with the crop rows planted across the slope without terraces
- With no appreciable surface storage
- In an average 10-year period.
If the watershed for which the peak rate of runoff is being estimated has conditions different from those in Table 1, then multiply the values from Table 1 by the appropriate factor, which can be found in the following information.
Watershed location
Values in Table 1 are for watersheds located along line 1.00, Figure 1. If the watershed is in another location, multiply the value from Table 1 by the appropriate factor obtained from the map in Figure 1.
Soil infiltration
Values in Table 1 are peak rates of runoff to be expected from a soil with an average infiltration rate, such as a Summit silt loam or a Shelby loam. If soil conditions differ from this, multiply the value from Table 1 by an appropriate factor selected from the following:
| Soil infiltration rate | Soil infiltration factor, I |
|---|---|
| Very High (coarse textured soils throughout, such as Sarpy sand or Bruno sand) | 0.8 |
| Above average (soils with medium to moderately coarse textured surface, well drained as evidenced by bright or nonmottled subsoil colors, such as Marshall or Menfro silt loams) | 0.9 |
| Average (soils with medium textured surface and moderately-fine textured subsoils with restricted drainage as evidenced by having gray or mottled subsoil colors, such as Shelby loam or Summit silt loam) | 1.0 |
| Below average (soils with medium to moderately fine textured surface with a claypan or fragipan subsoil within 12 inches of the surface, such as Mexico or Lebanon silt loams) | 1.1 |
| Very low (soils with fine textured surface or soils eroded into claypan subsoils, such as Wabash clay or severely eroded Mexico silt loam) | 1.2 |
Shape of watershed
The peak rate of runoff will be affected by the maximum distance the runoff must travel in reaching the discharge point. In long, narrow watersheds, the runoff must travel a greater distance than in a compact watershed, hence a lower peak rate of runoff can be expected. If terraces or diversions drain away from the discharge point, the runoff must travel a greater distance and a lower peak rate of runoff can be expected.
Determine the maximum distance the runoff must travel in reaching the discharge point. Find this distance in Table 2 in the number of acres in the watershed and read the corresponding S factor in the right hand column of the table. Multiply the value from Table 1 by this S factor.
Table 2
Determining the maximum distance runoff must travel in reaching the discharge point
| Size of watershed (acres) | Shape factor, S | |||||||||||||||
|---|---|---|---|---|---|---|---|---|---|---|---|---|---|---|---|---|
| 5 | 10 | 20 | 30 | 40 | 50 | 60 | 70 | 80 | 90 | 100 | 120 | 140 | 160 | 180 | 200 | |
| Maximum distance in feet that runoff travels | ||||||||||||||||
| 600 | 800 | 1000 | 1100 | 1300 | 1400 | 1500 | 1700 | 1800 | 1900 | 2100 | 2300 | 2500 | 2700 | 1.25 | ||
| 550 | 700 | 900 | 1100 | 1200 | 1400 | 1600 | 1700 | 1800 | 1900 | 2100 | 2400 | 2600 | 2900 | 3100 | 1.20 | |
| 550 | 800 | 1000 | 1200 | 1400 | 1600 | 1800 | 1900 | 2000 | 2200 | 2400 | 2700 | 3000 | 3300 | 3500 | 1.15 | |
| 400 | 600 | 900 | 1200 | 1400 | 1600 | 1800 | 2000 | 2100 | 2300 | 2500 | 2800 | 3100 | 3400 | 3700 | 3900 | 1.10 |
| 500 | 700 | 1000 | 1400 | 1600 | 1800 | 2100 | 2300 | 2500 | 2700 | 2900 | 3200 | 3600 | 3800 | 4100 | 4300 | 1.05 |
| 600 | 800 | 1200 | 1600 | 1900 | 2100 | 2400 | 2700 | 2900 | 3100 | 3300 | 3600 | 4000 | 4300 | 4600 | 4800 | 1.00 |
| 700 | 950 | 1400 | 1900 | 2200 | 2400 | 2700 | 3100 | 3300 | 3600 | 3800 | 4100 | 4500 | 4800 | 5200 | 5500 | 0.95 |
| 800 | 1100 | 1600 | 2200 | 2600 | 2900 | 3200 | 3600 | 3800 | 4100 | 4400 | 4700 | 5100 | 5500 | 5900 | 6200 | 0.90 |
| 900 | 1300 | 1900 | 2600 | 3100 | 3400 | 3700 | 4100 | 4400 | 4600 | 5000 | 5400 | 5900 | 6300 | 6700 | 7000 | 0.85 |
| 1100 | 1600 | 2300 | 3100 | 3600 | 3900 | 4200 | 4600 | 5000 | 5400 | 5700 | 6200 | 6700 | 7100 | 7500 | 7900 | 0.80 |
| 1300 | 1900 | 2800 | 3600 | 4200 | 4600 | 5000 | 5400 | 5800 | 6200 | 6600 | 7100 | 7600 | 8000 | 8400 | 8800 | 0.75 |
Topography
Values in Table 1 are peak rates of runoff to be expected from watersheds with an average land slope of 8 percent. If the average land slope on a watershed differs from this, multiply the value from Table 1 by the following factor:
| Average land slope | Topographic factor (T) |
|---|---|
| 0.5 percent | 0.50 |
| 1 percent | 0.65 |
| 2 percent | 0.72 |
| 3 percent | 0.78 |
| 4 percent | 0.83 |
| 5 percent | 0.88 |
| 6 percent | 0.92 |
| 7 percent | 0.96 |
| 8 percent | 1.00 |
| 9 percent | 1.04 |
| 10 percent | 1.07 |
| 12 percent | 1.14 |
| 14 percent | 1.20 |
| 16 percent | 1.26 |
| 18 percent | 1.32 |
| 20 percent | 1.37 |
Vegetation
Values in Table 1 are peak rates of runoff to be expected from watersheds with the entire watershed in row crops. If different crops are expected on a watershed, multiply the value from Table 1 by the following factor:
| Type of cover | Vegetative cover factor (V) |
|---|---|
| Farmstead | 1.2 |
| Row crop | 1.0 |
| Small grain, good quality | 0.8 |
| Small grain, poor quality | 0.9 |
| Pasture, good quality | 0.6 |
| Pasture, poor quality | 0.8 |
| Meadow, good quality | 0.5 |
| Meadow, poor quality | 0.7 |
| Timer, good quality | 0.5 |
| Timer, poor quality | 0.6 |
If several types of cover are present on a watershed, a weighted vegetation factor should be computed. For example, assume that a 160-acre watershed contains 80 acres of small grain, 40 acres of meadow and 40 acres of timber, all with good quality cover. The weighted vegetation factor would be computed as follows:
| Acres of cover | multiplied by | Vegetative cover factor | equals | Aggregate vegetation factor |
|---|---|---|---|---|
| 80 acres small grain | multiplied by | factor 0.8 | equals | 64 |
| 40 acres meadow | multiplied by | factor 0.5 | equals | 20 |
| 40 acres timber | multiplied by | factor 0.5 | equals | 20 |
| 160 total acres | 104 total |
104 ÷ 160 = 0.65, the weighted vegetation factor.
Contouring
Values in Table 1 are peak rates of runoff to be expected from watersheds with crop rows planted across the slope without terraces or without contour guide lines.
If the entire watershed is farmed parallel to contour guide lines or terraces, multiply the value in Table 1 by an appropriate factor selected from the following:
| Acres in watershed | Contour factor (C) |
|---|---|
| 0 to 10 | 0.95 |
| 11 to -40 | 0.96 |
| 41 to 100 | 0.97 |
| 101 to 200 | 0.98 |
If the entire watershed is not farmed on the contour, make an appropriate adjustment in the contouring factor. For example, if only 20 acres of a 60-acre watershed are farmed on the contour, the contouring factor would be 0.99.
0.97 + [(60-20 ÷ 60) (1.0-0.97)] = 0.99, the weighted contouring factor.
Storage
Any water detained or impounded on the watershed will reduce the peak rate of runoff from the watershed. Values in Table 1 are peak rates of runoff to be expected from a watershed with no appreciable surface storage. If water is impounded on the watershed, multiply the value from Table 1 by an appropriate factor. The storage factor may vary depending on the percent of the watershed that drains into the impoundment, the amount of storage provided and the location of the impoundment on the watershed.
Because of the wide variations in type of impoundments and the many possible locations on the watershed, it is impossible to give specific values for the storage factor that would be applicable for all situations. The following general principles may be helpful in evaluating the storage factor:
- Impoundments with only an emergency spillway will not reduce the peak rate of runoff an appreciable amount, particularly if they are expected to be full when the design storm occurs.
- Impoundments with a principal spillway at a lower elevation than the emergency spillway will reduce the peak rate of runoff. The amount of reduction will depend on the percent of the watershed that drains into the impoundment, the rate of flow through the principal spillway, the amount of storage provided between the principal and emergency spillways, and the capacity of the emergency spillway.
- Impoundments located in the upper part of a watershed give the greatest reduction in the peak rate of runoff; those located in the lower part give the least reduction while impoundments located throughout the watershed will have an intermediate effect.
- The effect of level terraces on the peak rate of runoff depends on the percent of the watershed terraced and the amount of storage provided.
- The effectiveness of natural storage such as lakes, swamps and sink holes will depend on their location on the watershed, the percent of the watershed draining into them and the amount of storage available when the design storm occurs.
To obtain the best estimate of the effect of storage on the peak rate of runoff, the design storm should be flood routed through the impoundments. If this is not feasible, the following procedure is suggested:
- Determine the peak rate of runoff to be expected from the area of the watershed below the impoundments.
- Determine the expected flow through the spillways of the impounding structures for the frequency of storm being considered.
- Add the spillway discharge to the discharge to be expected from the area below the impoundments to obtain the total peak rate of runoff.
Storage factor for graded terraces
Water in temporary storage in the channels of graded terraces will reduce the peak rate of runoff from the watershed.
If the entire watershed is terraced, the storage factor P can be selected from the following table:
| Acres in watershed | Storage factor P for graded terraces (average length of terraces) | ||
|---|---|---|---|
| 500 feet | 1,000 feet | 1,600 feet | |
| 0 to 10 | 0.95 | 0.90 | 0.80 |
| 11 to 40 | 0.97 | 0.93 | 0.85 |
| 41 to 100 | 0.98 | 0.95 | 0.90 |
| 101 to 200 | 0.99 | 0.97 | 0.95 |
If the entire watershed is not terraced, make an appropriate adjustment in the storage factor. For example, if 40 acres of a 50-acre watershed were terraced and the terraces averaged 1,000 feet long, the storage factor would be 0.96.
0.95 + [(50 - 40 ÷ 50) (1.0-0.95)] = 0.96
Runoff frequency
Values in Table 1 are the peak rates of runoff to be expected in an average 10-year period. If the peak rate of runoff for a different design frequency is desired, multiply the value from Table 1 by the following factor:
| Runoff frequency | Runoff frequency factor (F) |
|---|---|
| 1/2 year | 0.2 |
| 1 year | 0.3 |
| 2 year | 0.5 |
| 5 year | 0.8 |
| 10 year | 1.0 |
| 25 year | 1.3 |
| 50 year | 1.5 |
Combination of several factors
For watersheds that have a number of factors differing from those specified for the watersheds in Table 1, determine the peak rate of runoff by multiplying the value from Table 1 by a succession of factors applicable to the watershed being considered.
For example, estimate the peak rate of runoff to be expected in a 10-year period from a 120-acre watershed located in Andrew County with the following characteristics:
- A Marshall silt loam soil.
- Land slopes average 10 percent.
- The runoff must travel a maximum distance of 4,700 feet in reaching the discharge point.
- Eighty acres of low cropland in the upper half of the watershed is terraced. The terraces average 1,300 feet in length. The crop rows are planted with the terraces.
- Forty acres of good quality pasture in the lower half of the watershed are not terraced.
- There are no impoundments, except terraces, on the watershed.
| Condition | Factor |
|---|---|
| Location, Andrew County | 1.03 |
| Marshall silt loam soil | 0.9 |
| Land slope, 10 percent | 1.07 |
| Maximum distance of water flow, 4,700 feet | 0.90 |
| Vegetation, 80 acres row crop (1.0); 40 acres pasture (0.6) | 0.87 |
| Contouring | 0.99 |
| Storage in gradient terraces | 0.97 |
| 10-year frequency runoff | 1.0 |
The peak rate of runoff (Qt) for a 120-acre watershed from Table 1 is 285 cubic feet per second.
Substituting in the equation
Q = Qt x L x I x T x S x V x C x P x F
Q = 285 x 1.03 x 0.9 x 1.07 x 0.90 x 0.87 x 0.99 x 0.97 x 1.0
Q = 213 cfs
Compute the peak rate of runoff to be expected from the above watershed in a 25-year period. F = 1.3.
Q = 213 x 1.3 = 277 cfs
This publication was prepared jointly by state and field staffs of the College of Agriculture, MU, and the Natural Resources Conservation Service. Original MU author was the late R.P. Beasley.