Introduction
Manure management encompasses the collection, storage, treatment, and land application of manure to minimize environmental risks while maximizing its agronomic value. An effective on-farm manure management system takes into account factors such as the size and type of operation, the volume of manure generated, collection and treatment methods, and the availability of suitable cropland for application. In animal feeding operations (AFOs), manure is typically collected from housing areas and transported—often via pipelines or pumps—to storage structures such as lagoons, ponds, or earthen basins. These systems, which can hold millions of gallons of manure slurry, are widely used due to their cost-effectiveness and storage capacity. When properly designed and managed, lagoons can treat and store manure while minimizing the risk of pollutant or excessive amount of nutrient release to the surrounding environment. Some lagoons are also equipped with aeration systems to enhance the breakdown of organic matter and reduce emissions of harmful gases.
Lagoons can pose significant environmental risks if not properly managed. Sludge accumulation reduces the lagoon’s treatment efficiency, lowers the quantity and quality of recycled lagoon water, and increases the risk of odor issues. To maintain optimal anaerobic lagoon performance, sludge levels should be regularly monitored and when needed, be removed as necessary.
Manure system mangers must implement appropriate practices to prevent significant sludge accumulation in manure lagoons. Dredging and thorough lagoon agitation are common practices of removing accumulated sludge and other debris from the bottom of the lagoon. Maintaining the lagoon’s treatment capacity and proper functioning also ensure enough storage, preventing the potential release of pollutants into the environment. The removed sludge can appropriately be land applied to provide crop nutrients.
Regular dredging can protect water and air quality but can be costly. Regular sludge survey in the manure lagoon provides an estimate of the accumulation rates and fosters proper and optimized dredging of lagoons, it is essential to. One standard method of sludge survey is to use a disk on a rope. The disk is dropped into the lagoon and allowed to settle on the sludge layer. The liquid depth (depth of the sludge top layer) can be read using a tape measure or direct marking on the rope. Although this traditional method is simple and inexpensive, it may not be the most convenient, practical, or safe option – particularly for larger or deeper lagoons.
Recreational boaters and fishermen often use sonar depth finders, such as commercial sonar balls, which generate high-frequency signals to detect locations of fish and determine water depth. However, it is important to note that they are not designed for sludge survey, and results should not be relied upon without adequate testing. This case study aims to assess the potential of using commercial low-cost sonar balls in sludge survey and estimate the nutrient contents of lagoon. This paper reports a field study conducted in a dairy lagoon at the Foremost Dairy Research Center, University of Missouri-Columbia.
Experimental dairy lagoon
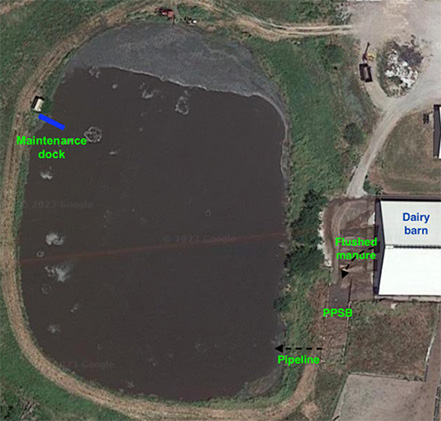
The dairy lagoon located near Columbia, MO was used for the case study. The dairy farm housed a herd of 140-160 lactating cows. Mattress bedding with cedar shavings was used in a free-stall barn. Manure in the free-stall barn was flushed into a pull-plug sediment basin (PPSB). A PPSB is a type of on-farm solid/liquid separating structure, commonly used to remove solids and other sedimental contaminants from wastewater. This type of basin is characterized using a pull plug, which is typical a large and hollow plug inserted into the bottom of the basin to drain the wastewater. The solid materials settle to the bottom, while the buoyant particles (such as undigested fiber, waste forage, bedding, etc.) accumulate and create a floating mat on the surface. This mat functions as a natural filter, enabling the PPSB to capture as much as 90% of the solids present in the waste stream. Then the separated liquid is channeled to a lagoon. The study lagoon was oblong with curved ends. The long side is about 400 feet, while the short side is about 280 feet. (Figure 1). The exact lagoon depth is unknown, but the farm manager believed it ranged from 10 to 12 feet. The lagoon was desludged in 2020 and then a PPSB was installed between the dairy barn and the lagoon. It is thus important to conduct frequent sludge survey using simple and practical methods to monitor the sludge accumulation.
Regular and potential lagoon sludge survey used in this case study
A typical lagoon sludge survey involves measuring three key "depths." Liquid depth is defined as the vertical distance from the liquid surface to the top of the uppermost sludge layer. Sludge depth refers to the distance from the top of the sludge layer to the lagoon bottom. Lagoon working depth is the total vertical distance from the liquid surface to the bottom of the lagoon and is equal to the sum of the liquid and sludge depths. Interpreting sludge measurements can be challenging because sludge density varies with depth. The uppermost sludge layer may resemble a thick slurry, while deeper layers can be much more compact and solid. As a result, the significance of the first sludge layer detected by different measurement methods may vary depending on the technique used and the sludge's physical consistency.
Two common sludge survey methods (disc on a rope and wood stick with length mark) were compared to the sonar ball method to verify the measurements and practicality in this case study. A commercial sludge survey team was also contracted to collect sludge samples and measure the lagoon liquid/sludge depths, so that their data can be compared with ours.
Regular sludge survey method 1: disc on a rope
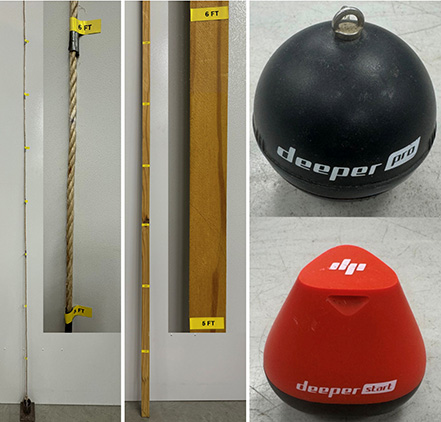
Disc on a rope for measuring the liquid depth of a lagoon or other bodies of water, is shown in Figure 2. This method involves tying a disc or weight to a rope, lowering it into the lagoon until the disc hits the top layer of sludge and stops. Measuring the submerged length of the rope provides an estimate of the liquid depth. A boat is essential to access the targeted measurement points covering the entire lagoon surface. The sludge depth can be calculated by subtracting the liquid from the total depth (if known).
Regular sludge survey method 2: Wood stick with length mark
A wooden stick marked with depth indicators is shown in Figure 2B. The wooden stick is inserted vertically into the lagoon and stopped when resistance indicates it has touched the sludge surface. The lagoon liquid depth is observed and recorded. Same as the disc on a rope, a boat is essential to access the targeted measurement points distributed on the lagoon surface. Unlike the disk-and-rope method, the stick method can probe the bottom of the lagoon; but the two methods would be unlikely to show the same top-of-sludge measurement since the top sludge layer is usually very fluid and not likely to give perceptible resistance to the stick.
Potential sludge survey method 3: Sonar depth finder
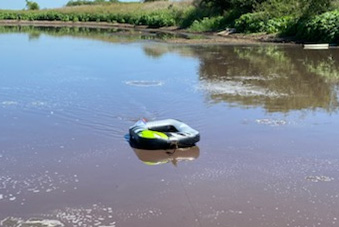
A sonar ball is a popular method used by fishermen to measure the depth of water bodies. The sonar ball works by generating sound waves that travel through the water and bounce off the first layer encountered that has a change in density. When connected to a cellphone with Bluetooth capability, the measurement information and data – including site location, time, and depth – is stored or uploaded to a cloud server. The sonar ball and cellphone can be fixed to any floating objects, such as a fishing boat or a lagoon sludge survey boat, enabling a more convenient and safer hands-off measurement.
For our measurement of the Foremost Dairy lagoon, the sonar device and a cellphone were attached to a small floating device, and navigated to the targeted points with ropes, controlled by two people standing on opposite sides of the lagoon. Thus, no manned boat is necessary for the measurements. However, the accuracy of sonar ball measurements in water bodies can be affected by several factors, including water clarity, depth, bottom composition, and surface condition (floating waste materials). In our field measurements, two commercial sonar balls (Deeper Fishfinder START and Deeper Sonar PRO+, Figure 2) were used to measure the lagoon liquid depth. Specifications of both sonar balls are shown in Table 1.
Table 1. Product details of the two commercially available sonar balls.
| Details | Deeper Fishfinder START | Deeper Sonar PRO+ |
|---|---|---|
| Sonar sensor | Single: 120 kHz, 40° | Dual: 290 kHz, 15°/90 kHz, 55° |
| Depth range | 1.6-165 feet | 2.0-260 feet |
| Sonar scan rate | 10 scans per second | ≤ 15 scans per second |
Field measurement procedure
Several field measurement trials were conducted to assess the accuracy of different methods, estimate the lagoon capacity, and demonstrate the labor-saving of the potential sludge survey method.
Partial-scale depth measurement for methods assessment
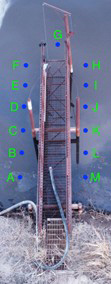
To assess the accuracy of selected sludge survey methods, we first used the pump-maintenance dock as an easy-access platform (Fig. 3). A total of thirteen measurement points were distributed along the platform, and all three methods were used at each (Fig. 3). Each of the three measurement techniques was replicated five times. A series of data analysis methods were conducted in this first step, including 1) absolute liquid depth data comparison, 2) relative error based on setting the disc on a rope as standard method and 3) regression of liquid depth values against disc on a rope values.
Full-scale depth measurement for methods assessment and lagoon capacity estimation
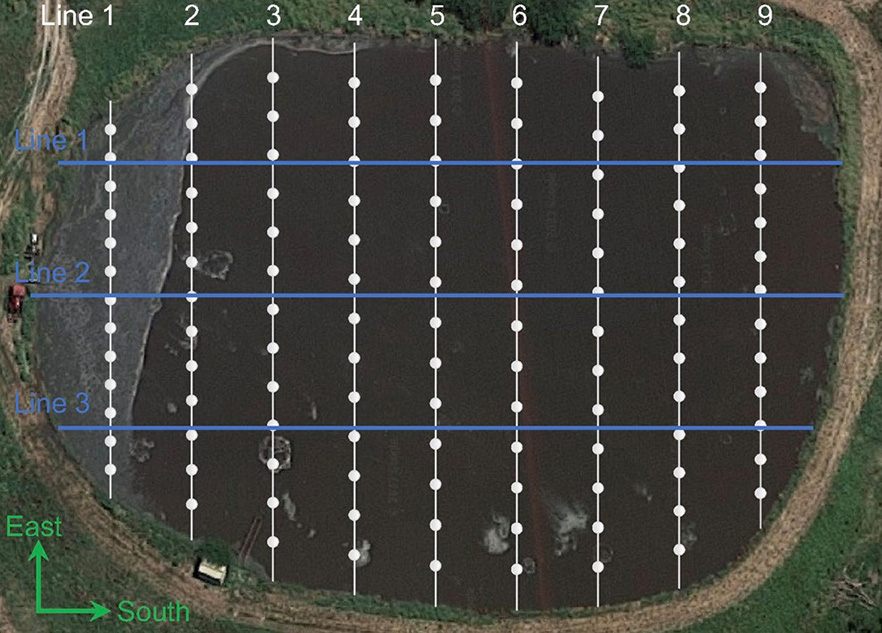
To expand the measurements to the entire lagoon, we conducted full-scale lagoon depth measurements using a disc on a rope and the FishFinder START model sonar ball (more accurate and suitable than the Sonar PRO+ model sonar ball based on the 13-points comparisons conducted). In this step, the necessary equipment included a disc on a rope, the sonar ball device, a single-person kayak, safety jacket for the kayaker, and a cellphone for logging the sonar ball data. The sonar ball was tied to the kayak to move along the measurement points, and the data was stored in the cellphone. One person in the kayak operated the depth measurement using disc on a rope and another two people assisted navigating the kayak with ropes while standing on opposite lagoon banks. The kayak was stopped at each sampling point (white dots on Figure 4) along the nine white lines. The liquid depth data at each measurement point were recorded.
Partial-scale depth measurement for the labor-saving demonstration of sonar depth finder
Another approach was tested to verify if the sonar ball method could be conducted more conveniently (labor-saving). We used a small air-filled float to house a cellphone and pull the sonar ball (Figure 5). Two kite strings with reels were tied to the small float, and pulled by two people standing on opposite lagoon banks to navigate the float to the targeted locations (Figure 4, three blue lines).
Sludge survey conducted by a consulting company
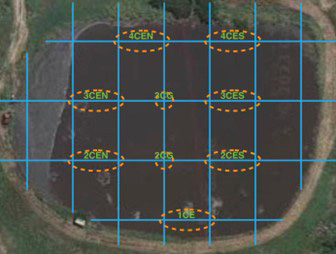
A consulting company (EDI Aeration Work, Columbia, MO) was contracted to measure both liquid and sludge depths and collect samples for subsequent nutrient and organic matter analysis. The lagoon was divided into several zones using the blue-line grid, and the liquid and sludge depth measurements were conducted at each intersection (shown in Figure 6) using a sludge judge (Nasco Sampling Products, Madison, WI). The purpose of the sampling plan was to investigate the profiling and cross-sectional distribution of nutrient. One full-depth sample (from the liquid surface to the lagoon bottom) at each intersection in each orange ellipse (Figure 6, two intersections in each orange ellipses) was collected. Then, two full-depth samples collected in the same orange ellipses were combined into a five-gallon bucket. Five hundred milliliter of the mixture was collected as the final sample of each orange ellipse. The profile sampling was conducted at the intersection in each orange circle (Figure 6). Three profiling samples were collected at a single location (intersection in the orange circle) while varied depths of 1/3, 2/3, and full of the lagoon depth. These samples were not combined so that the contents can be compared according to the depth variation. All the samples were sent to the MU Soil & Plant Testing Lab for subsequent nitrogen, ammonium, phosphorus, potassium, moisture, pH, electrical conductivity, and carbon contents analysis.
Results and discussion
Accuracy assessment among different methods
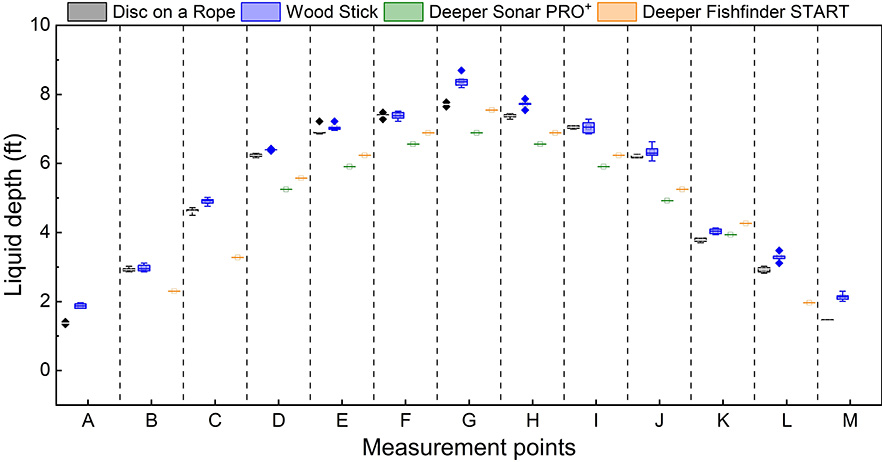
Compared with the disc on a rope values, liquid depth was overestimated using a wood stick method and underestimated using the two types of sonar balls (Figure 7). It is hypothesized that the disc on a rope method returns a more consistent and representative of the sludge depth measurement. Notably, the Deeper Fishfinder START and Deeper Sonar PRO+ measurements indicated a “below depth limitation” message when the liquid depths were under 1.6 ft and 3.9 ft (values displayed on related sonar ball), respectively. In addition, the depth values changed quite frequently when they were below the depth limitations (these data were excluded and not shown in Figure 7). So, we marked the liquid depth data when the device indicated “below depth limitation” in the measurement phase and excluded these data during data analysis.
Regression of liquid depth values with disc on a rope measurement
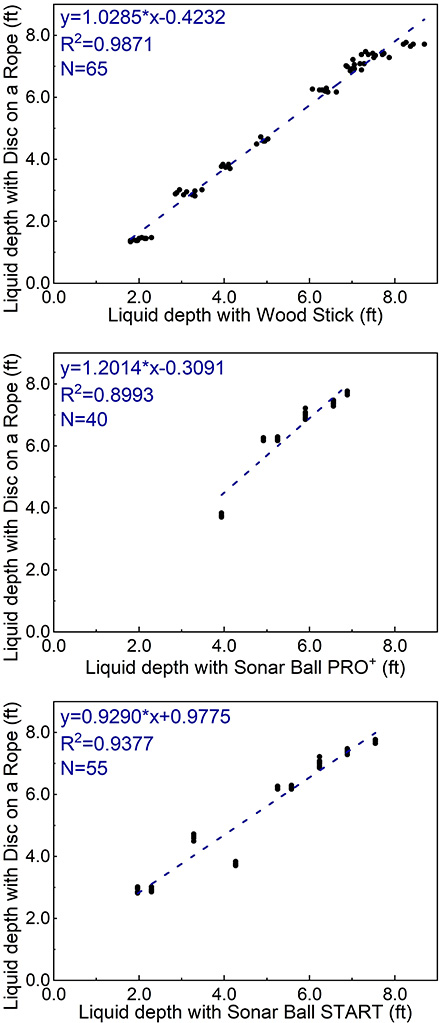
Setting the disc on a rope as standard measurement, linear models for the wood stick, Deeper Sonar PRO+ and Deeper Fishfinder START were established (Figure 8). Due to the measurement limitation, the number of valid data points to develop the models were 65, 40 and 55 for wood stick, Deeper Sonar PRO+ and Deeper Fishfinder START, respectively. The corresponding model's coefficient of determination (R2) was 0.9871, 0.8993 and 0.9377 for wood stick, Deeper Sonar PRO+ and Deeper Fishfinder START, respectively. These models could be used to correct the full-scale liquid depth measurement. We recommend the Deeper Fishfinder START sonar ball for lagoon liquid depth measurement, which has a lower liquid depth measurement limitation. Sonar ball measurement method can be used rather easily by dragging an air-filled small float across lagoon surfaces from the edges of lagoon, without needing a sludge survey boat or a kayak.
When the lagoon liquid depth decreased after pump-out and land application during the spring/summer season, we conducted another field measurement to compare the linear model for Deeper Fishfinder START sonar ball with the disc on a rope. As expected, the liquid depth range of the sonar ball data was even narrower (1.9 to 2.3 ft) due to the overall lower lagoon depth. The new linear model was statistically different from the one we initially developed for the deeper lagoon, shown in Figure 8. This confirms that the sonar ball measurements are highly limited by the lagoon depth, and that one should consider developing a correction model using as many data points as possible and relevant depths, before conducting a full-scale lagoon liquid depth measurement.
Lagoon liquid depth contour based on different measurement methods
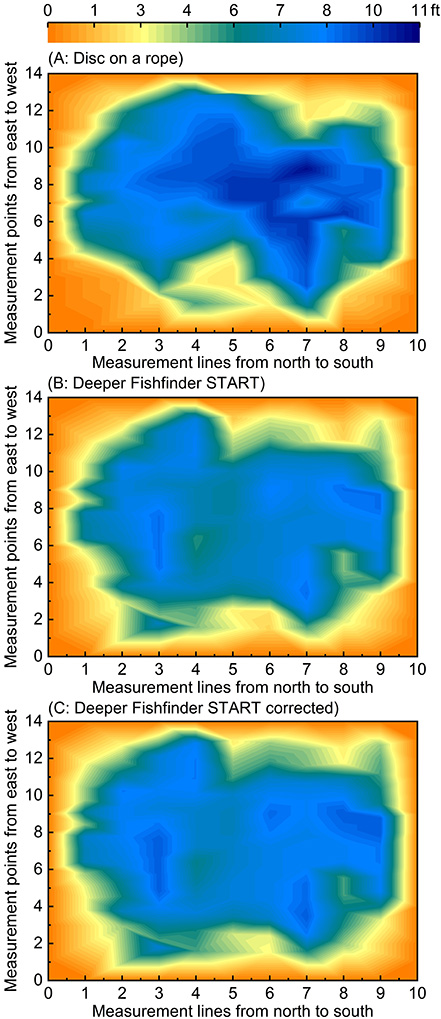
Contour maps were plotted to compare the full-scale lagoon liquid depths collected using disc on a rope and Fishfinder START sonar device (Figure 9 A and B) methods. In general, the Fishfinder START sonar method underestimated the liquid depth compared with the disc on a rope method. The sonar device measurements were then corrected using the linear regression model developed (Figure 9 C). After correction using the linear model, the liquid depth values averaged 1.5% (10.8% without correction) lower than those obtained by the disc on a rope method. The average liquid depths obtained by the full-scale lagoon measurement using a disc on a rope, Deeper Fishfinder START and correction of Deeper Fishfinder START were 6.5 ft, 5.8 ft, and 6.4 ft, respectively.
Sludge judge result and comparative analysis
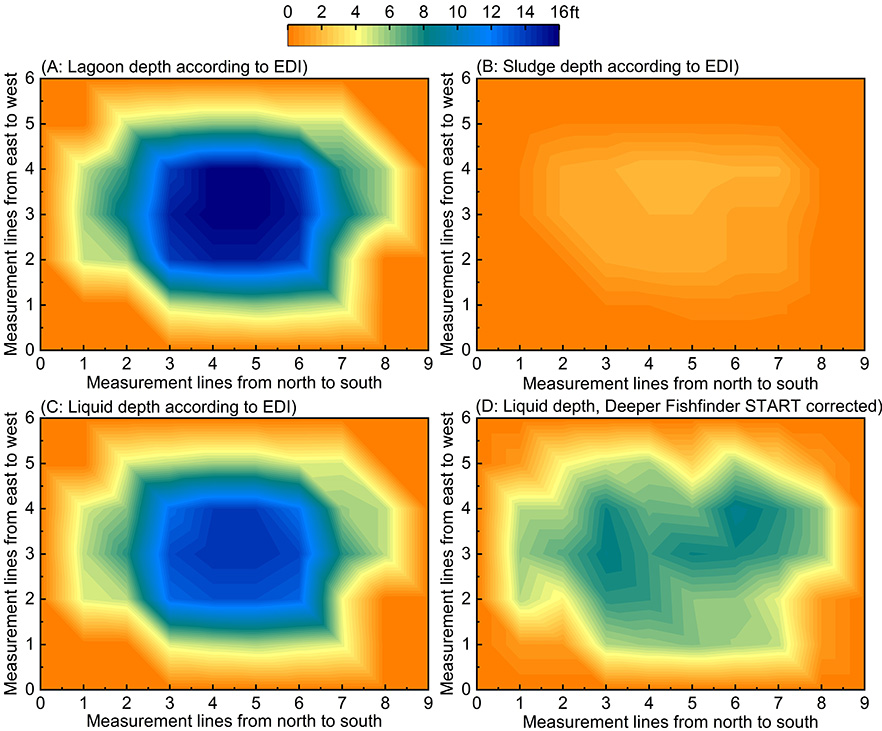
Another set of contour maps including lagoon depth, sludge depth and liquid depth, were plotted using full-scale measurement data from EDI Aeration Work (Figures 10A, B and C). Due to the measurement resolution between EDI Aeration Work and Deeper Fishfinder START, we adjusted the measurement resolution of Deeper Fishfinder START to fit that of EDI Aeration Work. Then, the contour map was plotted using resolution-adjusted corrected Deeper Fishfinder START data (Figure 10D). As the data in Figures 10A, B and C were collected on different days with Figure 10D, the lagoon depth at the data collection day of Figures 10A, B and C was 2.2 ft higher than that of Figure 11 D. The average liquid, sludge and lagoon depths obtained by the consulting company were 9.7 ft, 1.3 ft, and 11.0 ft, respectively. When comparing the Figure 10C and 10D, we applied a correction factor of 2.2 ft to the liquid depth values measured by Deeper Fishfinder START sonar ball. After the correction, the averaged depths of the corrected Deeper Fishfinder START methods were 1.1 ft lower when compared with the sludge survey results from EDI consulting.
Lagoon liquid depth measurement practice with sonar ball
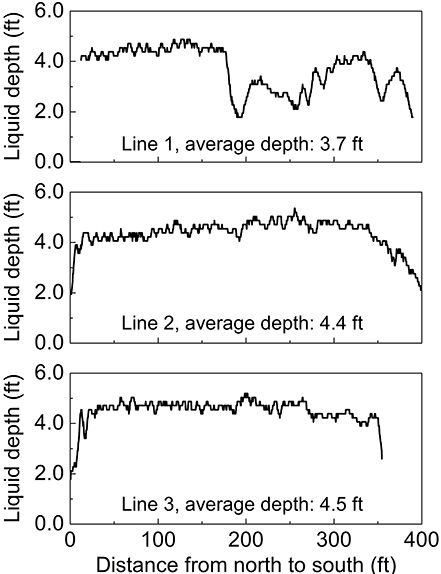
Above results show that the Deeper Fishfinder START sonar ball with lower minimum depth measurement limitation was more accurate than the Deeper Sonar PRO+ sonar ball in measuring the lagoon liquid depth. To conduct a lagoon liquid depth measurement using sonar ball with minimal labor and equipment, measurement could be conducted by two people using kite strings to navigate a small air-filled float housing a Fishfinder START sonar ball and cellphone, across a lagoon surface several times (Figure 4, three blue lines). No liquid depth data could be obtained within the first eight feet of line 1 due to the floating debris. The average liquid depths of line 1, 2 and 3 with the correction of our linear model were 4.4 (average liquid depth before correction of our linear model is 3.7 ft), 5.1 (average liquid depth before correction of our linear model is 4.4 ft), 5.2 ft (average liquid depth before correction of our linear model is 4.5 ft), respectively (Figure 11). Given the surface depth difference due to the different testing days, the absolute lagoon depth of this sonar ball practice was 2.6 ft lower than that of the sludge survey day, and 0.4 ft lower than that of the full-scale lagoon liquid depth measurement day. The average liquid depth of our measurement practice with sonar ball corrected with our linear model was 4.9 ft, which was 2.2 ft lower when compared with the sludge survey liquid depth.
Vertical and horizontal nutrient distribution
Determining the exact dimensions of the lagoon at FM Dairy, which had an oblong shape with curved ends, proved challenging without extensive land surveying detailing the varying depth and surface area. The surface area was estimated to be 2.25 acres using Google Earth Pro. The lagoon depth of the lagoon was 11.0 ft from the sludge survey conducted. The slide slope was approximately 3-to-1, representing the maximum slope permissible to ensure berm stability while minimizing the overall footprint. Considering the lagoon as an elliptical truncated cone geometry, the dairy lagoon capacity was estimated to be 6.11 million gallons, which is 1.39 million gallons lower than a previous estimation (7.50 million gallons) by Lim et al. in 2022.
Table 2 shows the characteristic of the sludge samples, including nitrogen, ammonium, phosphorus, potassium concentrations, moisture contents, pH, electrical conductivity, and carbon content. The moisture content was approximately 97.6% (2.4% solids content) and ranged from 96.3% to 98.4%. In addition to the depth/volume of the lagoon manure, nutrient concentration of the lagoon manure was another set of important variables to estimate the total crop nutrients in the lagoon. As shown in table 2, the average nutrient concentrations calculated based on the two central sampling points (Avg. 2) were higher than that calculated based on the total nine sampling points (Avg. 1), nitrogen: (+29%), phosphorus: (+55%), and potassium: (+16%), except for Ammonium (-5%). Given the limited number of lagoon samples and lack of pump-out samples, there was no comparison with more representative nutrient values. The estimates suggest that the central samples could overestimate the average nutrient concentration, resulting in the overestimation of total amount of the nutrients in the lagoon. More profile samples and uniformly distributed sampling points could improve the estimation precision of the lagoon nutrient amount.
Table 2. Nutrient, moisture, and carbon contents of the different composite lagoon sludge samples
Nitrogen (N)
| Units | 1CE | 2CES | 2CG | 2CEN | 3CES | 3CG | 3CEN | 4CES | 4CEN | Avg. 1* | Avg. 2* | Diff.* |
|---|---|---|---|---|---|---|---|---|---|---|---|---|
| ppm | 729 | 1104 | 1366 | 972 | 1120 | 1356 | 1094 | 808 | 923 | 1052 | 1361 | 29% |
| lb/1000 gal. | 6.1 | 9.2 | 11.4 | 8.1 | 9.3 | 11.3 | 9.1 | 6.7 | 7.7 | 8.8 | 11.4 | 29% |
Ammonium (NH4+-N)
| Units | 1CE | 2CES | 2CG | 2CEN | 3CES | 3CG | 3CEN | 4CES | 4CEN | Avg. 1* | Avg. 2* | Diff.* |
|---|---|---|---|---|---|---|---|---|---|---|---|---|
| ppm | 483 | 520 | 451 | 526 | 492 | 487 | 526 | 538 | 429 | 495 | 469 | -5% |
Phosphorus (P)
| Units | 1CE | 2CES | 2CG | 2CEN | 3CES | 3CG | 3CEN | 4CES | 4CEN | Avg. 1* | Avg. 2* | Diff.* |
|---|---|---|---|---|---|---|---|---|---|---|---|---|
| ppm | 172 | 336 | 440 | 211 | 321 | 456 | 284 | 185 | 204 | 290 | 448 | 55% |
| lb P2O5/ 1000 gal | 3.3 | 6.4 | 8.4 | 4.0 | 6.1 | 8.7 | 5.4 | 3.5 | 3.9 | 5.5 | 8.6 | 55% |
| lb P/ 1000 gal | 1.4 | 2.8 | 3.7 | 1.8 | 2.7 | 3.8 | 2.4 | 1.5 | 1.7 | 2.4 | 3.8 | 55% |
Potassium (K)
| Units | 1CE | 2CES | 2CG | 2CEN | 3CES | 3CG | 3CEN | 4CES | 4CEN | Avg. 1* | Avg. 2* | Diff.* |
|---|---|---|---|---|---|---|---|---|---|---|---|---|
| ppm | 805 | 743 | 802 | 759 | 746 | 765 | 759 | 719 | 713 | 674.7 | 783.5 | 16% |
| lb K2O/ 1000 gal | 8.05 | 7.43 | 8.02 | 7.59 | 0.07 | 7.65 | 7.59 | 7.19 | 7.13 | 6.7 | 7.8 | 16% |
| lb K/ 1000 gal | 6.68 | 6.17 | 6.66 | 6.30 | 0.06 | 6.35 | 6.30 | 5.97 | 5.92 | 5.6 | 6.5 | 16% |
Moisture
| Units | 1CE | 2CES | 2CG | 2CEN | 3CES | 3CG | 3CEN | 4CES | 4CEN | Avg. 1* | Avg. 2* | Diff.* |
|---|---|---|---|---|---|---|---|---|---|---|---|---|
| % | 98.4 | 97.4 | 96.2 | 98.2 | 97.6 | 96.3 | 97.8 | 98.3 | 98.1 | 97.6 | 96.3 | -1% |
pH
| Units | 1CE | 2CES | 2CG | 2CEN | 3CES | 3CG | 3CEN | 4CES | 4CEN | Avg. 1* | Avg. 2* | Diff.* |
|---|---|---|---|---|---|---|---|---|---|---|---|---|
| Level | 8.0 | 8.0 | 8.0 | 8.1 | 8.1 | 8.0 | 8.1 | 8.1 | 8.1 | 8.1 | 8.0 | -1% |
Electrical Conductivity (E.C.)
| Units | 1CE | 2CES | 2CG | 2CEN | 3CES | 3CG | 3CEN | 4CES | 4CEN | Avg. 1* | Avg. 2* | Diff.* |
|---|---|---|---|---|---|---|---|---|---|---|---|---|
| mmho/ cm | 3.0 | 10.1 | 2.8 | 3.1 | 2.1 | 2.7 | 2.7 | 3.4 | 2.5 | 3.6 | 2.8 | -24% |
Carbon (C)
| Units | 1CE | 2CES | 2CG | 2CEN | 3CES | 3CG | 3CEN | 4CES | 4CEN | Avg. 1* | Avg. 2* | Diff.* |
|---|---|---|---|---|---|---|---|---|---|---|---|---|
| % | 0.6 | 0.9 | 1.2 | 0.6 | 0.9 | 1.3 | 0.8 | 0.6 | 0.6 | 0.8 | 1.3 | 50% |
Notes:
Avg. 1 = averaged value of sampling points 1CE, 2CES, 2CG, 2CEN, 3CES, 3CG, 3CEN, 4CES, 4CEN.
Avg. 2 = averaged value sampling points 2CG, 3CG (two central sampling points).
Diff. = percentage difference between Avg. 2 and Avg. 1. The equation was 100% (Avg. 2-Avg. 1)/Avg. 1.
Table 3 shows the manure composition variations at different lagoon depths (profile samples) for the unagitated lagoons. The concentrations of nitrogen and phosphorous varied with the lagoon depth, which was in agreement with the trend reported in the Section of Manure Characteristics in the book of Manure Management Systems Series. However, the depth of the profile samples seemed to have relatively little impact on ammonium and potassium concentrations. Notably, the moisture contents seemed to be abnormal at the sample of 2CG bottom 1/3 depth, which may be due to improper sampling or measurement.
Table 3. Characteristics of profile sludge samples collected at the central points of lagoon.
Nitrogen (N)
| Units | 2CG | 2CG | ||||
|---|---|---|---|---|---|---|
| top 1/3 depth | middle 1/3 depth* | bottom 1/3 depth* | top 1/3 depth | middle 1/3 depth* | bottom 1/3 depth* | |
| ppm | 554 | 2022 | 1522 | 555 | 2393 | 1120 |
| lb/1000 gal. | 4.6 | 16.8 | 12.8 | 4.6 | 20.0 | 9.3 |
Ammonium (NH4+-N)
| Units | 2CG | 2CG | ||||
|---|---|---|---|---|---|---|
| top 1/3 depth | middle 1/3 depth* | bottom 1/3 depth* | top 1/3 depth | middle 1/3 depth* | bottom 1/3 depth* | |
| ppm | 443 | 541 | 369 | 530 | 384 | 547 |
Phosphorus (P)
| Units | 2CG | 2CG | ||||
|---|---|---|---|---|---|---|
| top 1/3 depth | middle 1/3 depth* | bottom 1/3 depth* | top 1/3 depth | middle 1/3 depth* | bottom 1/3 depth* | |
| ppm | 71 | 613 | 636 | 63 | 1029 | 276 |
| lb P2O5/1000 gal | 1.4 | 11.7 | 12.2 | 1.2 | 19.6 | 5.3 |
| lb P/1000 gal | 0.6 | 5.1 | 5.3 | 0.5 | 8.6 | 2.3 |
Potassium (K)
| Units | 2CG | 2CG | ||||
|---|---|---|---|---|---|---|
| top 1/3 depth | middle 1/3 depth* | bottom 1/3 depth* | top 1/3 depth | middle 1/3 depth* | bottom 1/3 depth* | |
| ppm | 844 | 700 | 862 | 689 | 861 | 745 |
| lb K2O/1000 gal | 8.4 | 7.0 | 8.6 | 6.9 | 8.6 | 7.5 |
| lb K/1000 gal | 7.0 | 5.8 | 7.2 | 5.7 | 7.1 | 6.2 |
Moisture
| Units | 2CG | 2CG | ||||
|---|---|---|---|---|---|---|
| top 1/3 depth | middle 1/3 depth* | bottom 1/3 depth* | top 1/3 depth | middle 1/3 depth* | bottom 1/3 depth* | |
| % | 99.3 | 65.9 | 123.4a | 99.3 | 92.7 | 96.9 |
Notes: The corresponding parameters of middle 1/3 depth sample = 2 * (those of 2/3 depth sample) – (those of top 1/3 depth sample).
The corresponding parameters of bottom 1/3 depth sample = 3 * (those of full depth sample) - 2 (those of 2/3 depth sample).
ª This calculated value is erroneous, likely due to improper sampling or measurement.
Conclusions
Measuring and regular monitoring the lagoon depths are important aspects of manure management and environmental stewardship. It helps farmers comply with regulations, plan for storage capacity and maintenance, and manure nutrients management. The popular sonar ball could be a simple and easy method to estimate the liquid depth of the manure lagoon, but slightly underestimates the liquid depth compared with the disc on a rope method. However, the measurement can be practical especially when a correction model can be established before each full-scale measurement.
The minimum depth measurement limitation of a specific sonar ball is an important selection criterion for lagoon liquid depth measurement. The depth of a manure lagoon is commonly under 20 ft, and especially shallow along the edges, which are typically much lower than the depth measurements of the commercial sonar ball for fishing. So, a sonar ball device that has a relatively lower depth measurement limitation should be selected to improve the lagoon liquid depth measurement accuracy. Furthermore, commercial sonar balls typically underestimate the liquid depth values, and a linear model could be developed for each lagoon to correct the measurements. A few representative dept measurements at the deeper portion of the lagoon have greater impact in estimating the total volume and nutrients anyway.
Moreover, the lagoon sampling depth affects the nutrient concentration, especially nitrogen and phosphorous. The lagoon sampling method impacts the estimation of the total nutrient contents. A simple method, such as disc on a rope or sonar ball with appropriate correction factor can be used to estimate lagoon liquid depth. When coupled with just a few sludges sampling and nutrient analysis, the total sludge level and nutrient available in the lagoon can be estimated for nutrient management plan.
Acknowledgement
Funding is provided by USDA-NIFA, grant award (2018-68011-28691) and University of Missouri Extension.
References
- Mahmoud Sharara. 2020. Sludge survey methods for anaerobic lagoons.
- Philip W. Westerman, Karl A. Shaffer, J. Mark Rice. 2008. Sludge survey methods for anaerobic lagoons.
- Teng Teeh Lim, Tim Canter, Joseph Zulovich. 2022. Lagoon solids removal and solid separation system improvement at a dairy farm.
- Jeff Lorimor, Wendy Powers, Al Sutton. 2004. Manure characteristics.