Access to high-speed internet, or broadband, encourages equitable distance-learning, remote-work, quality-of-life and entrepreneurial opportunities. The COVID-19 pandemic not only reinforced but also elevated the importance of household access to high-speed internet.
This primer provides background information about current issues related to broadband access — both availability and adoption. It defines often-used broadband terminology, discusses the pros and cons of different broadband technologies and illustrates broadband availability and adoption levels across Missouri and the U.S. It concludes by outlining next steps communities can take to enhance broadband availability and adoption in their regions.
Key takeaways
- From 2015-19, 37% of Missourians did not have wired broadband in their homes (Figure 4).
- At home, the need for high-speed internet access increases as multiple people in a household participate in distance learning, stream movies or otherwise use the internet.
- Fiber, cable and DSL are currently the optimal technologies for delivering internet to households. They are faster, more reliable and can be less expensive than other technologies.
- Broadband increases quality of life, enhances business and entrepreneurial activity and boosts the local economy.
- Communities can increase broadband access through collaborative action. Because communities have different assets, they may need different broadband action plans.
- Increasing broadband adoption may enhance internet service providers’ ability to expand access. Working together, communities and local internet service providers can leverage existing programs to accomplish broadband connectivity goals.
Table 1. Minimum download speeds required for various activities.
| Activity | Minimum download speed (Mbps) | |
|---|---|---|
 |
Internet browsing, social media and email | 1 |
 |
High-definition personal video call | 1.5 |
 |
Streaming standard-definition video | 3 to 4 |
 |
Online multiplayer gaming | 4 |
 |
High-definition video teleconferencing | 6 |
 |
File downloading | 10 |
 |
Online learning | 5 to 25 |
 |
Telecommuting | 5 to 25 |
 |
Streaming ultra high-definition 4K video | 25 |
| Source: MU Extension Exceed graphic created using data from the FCC Broadband Speed Guide, 2020. Note: Additional speed may enhance performance. Speeds assume running one activity at a time on one device. | ||
Broadband means high-speed internet
The term “broadband” refers to relatively fast internet connections for sharing information. The Federal Communications Commission (FCC) defines broadband as an internet connection with at least 25 Mbps (megabits per second) of download speed and at least 3 Mbps of upload speed — often known as 25/3. As of this writing, most FCC-subsidized new internet infrastructure has been for networks capable of providing at least 100 Mbps of download speed.
Practically, 25/3 serves as a moderate speed suitable for one or two individuals browsing the internet, using email, streaming standard-definition videos and playing basic online games (Table 1). Given how the COVID-19 pandemic changed internet connection needs, the 25/3 broadband threshold may seem inadequate, yet 37% of Missourians do not have it at home. If a household has multiple users accessing one connection at the same time — especially for learning online, telecommuting or streaming high-definition video — the 25/3 threshold is likely insufficient.
Broadband internet’s definition has evolved to reflect the increasing demand for faster connections. Since 2015, 25/3 has been the FCC definition. The download speed — here, 25 Mbps — has historically been much higher than the upload speed — here, 3 Mbps — as households downloaded much more than they uploaded. Two present-day situations, however, change this connection speed needs: 1) more teleworking and at-home online learning and 2) multiple people in a household using broadband services simultaneously.
Understanding internet technologies
Beginning in the 1980s, small businesses and households usually accessed the internet using telephone dial-up service, which provided slow speeds and led to transmission interruptions. Innovation focused on developing alternatives more reliable than dial-up service. Today, internet technologies include fiberoptic, cable, DSL (digital subscriber line), fixed wireless, satellite and cellular. Fiber, cable and DSL-type technologies are considered fixed (i.e., stationary) wireline internet technologies. These technologies generally offer faster connections and the most reliability because they are not affected by weather or line-of-sight issues between towers and users.
Fiber is currently the preferred internet delivery technology because it carries the greatest potential for reliably transmitting large amounts of information. Fiber service has a high cost, however, because it uses dedicated infrastructure composed of fiberoptic cables.
Conversely, cable and DSL connections rely on existing infrastructure but can be slower. Cable uses the same coaxial cables that deliver cable television service to many households. It is considered suitable for most broadband connections. Less preferred than fiber or cable for internet access, DSL uses traditional copper telephone lines to supply internet service.
Fixed wireless or radio frequency technology represents another option. It involves connecting a transmitter to a wired internet source and situating the transmitter atop a tall structure. The transmitter converts the wired internet signal into radio waves and transmits these waves through the air. Nearby homes and businesses with the appropriate receptors can intercept these radio waves and use the resulting broadband connection. Thus, fixed wireless presents advantages where terrain or distance precludes laying fixed wire. However, the technology requires a clear line of sight between transmitter and receptor, and only homes and businesses within roughly 10 miles of the fixed wireless transmitter can access the connection. Think of fixed wireless broadband as “Wi-Fi for communities.” Just as a Wi-Fi router wirelessly transmits a broadband connection throughout your home, a fixed wireless transmitter disseminates a broadband connection throughout a community — no wires needed.
For many rural residents and businesses, fixed broadband is not available. They may only have high-Earth orbit satellite technology as a broadband option. Satellite connections cut out the costliest portions of wireline infrastructure — the poles, wire, pole attachments and their associated costs and fees. However, satellite has latency problems (i.e., short delays), low reliability with respect to providing a stable connection through changes in topography and weather conditions and data caps. These issues make it an inferior technology for connecting to the internet.
Finally, some households access the internet through cellular service plans and smartphones or portable hotspot devices. In particular, consumers widely used hotspots during the COVID-19 pandemic to provide short-term internet access. In general, however, smartphones and hotspots are not viewed as long-term solutions to inadequate broadband access because they are not reliable, fast or cost-effective enough to meet most home and business needs.
Broadband availability and adoption in Missouri varies by place
Availability and adoption constitute two distinct measures of broadband service. Availability measures the presence of broadband infrastructure, and adoption measures the infrastructure’s use. The maps on the following pages show broadband availability and broadband adoption using the most recent available data.
Broadband availability is highest in the northern Plains and Upper Midwest, parts of the West Coast and mountain states, the Northeast and metro areas in the South (Figure 1). Broadband availability is lowest in the rural South and Southwest and parts of the West.
Missouri has several pockets of low broadband availability — notably, parts of southern, southeastern and west central Missouri (Figure 2).
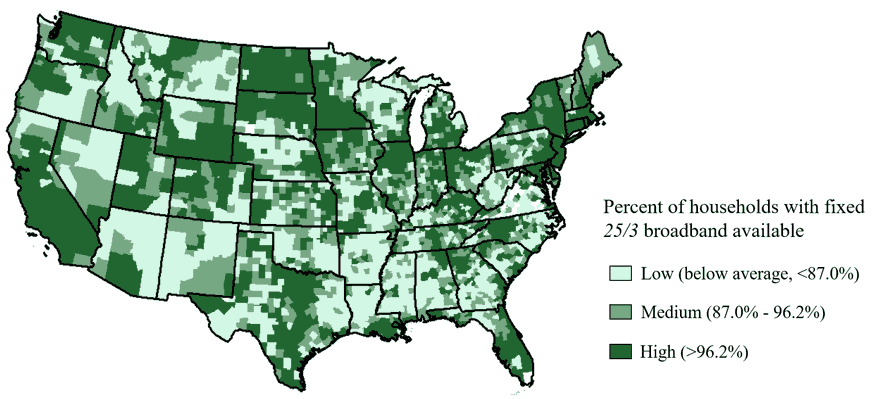
Figure 1. Fixed broadband availability, U.S. counties. (Source: MU Extension Exceed map using FCC Form 477 data, December 2019).
Note: This map includes only fixed wireline broadband availability (i.e., not satellite, fixed wireless or cellular).
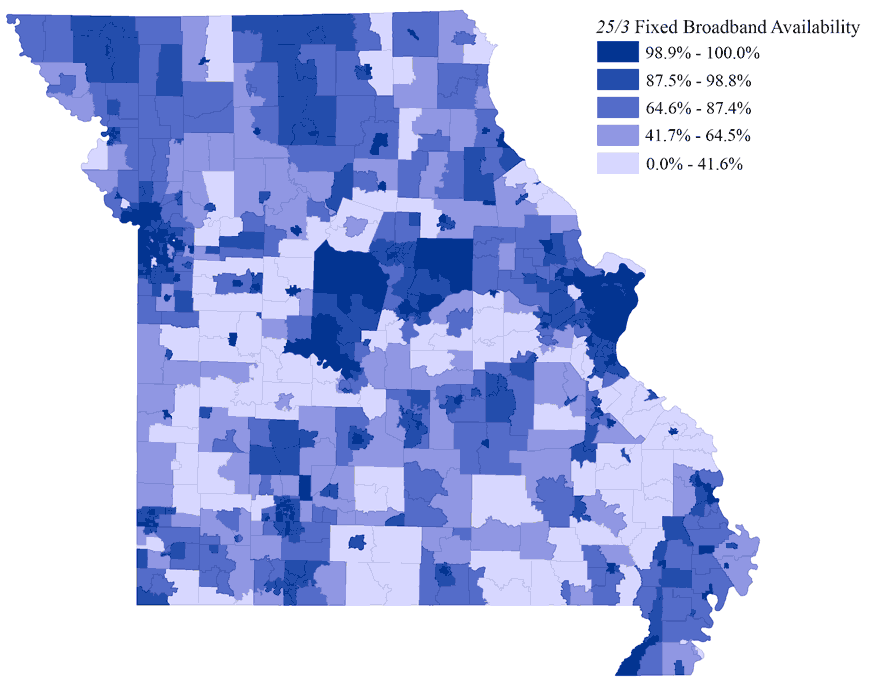
Figure 2. Fixed broadband availability, Missouri census tracts. (Source: MU Extension CARES map using FCC Form 477 data, June 2020).
For the U.S., the broadband adoption (Figure 1) and availability (Figure 3) maps look similar, but some differences exist. The Northeast remains high on both measures, and generally, the map shows pockets of high adoption in areas with high availability. Note one difference, however. The adoption map lacks the same level of geographic clustering. You see counties with high adoption surrounded by low-adoption counties. This is particularly evident near cities.
Income drives much of the difference between availability and adoption. If subscription costs are too high, then households will not adopt.
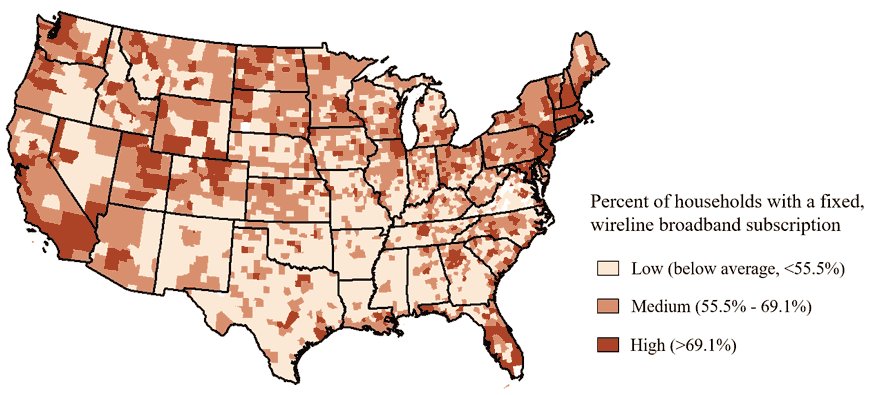
Figure 3. Fixed broadband adoption, U.S. counties. (Source: MU Extension Exceed map using ACS data, 2015-19).
Note: This map includes only fixed wireline broadband availability (i.e., not satellite, fixed wireless or cellular).
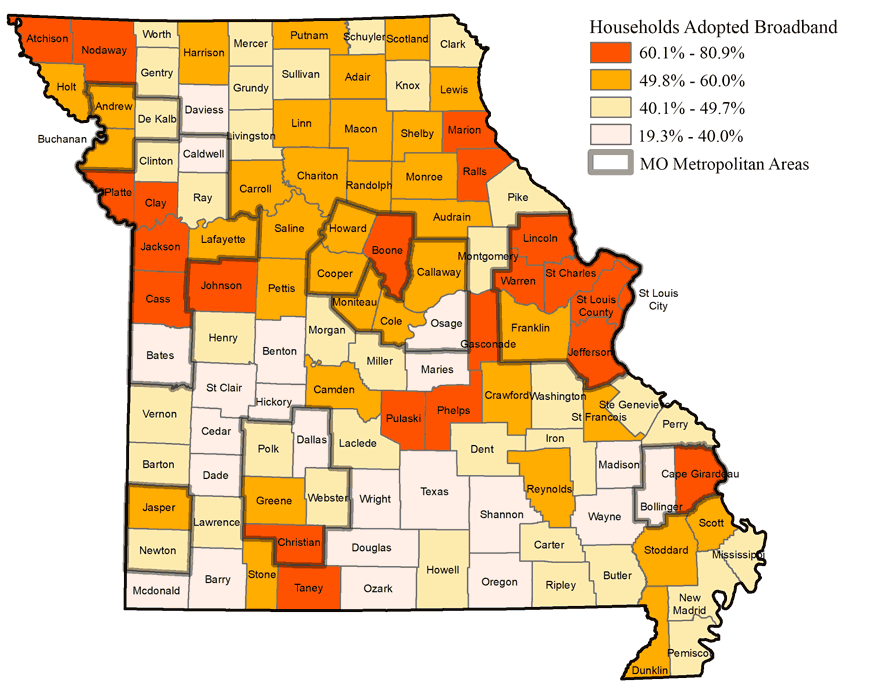
Figure 4. Missouri county household broadband adoption, 2015-19. (Source: MU Extension Exceed map using ACS data, 2015-19).
Note: This map includes only fixed wireline broadband availability, not satellite, fixed wireless or cellular availability.
Broadband is important to the economy and quality of life
Research shows increased broadband availability or adoption correlates with higher productivity or economic output2, higher median household income3 and more employment4 within communities. Broadband may also help attract businesses and spur entrepreneurship.5,6 Evidence about how broadband affects residential home values is mixed, however.7
Broadband’s value extends beyond economic impacts (e.g., job, income and economic output growth). It includes quality-of-life improvements and other benefits that are easy to recognize but harder to quantify. Research in the past decade provides a solid, if conservative, approach to understanding how a community’s economy can gain from broadband expansion (e.g., broadband construction investment, telemedicine, education productivity, household income and employment). Using this research, MU Extension estimated 10-year broadband expansion economic benefits for three Missouri counties (PDF).
The COVID-19 pandemic demonstrated that households having fast, reliable and affordable broadband access could continue to work, attend school, receive medical consultations and stay in touch with friends and family over the internet. Even before the pandemic began, broadband was increasingly essential for households and businesses alike. Accordingly, quality broadband access (i.e., fixed broadband) plays a crucial role in community resilience.
Costs and geography are barriers to broadband provision
When considering broadband infrastructure investments, internet service providers (ISPs) such as Mediacom, CenturyLink and Co-Mo Connect weigh broadband infrastructure costs against the revenue they can gain from customers subscribing to their service. Rural areas yield a lower return on investment (ROI) — the revenue generated from the infrastructure investment — simply because they have fewer subscribers per mile of cable or fiber installed. Coined the “last mile” problem, this situation means the lower the population density, the less profit ISPs generate from infrastructure investments.
ROI also hinges on the percentage of subscribers who are offered the service and actually adopt it — known by ISPs as the “take rate.” The higher the take rate, the higher the ROI. To break even, many ISPs assume a 30% to 50% take rate. Communities demonstrating a higher potential take rate may be more likely to receive high-speed, fixed internet service (e.g., in Socket Fiberhoods, the infrastructure may be built after a certain share of neighborhood residents request the service).
Additional barriers to broadband service provision include existing infrastructure, land ownership and geography. Common questions include who owns existing poles, and how much are pole attachment fees? Additionally, building infrastructure through federally owned land, wetlands and rocky or hilly terrain will cost more than on flat cropland where an easement exists.
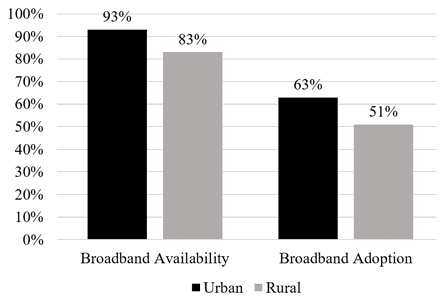 Figure 5. Broadband availability and adoption in urban and rural U.S. counties. (Source: MU Extension Exceed graph using FCC Form 477 data from December 2019 and ACS data from 2015-19. Availability and adoption include only fixed wireline technologies.)
Note: Counties are classified as urban if they are part of a metropolitan statistical area, and rural counties are nonmetropolitan. These numbers are county averages unweighted by population and thus may differ from top-line FCC estimates.
The price of broadband service discourages adoption for many consumers, particularly lower income households. Even if broadband internet infrastructure exists, monthly subscription costs, one-time installation fees and the expense incurred to buy a reliable computer create barriers. Although imperfect, the broadband adoption maps (Figures 3 & 4) show trends toward lower adoption in many areas despite availability. The data in Figure 5 confirm this issue; broadband adoption lags availability in urban and rural counties. Some of this lag may be explained by the differing time period between the datasets, but it otherwise suggests that price may be a barrier in urban and rural counties. Economics suggests that competition (i.e., multiple ISPs) will decrease subscription costs. Another adoption barrier may be digital literacy, defined as one’s ability and confidence to navigate and utilize the internet.
In summary, because of high broadband investment costs and their low population density, communities located in the “last mile” to a provider can have very low if not negative ROI. However, increasing broadband adoption will likely enhance the ROI that ISPs can capture and increase a provider’s ability to offer service to additional households. By incentivizing increased broadband adoption and lowering the cost of ISPs’ infrastructure, policies and programs can increase provider ROI and spur gains in broadband availability.
Policy solutions to increase availability and adoption
Federal policy and programs
Several federal programs to enhance broadband availability and broadband adoption have existed, and the December 2020 COVID-19 relief act authorized more. For example, the FCC Emergency Broadband Benefit Program aims to increase household broadband adoption by reimbursing ISPs for broadband subsidies provided to eligible households. More prevalent, however, are grant and loan guarantee programs targeting infrastructure projects in unserved and underserved areas, including rural areas and tribal nations.
Access to accurate broadband availability data supports increasing broadband access. That’s because fixing access problems requires first understanding where the problem is acute. Unfortunately, federal broadband data tend to overstate coverage and available speed. (See Broadband Availability and Adoption box). Passed in 2020, the Broadband DATA Act attempts to remedy this issue by requiring the FCC to improve the accuracy of its broadband data and maps — namely through data verification processes. It also requires FCC to build a Broadband Serviceable Location Fabric that identifies all potential buildings that may need a broadband connection.
State policy and programs
Recent research provides evidence of state broadband funding programs’ effectiveness8. In Missouri, one prominent initiative is the Missouri Broadband Grant Program. Started in 2018, the program awards grants to help broadband providers, communities and regions make broadband infrastructure investments in unserved and underserved parts of the state. The funding may support broadband installation and related activities such as permitting, installation and planning. Organizations eligible for funding include corporations, nonprofits, electric cooperatives and communities.
Encouraging municipal broadband provision is another strategy worth consideration. Recent research found that removing state municipal broadband provision prohibitions increased availability by 3 percentage points in the state8. As an example, Houston, Missouri, recently began providing municipally owned broadband. A core fiber ring was installed around the city in summer 2020, and residential installation followed. Speeds of up to 1,000 Mbps are offered.
In your community
Because communities have different physical, economic and cultural environments, effective broadband plans may vary by region. However, regions that have successfully increased broadband availability and adoption share a common thread — community-led, collaborative action.
For resources on how to improve your community’s digital connectivity, see the UM System’s Digitally Connected Community Guide (No longer available online.). It seeks to empower individuals to collaboratively create digitally connected communities. It covers topics such as how to engage stakeholders, how to conduct community needs assessments and how to identify public-private partnerships.
Additional resources
University of Missouri System in cooperation with MU Extension has several resources:
Purdue’s Digital Divide Index Story Map for the U.S.
Oklahoma State University has published multiple broadband guides, case studies and reports.
Endnotes
- Congressional Research Service. (2019). Broadband Data and Mapping: Background and Issues for the 116th Congress.
- Gallardo, R., Whitacre, B., Kumar, I., & Upendram, S. (2020). Broadband metrics and job productivity: A look at county-level data. The Annals of Regional Science, 1-24.
- Whitacre, B., Gallardo, R., & Strover, S. (2014). Broadband’s contribution to economic growth in rural areas: Moving towards a causal relationship. Telecommunications Policy, 38(11), 1011-1023.
- Kolko, J. (2012). Broadband and local growth. Journal of Urban Economics, 71(1), 100-113.
- Mack, E. A., Anselin, L., & Grubesic, T. H. (2011). The importance of broadband provision to knowledge intensive firm location. Regional Science Policy & Practice, 3(1), 17-35.
- Conroy, T. and Low, S. (forthcoming). Entrepreneurship, Broadband, and Gender: Evidence from Establishment Births in Rural America. International Review of Regional Science.
- An industry-funded working paper finds evidence of a housing value bonus for broadband access that is higher for rural areas (Molnar, G., Savage, S. J., & Sicker, D. C. (2015). Reevaluating the broadband bonus: Evidence from neighborhood access to fiber and United States housing prices (PDF). Fiber to the Home Council Americas. Another study finds no effect on rural housing values, however (Conley, K and B. Whitacre. (2020). Home is where the internet is? High-speed internet’s impact on rural housing values. International Regional Science Review, 43(5), 515-530.
- Whitacre, B., & Gallardo, R. (2020). State broadband policy: Impacts on availability. Telecommunications Policy, 44(9), 102025.
The authors thank the following individuals for their assistance and input
Alice Roach, University of Missouri; Hannah McClure, University of Missouri; Justin Krohn, University of Missouri; Alex Wyglinski, Worcester Polytechnic University; Brian Whitacre, Oklahoma State University; Marcus McCarty, University of Missouri–Kansas City; and Matt Kohly, Socket Telecom LLC.