Entrepreneurial dynamics — the flow of business startups and business turnover, or churn, in a place — shape economic growth. Entrepreneurs may spark economic growth and development by contributing to employment growth, innovation, quality of life and economic resilience in their communities.
Key takeaways
- Promoting entrepreneurship, particularly in rural areas, may encourage economic growth and increase a community’s quality of life and resilience to economic or natural disasters.
- Missouri had high entrepreneurial dynamics levels compared with neighboring states, 2013–16.
- Entrepreneurial dynamics create information, such as how certain products or businesses performed in a particular place, that other entrepreneurs and local lenders can use.
- Counties with high levels of entrepreneurial dynamics tended to feature colleges, tourism, a mining boom or highways that attract people. Increasing access to outside markets through internet sales and improved marketing can increase local businesses’ customer bases.
This guide focuses on churn’s role in entrepreneurial dynamics. Churn measures businesses entering and exiting a market. It’s the sum of the startup rate (startups per capita/1,000) and business closure rate (business closures per capita/1,000). It only considers businesses with paid employees. Read more about nonemployer businesses with no paid employees in Missouri Economy Indicators, Issue 9 (PDF).
Areas with high churn — that is, those with rapid business turnover — record faster economic growth.1 However, undoubtedly, a business closure is bad for the particular business’ employees and owner.
Churn can enhance economic vitality
Churn creates information as businesses open and close — a process known as creative destruction. A business opening or closing reveals how certain products, business strategies or business sizes perform in a particular place. Others in the region can use this information to improve their own businesses because churn shows what does and does not work in an area.
Low churn yields little new information and may make economic development through entrepreneurship more challenging because less is known, for example, about consumer demand for given services in a particular location. In low-churn areas, new businesses have fewer peers or mentors from which to learn, and obtaining a bank loan can be difficult due to market uncertainty, which creates business plan uncertainty.2
From 2009 to 2017, churn in Missouri counties was positively correlated with employment growth (Pearson’s correlation coefficient=0.17). However, income growth and churn rates had no correlation (Pearson’s correlation coefficient not statistically significantly different from zero). These findings suggest Missouri has a relatively entrepreneurial culture and its entrepreneurs create jobs but not necessarily high-paying jobs.
No correlation between entrepreneurship and income growth in Missouri — different from the two factors’ positive correlation found for the U.S. overall — suggests few Missouri entrepreneurs operate in high-value industries or export outside of their region. This is likely due to Missouri’s industry mix being light on high paying white-collar jobs. Creating new jobs, even not high-paying ones, may reduce rural population loss and improve quality of life because people like living near grocery stores, restaurants and other services.
Missouri churn is higher than U.S. churn
Compared with the national average and neighboring states, Missouri had a high churn rate in 2016 (Figure 1). This generally bodes well for Missouri, given the link between churn and economic growth. Again, churn creates market information that entrepreneurs can use to succeed in business, despite other businesses failing.
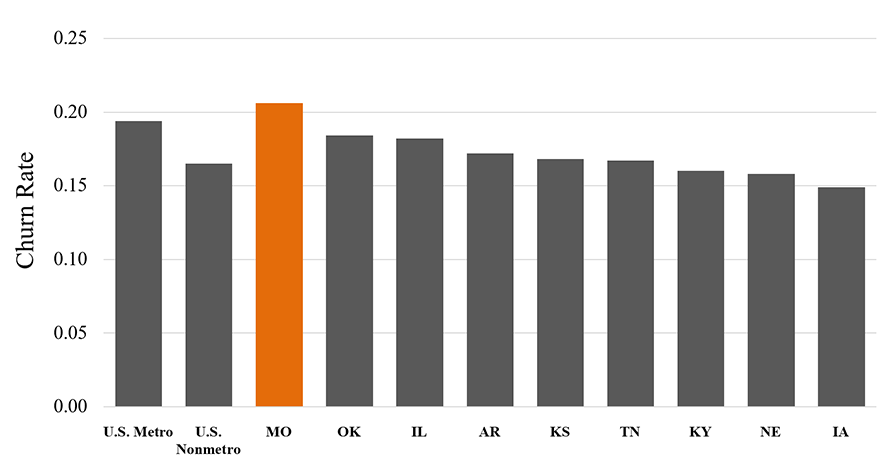
Figure 1. Employer establishment churn rate, 2016. (Source: Census Bureau Business Dynamics Statistics) Note: 2016 was the most recent available data.
Nationally, below-average churn dominated in the South and East, 2013–16 (yellow, Figure 2). Areas with relatively high churn rates included New England, the Pacific Northwest, the Rocky Mountains, the Great Plains and the Missouri Ozarks (blue, Figure 2).
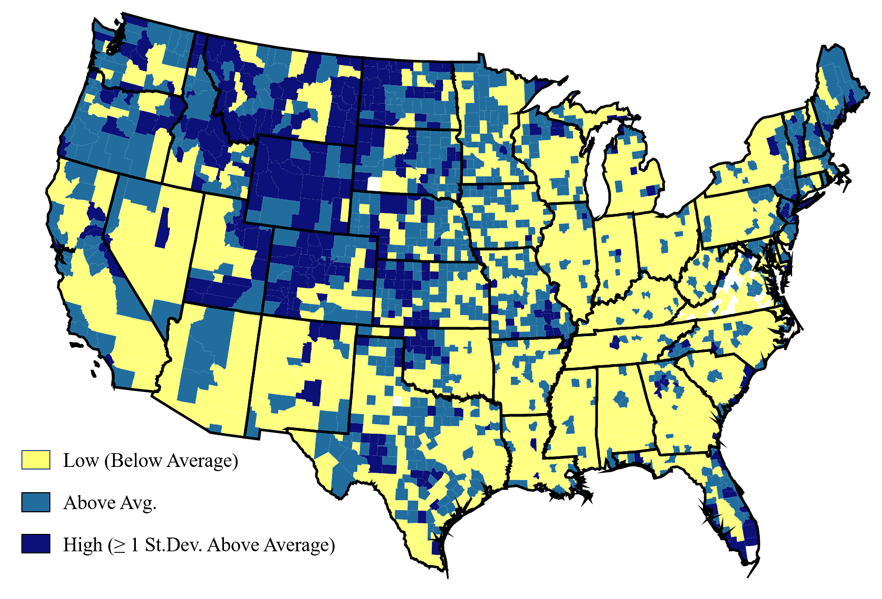
Figure 2. Employer establishment churn rates by county, 2013-16. (Source: Census Bureau Business Dynamics Statistics) Note: 2016 was the most recent available data; a multiyear average better represents entrepreneurial dynamics in counties with fewer business startups and closures.
Business churn varying along a state border suggests state-specific factors affect churn. The south and southeast parts of Missouri featured higher churn than adjacent counties in other states from 2013 to 2016. This difference, likely policy-driven, may correspond with an easier process to establish businesses in Missouri or business restrictions in neighboring states.
Churn varies across Missouri
Missouri’s metropolitan centers, northwest corner and southern region experienced relatively high churn from 2013 to 2016 (Figure 3). Many of the state’s above-average and high-churn counties cluster around tourist destinations, college towns and southeastern Missouri’s lead district. These places all draw nonresidents, so local businesses serve more than permanent residents.
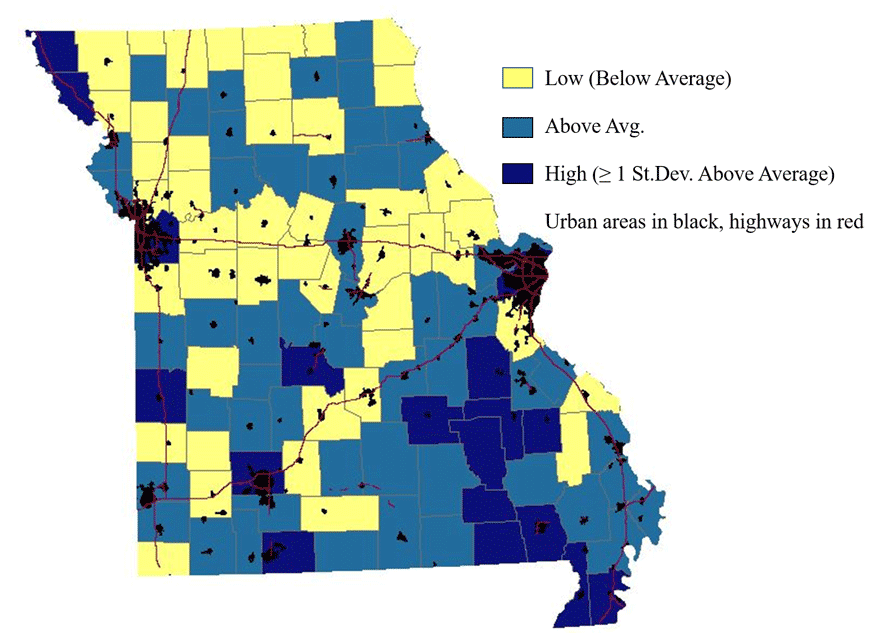
Figure 3. Employer establishment churn rates by county for Missouri, 2013-16. (Source: Census Bureau Business Dynamics Statistics) Note: 2016 was the most recent available data; a multiyear average better represents entrepreneurial dynamics in counties with fewer business startups and closures.
Between 2013 and 2016, many northern and central Missouri counties recorded low churn, driven by relatively low business birth and death rates. Many had slow population growth or population loss from 1996 to 2017 (see MU Extension publication DM4013, Third Class County Population Change and Budget Fiscal Ratios. This could limit new businesses to providing essential goods and services for the local market (e.g., grocery stores).
How to interpret churn rates
Carefully consider churn rates from county to county. In sparsely populated counties, one or two new businesses can significantly increase the birth rate, which also increases the churn rate. For example, growing demand for home health care aids, who are sometimes considered employer-establishment businesses in the data but look like nonemployer establishments, can increase churn rates.3 Also, carefully consider churn in counties highly dependent on a single industry — such as mining, agriculture or manufacturing — that may have boom-and-bust periods as prices fluctuate.
Churn can also mask especially high birth rates. For example, counties along Highway 65, which runs south of Sedalia to Branson and north of Marshall/Saline County, had high birth rates and low death rates, 2013–16. Highway 65 may bring customers to relatively sparsely populated counties, particularly in northern Missouri. Additionally, it passes near tourist areas such as Truman Lake and Bennett Springs State Park.
Source
- Low, S.A., Sanders, A. and White M.C. “The Future of Work in Missouri: Rural-Urban Differences in Entrepreneurship.” Missouri Policy Journal, vol.9. (2020).
Endnotes
- Haslag, J.H. “Births, Deaths and Economic Growth: How important is churn for state growth?” Show-Me Institute Essay. December. (2016).
- Kravchenko, N., Weiler, S. and R. Phillips. “Information Externalities and Small Business Lending by Banks: A Comparison of Urban and Rural Counties in the U.S.” (2011).
- More information on how the home health aide industry can affect entrepreneurial dynamics, Missouri Economic Research and Information Center website.
The authors thank Alice Roach for editorial assistance and Hannah McClure for production and design assistance. This research was supported in part by the Hammond Institute’s Center for Economics and the Environment, Lindenwood University.