Access to quality, affordable child care is an important issue with far-reaching implications. Most importantly, children of working parents benefit from high-quality early care that promotes healthy development.1 At the same time, access to child care enables parents to find and keep jobs that support their families financially. Businesses benefit when parents of young children can work, as they expand the labor force. Employed parents also contribute to local and state revenues through taxes.
This guide outlines the significant economic toll that inadequate child care access imposes on Missouri’s economy. Each year, businesses across the state incur an estimated $951 million in lost productivity and employee turnover costs due to child care-related work disruptions (Table 1). The resulting wage losses among affected parents also lead to a $194 million reduction in state and local tax revenues. Together, the annual cost to businesses and governments is estimated to exceed $1.14 billion.
Table 1. Annual Missouri economic impact due to child care access issues.
| Category | Losses |
|---|---|
| Missouri businesses | $950,923,799 |
| State tax revenue | $101,657,628 |
| Local tax revenue | $92,591,354 |
| Total | $1,145,172,781 |
By quantifying these economic impacts, this guide aims to help business and community leaders understand that investments in accessible, quality child care are indispensable to workforce and economic development.
Background
Child care access is a pressing issue both nationally and in Missouri. Recent research, including reports from Child Care Aware of Missouri and a University of Missouri Extension analysis (PDF), demonstrates that access to child care remains a significant issue in the Show-Me State. Many parents must quit their jobs because they can’t find child care that’s nearby or affordable. In Missouri, child care can cost almost 14% of what a typical family earns. Missouri businesses also feel the impact, as four out of five employers agree that the high cost and limited availability of child care keep many Missourians out of the workforce.2
Missouri businesses have long identified workforce shortages as an obstacle to growth.3 This ongoing challenge is reflected in the state’s persistently tight labor market, with unemployment rates remaining below 4% for several years. Multiple factors contribute to the shortage, including an aging population and declining birth rates, and these trends show no signs of easing. Expanding access to child care is a key strategy for helping more Missourians enter and remain in the workforce.
Behind the numbers
This economic impact analysis builds on the methodology used in a 2021 U.S. Chamber of Commerce Foundation survey and analysis, which estimated that breakdowns in Missouri’s child care system resulted in $1.35 billion in lost economic potential.4 The survey assessed costs to employers stemming from worker absences and turnover. When parents miss work due to child care challenges, businesses incur costs through lost productivity or by paying overtime and hiring temporary workers. If a parent leaves the workforce entirely, employers face additional turnover costs, including productivity losses and expenses related to recruiting and training new employees. To estimate lost tax revenue, the Chamber assumed that reduced parental income leads to lower income, sales and property tax collections.
Our analysis expands on this foundation with updated data, where applicable, and county-level estimates to better understand how child care access issues impact local businesses and governments in Missouri.
Business cost calculations
When child care is unreliable or unavailable, working parents miss work, which can lead to substantial financial consequences for businesses. For instance, a working parent who relies on a family member for child care may have to stay home if that caregiver becomes ill or suddenly unavailable. According to the Chamber’s 2021 survey, 61% of Missouri employed parents missed an average of 12 workdays per year due to child care issues.
When employees miss work, the cost to businesses is often equal to what they would have paid in wages during that time. That’s because the work still needs to get done, so a business may lose sales or productivity due to an employee’s absence, or pay for temporary or overtime help, which often adds up to a similar cost. To estimate the business cost per worker, the calculation assumes 12 missed workdays and multiplies that by the median hourly wage.5 That per-worker cost was multiplied by the nearly 238,000 parents (61% of Missouri employed parents), resulting in a total absenteeism-related cost of $610 million.
Child care issues also lead to employee turnover, which brings additional costs to businesses. Employers lose the productivity of an experienced employee and must invest in recruiting, hiring and training a replacement. The Chamber survey cited findings that the median cost of turnover is roughly 21% of a worker’s annual salary.6
In the 2021 Chamber survey, 14% of Missouri parents reported voluntarily or involuntarily leaving the workforce due to child care issues, influenced heavily by the COVID-19 pandemic. In 2024, the U.S. Census Household Pulse Survey found that 7.5% of Missouri parents (approximately 29,000) left, lost, or stopped looking for a job because of child care issues.7
Table 2. Missouri business costs due to child care access issues.
| Business category | Losses |
|---|---|
| Absenteeism | $609,790,820 |
| Turnover | $341,132,979 |
| Total | $950,923,799 |
To calculate turnover costs, 29,000 workers (7.5% parents leaving the workforce) were multiplied by turnover costs (21% of median annual wages), resulting in a total loss of $341 million. Costs for absenteeism and turnover can be seen in Table 2.
Tax loss calculations
When parents miss work or leave the workforce due to child care issues, the resulting loss in income also affects state and local tax revenues. State governments lose out on income and sales taxes, while lower property and city/county sales tax collections impact local governments. As in the 2021 Chamber survey, we used the Institute on Taxation and Economic Policy’s (ITEP) tax burden estimates to quantify these impacts, focusing on middle-income families.8 To further break down revenue between state and local sources, we incorporated data from the Tax Foundation.9
The ITEP estimates that middle-income families contribute an average of 8.6% of their income to state and local taxes. Separating this figure by the state (4.55%) and local (4.05%) average share, we multiplied parents’ lost income from absenteeism or workforce exits — $2.2 billion — to derive a total tax revenue loss of $194 million (Table 3).10
Table 3. Missouri tax costs due to child care access issues.
| Tax category | Losses |
|---|---|
| State tax revenue | $101,657,628 |
| Local tax revenue | $92,591,354 |
| Total | $194,248,982 |
County-level economic impacts
The estimated loss of $1.14 billion resulting from child care access issues includes $951 million in business expenses from absenteeism and turnover and $194 million in lost tax revenue at the state and local levels.
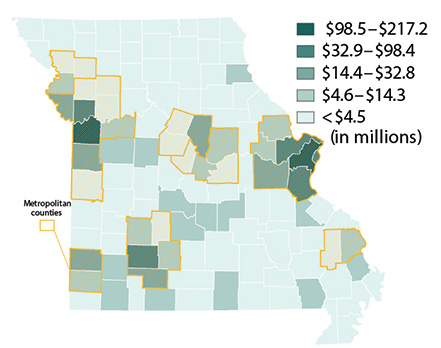
In addition to statewide estimates, our analysis incorporates county-level data on the parental workforce and median wages to estimate localized costs. This approach allows a more detailed look at the economic impact, showing total cost per county and affected worker.11
Figure 1 presents the total losses by county. The three most populous counties — St. Louis County, Jackson and St. Charles — account for 40% of the total cost, reflecting the concentration of Missouri’s population in metropolitan areas.
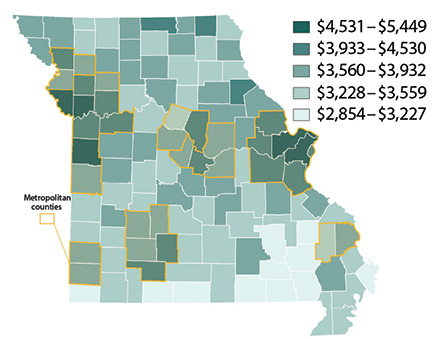
To better illustrate the cost at a job level, total losses are divided by the number of affected parental workers in each county. Statewide, the average loss per affected worker is $4,286, with $3,559 attributed to business costs and the remainder to lost government revenue. This cost varies by county, ranging from $5,449 in St. Charles County to $2,854 in Oregon County. Figure 2 illustrates how the economic impact of losing a worker to child care issues differs across the state.
Generally, metropolitan counties bear the highest costs, driven by higher wages, living expenses and population density. Although metropolitan counties account for 76% of Missouri’s population, they represent 81% of estimated losses due to child care shortages. Table 4 provides a full breakdown of county-level estimates.
Table 4. Business and tax losses due to child care access issues, by county.
| County | Total business and tax losses | Losses per impacted worker |
|---|---|---|
| Adair | $3,867,476 | $3,578 |
| Andrew | $3,110,529 | $4,236 |
| Atchison | $444,385 | $3,645 |
| Audrain | $3,681,392 | $3,600 |
| Barry | $4,999,031 | $3,447 |
| Barton | $1,473,955 | $3,352 |
| Bates | $2,502,927 | $3,589 |
| Benton | $1,550,655 | $3,379 |
| Bollinger | $1,377,242 | $3,345 |
| Boone | $32,880,494 | $4,292 |
| Buchanan | $12,886,114 | $3,721 |
| Butler | $5,545,103 | $3,166 |
| Caldwell | $1,311,904 | $3,777 |
| Callaway | $7,020,199 | $3,895 |
| Camden | $5,469,266 | $3,705 |
| Cape Girardeau | $12,832,038 | $3,787 |
| Carroll | $928,415 | $3,397 |
| Carter | $558,283 | $2,860 |
| Cass | $22,691,385 | $4,715 |
| Cedar | $2,487,096 | $3,716 |
| Chariton | $1,236,165 | $3,588 |
| Christian | $18,417,492 | $4,336 |
| Clark | $1,039,325 | $3,306 |
| Clay | $55,698,948 | $4,759 |
| Clinton | $3,550,815 | $4,117 |
| Cole | $13,127,705 | $4,038 |
| Cooper | $3,378,781 | $3,836 |
| Crawford | $2,974,948 | $3,531 |
| Dade | $975,147 | $3,406 |
| Dallas | $2,369,339 | $3,672 |
| Daviess | $1,693,892 | $3,931 |
| DeKalb | $1,532,609 | $3,932 |
| Dent | $1,973,537 | $3,393 |
| Douglas | $2,042,581 | $3,554 |
| Dunklin | $3,430,300 | $3,269 |
| Franklin | $19,424,547 | $4,241 |
| Gasconade | $1,864,904 | $3,536 |
| Gentry | $1,126,162 | $3,383 |
| Greene | $46,182,354 | $3,738 |
| Grundy | $1,964,614 | $3,839 |
| Harrison | $1,525,131 | $3,479 |
| Henry | $3,464,357 | $3,654 |
| Hickory | $690,873 | $3,296 |
| Holt | $512,583 | $3,615 |
| Howard | $1,617,400 | $3,545 |
| Howell | $5,468,386 | $3,266 |
| Iron | $1,187,151 | $3,412 |
| Jackson | $145,181,595 | $4,347 |
| Jasper | $21,656,306 | $3,591 |
| Jefferson | $44,891,376 | $4,507 |
| Johnson | $8,873,407 | $3,681 |
| Knox | $831,653 | $3,519 |
| Laclede | $6,067,715 | $3,358 |
| Lafayette | $5,437,513 | $4,023 |
| Lawrence | $6,285,361 | $3,518 |
| Lewis | $1,403,000 | $3,632 |
| Lincoln | $14,325,607 | $4,477 |
| Linn | $1,621,591 | $3,881 |
| Livingston | $2,197,128 | $3,721 |
| McDonald | $3,025,093 | $3,117 |
| Macon | $2,366,075 | $3,535 |
| Madison | $1,722,235 | $3,215 |
| Maries | $1,143,155 | $3,604 |
| Marion | $5,152,648 | $3,435 |
| Mercer | $617,332 | $3,649 |
| Miller | $4,187,611 | $3,710 |
| Mississippi | $998,872 | $3,076 |
| Moniteau | $2,681,161 | $3,849 |
| Monroe | $1,429,727 | $3,747 |
| Montgomery | $1,939,504 | $3,842 |
| Morgan | $3,554,035 | $3,559 |
| New Madrid | $2,295,287 | $3,260 |
| Newton | $10,483,917 | $3,843 |
| Nodaway | $2,720,801 | $3,849 |
| Oregon | $1,026,377 | $2,854 |
| Osage | $1,992,376 | $3,904 |
| Ozark | $636,057 | $2,995 |
| Pemiscot | $2,121,697 | $3,306 |
| Perry | $2,927,659 | $3,541 |
| Pettis | $8,652,959 | $3,682 |
| Phelps | $6,476,677 | $3,727 |
| Pike | $2,742,608 | $3,731 |
| Platte | $25,805,709 | $5,293 |
| Polk | $5,404,827 | $3,773 |
| Pulaski | $8,497,480 | $3,367 |
| Putnam | $910,801 | $4,104 |
| Ralls | $1,698,523 | $4,099 |
| Randolph | $3,434,712 | $3,404 |
| Ray | $4,565,015 | $4,530 |
| Reynolds | $446,810 | $2,925 |
| Ripley | $1,365,303 | $3,144 |
| St Charles | $98,469,841 | $5,449 |
| St Clair | $1,239,944 | $3,365 |
| Ste Genevieve | $3,222,206 | $3,821 |
| St Francois | $8,616,266 | $3,504 |
| St Louis | $217,226,439 | $5,061 |
| Saline | $3,316,605 | $3,291 |
| Schuyler | $992,839 | $3,855 |
| Scotland | $1,286,179 | $4,029 |
| Scott | $6,149,297 | $3,332 |
| Shannon | $1,086,641 | $3,741 |
| Shelby | $843,503 | $3,310 |
| Stoddard | $4,272,111 | $3,586 |
| Stone | $3,083,411 | $3,471 |
| Sullivan | $832,988 | $3,535 |
| Taney | $7,078,304 | $3,170 |
| Texas | $3,181,234 | $3,245 |
| Vernon | $3,031,739 | $3,407 |
| Warren | $6,332,815 | $4,324 |
| Washington | $3,282,089 | $3,855 |
| Wayne | $877,653 | $3,227 |
| Webster | $7,573,712 | $4,084 |
| Worth | $258,089 | $3,334 |
| Wright | $2,739,469 | $3,324 |
| St Louis City | $52,296,176 | $4,272 |
| Missouri | $1,145,172,781 | $4,286 |
Summary
Access to affordable, quality child care is a growing challenge across Missouri and the nation, with far-reaching effects on families, communities and the economy. In Missouri, many parents struggle to find reliable child care, forcing some to reduce work hours or leave the workforce entirely. With annual child care costs nearing 14% of the median household income, affordability is a significant barrier. The shortage of child care options also compounds existing labor shortages, especially in a state where unemployment has remained low and businesses are actively seeking workers.
The economic impacts of child care access issues are significant. Missouri businesses lose $951 million annually due to employee absenteeism and turnover related to child care needs. When parents miss work or leave jobs, businesses face productivity losses and increased recruitment/training costs. These disruptions also reduce household income, which leads to an estimated $194 million in lost state and local tax revenue annually. Combined, the total cost to Missouri’s economy exceeds $1.14 billion.
This guide highlights why child care matters — not just for families but also for businesses and communities. Showing the real costs of not addressing child care challenges makes it clear that investing in accessible, quality care is a smart move. It boosts the state’s economy by helping parents stay in the workforce, expanding the labor force for businesses, and making the state more attractive to younger working parents.
References
- Office of Planning, Research and Evaluation. (2023). Children’s Learning and Development Benefits from High-Quality Early Care and Education: A Summary of the Evidence. Administration for Children and Families, U.S. Department of Health and Human Services.
- Missouri Chamber of Commerce and Industry. (2023). New Poll: Workforce, Child Care and Public Safety Remain Top Concerns of Missouri Business Leaders.
- Missouri Economic Research and Information Center. (2023). Missouri Workforce 2023 Employer Survey Report. Page 5.
- U.S. Chamber of Commerce Foundation. (2021). Untapped Potential: How Childcare Impacts Missouri’s Workforce Productivity and the State Economy (PDF).
- U.S. Census Bureau (2023). Table B20017. Median Earnings in the Past 12 Months (in 2023 Inflation-Adjusted Dollars). American Community Survey, 2023 5-Year County Estimates. Median hourly earnings are calculated by county and gender based on full-time, year-round employment.
- Boushey, H., & Glynn, S. J. (2012). There Are Significant Business Costs to Replacing Employees. Center for American Progress (PDF).
- U.S. Census Bureau. (2024). Employment Table 5. Childcare Arrangements for Children in the Household, by Select Characteristics. Household Pulse Survey, January-September.
- Institute on Taxation and Economic Policy. (2024). Missouri: Who Pays? 7th Edition.
- Tax Foundation. (2024). 2024 State Tax Data: Facts & Figures.
- The St. Louis and Kansas City earnings tax of 1% was added to the calculations to account for tax revenues in those cities. Since Kansas City overlays parts of multiple counties, only a quarter of the income in Jackson, Clay and Platte counties was assumed to pay local income taxes for a conservative estimate.
- Reporting figures at the county level requires simplifying assumptions, as workers commute across counties and there is likely some overlap of impacted parents who miss work and eventually leave employment altogether. Therefore, the cost-per-worker estimates should be viewed as a general way to understand relative costs to county businesses and government.
Funding for this publication was made possible by the Missouri Department of Higher Education and Workforce Development’s MoExcels Workforce Initiative Grant, in partnership with the MU Center for Family Policy and Research.