Top 20 U.S. states in wheat production | Top 15 U.S. states in winter wheat production | Historical overview of Missouri wheat farming | Historical overview of Missouri oat, rye and barley production
Top 20 U.S. states in wheat production
| State | Rank | Production — # of bushels | # of acres | Yield — bushels/acre |
|---|---|---|---|---|
| North Dakota | 1 | 363,482,000 | 7,635,000 | 48 |
| Kansas | 2 | 277,400,000 | 7,300,000 | 38 |
| Montana | 3 | 197,630,000 | 5,165,000 | 38 |
| Washington | 4 | 153,210,000 | 2,165,000 | 71 |
| Idaho | 5 | 104,410,000 | 1,136,000 | 92 |
| Minnesota | 6 | 92,930,000 | 1,575,000 | 59 |
| South Dakota | 7 | 72,294,000 | 1,628,000 | 44 |
| Colorado | 8 | 70,504,000 | 1,954,000 | 36 |
| Oklahoma | 9 | 70,000,000 | 2,500,000 | 28 |
| Texas | 10 | 56,000,000 | 1,750,000 | 32 |
| Oregon | 11 | 51,590,000 | 770,000 | 67 |
| Nebraska | 12 | 49,490,000 | 1,011,000 | 49 |
| Illinois | 13 | 36,960,000 | 560,000 | 66 |
| Michigan | 14 | 35,720,000 | 470,000 | 76 |
| Ohio | 15 | 33,750,000 | 450,000 | 75 |
| Missouri | 16 | 30,680,000 | 520,000 | 59 |
| North Carolina | 17 | 21,090,000 | 370,000 | 57 |
| Kentucky | 18 | 19,800,000 | 300,000 | 66 |
| Tennessee | 19 | 18,525,000 | 285,000 | 65 |
| Indiana | 20 | 18,460,000 | 260,000 | 71 |
Source: U.S. Department of Agriculture/National Agricultural Statistics Service
Top 15 U.S. states in winter wheat production
| State | Rank | Production — # of bushels | # of acres | Yield — bushels/acre |
|---|---|---|---|---|
| Kansas | 1 | 277,400,000 | 7,300,000 | 38 |
| Washington | 2 | 125,400,000 | 1,650,000 | 76 |
| Montana | 3 | 78,500,000 | 1,570,000 | 50 |
| Colorado | 4 | 70,200,000 | 1,950,000 | 36 |
| Oklahoma | 5 | 70,000,000 | 2,500,000 | 28 |
| Idaho | 6 | 61,200,000 | 680,000 | 90 |
| Texas | 7 | 56,000,000 | 1,750,000 | 32 |
| Nebraska | 8 | 49,490,000 | 1,010,000 | 49 |
| Oregon | 9 | 46,565,000 | 695,000 | 67 |
| Illinois | 10 | 36,960,000 | 560,000 | 66 |
| Michigan | 11 | 35,720,000 | 470,000 | 76 |
| Ohio | 12 | 33,750,000 | 450,000 | 75 |
| South Dakota | 13 | 31,680,000 | 660,000 | 48 |
| Missouri | 14 | 30,680,000 | 520,000 | 59 |
| North Carolina | 15 | 21,090,000 | 370,000 | 57 |
Source: U.S. Department of Agriculture/National Agricultural Statistics Service
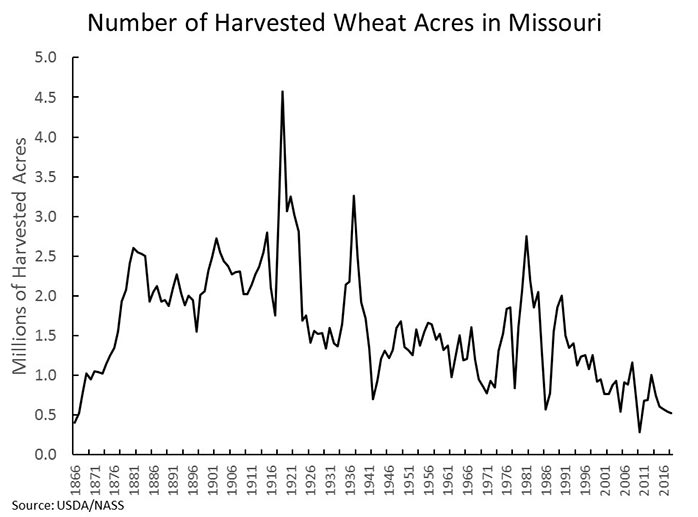
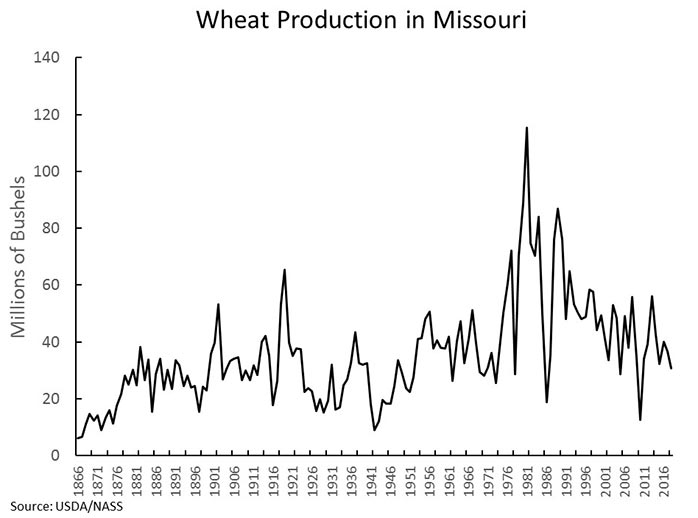
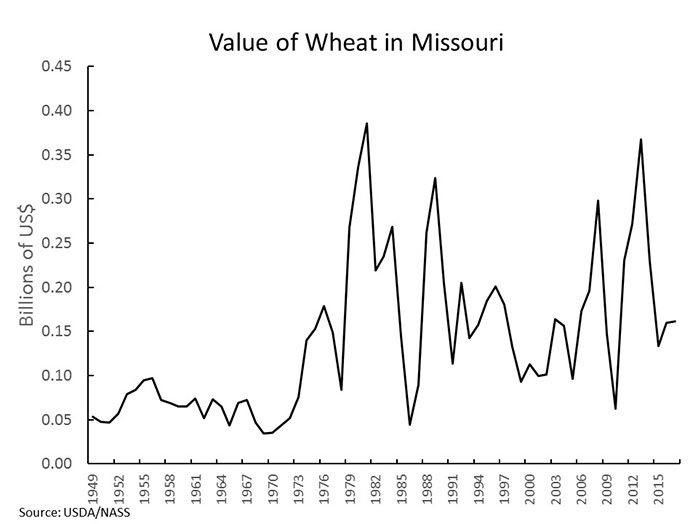
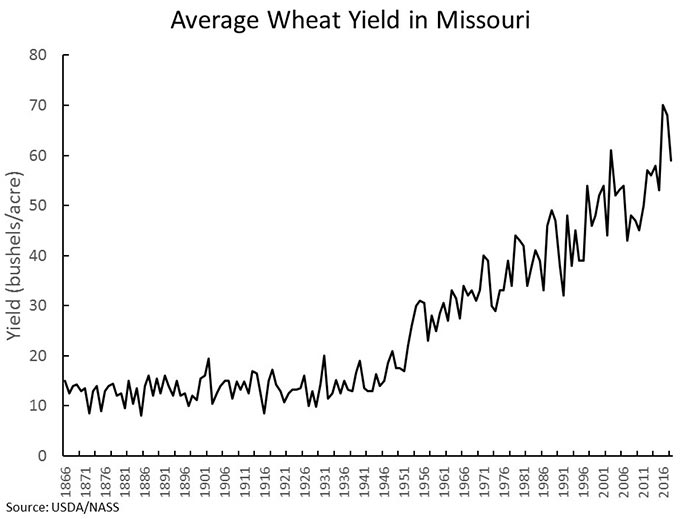
Historical overview of Missouri wheat farming
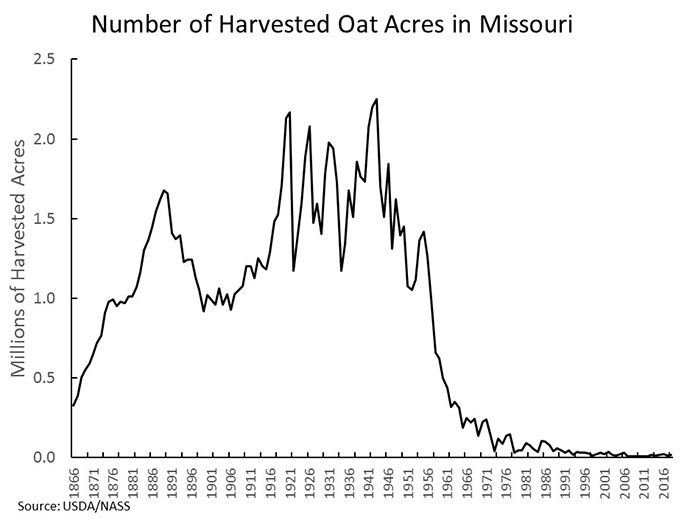
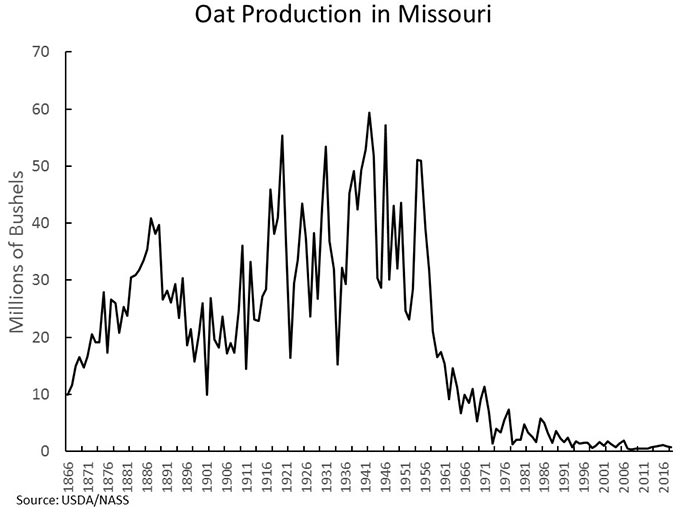
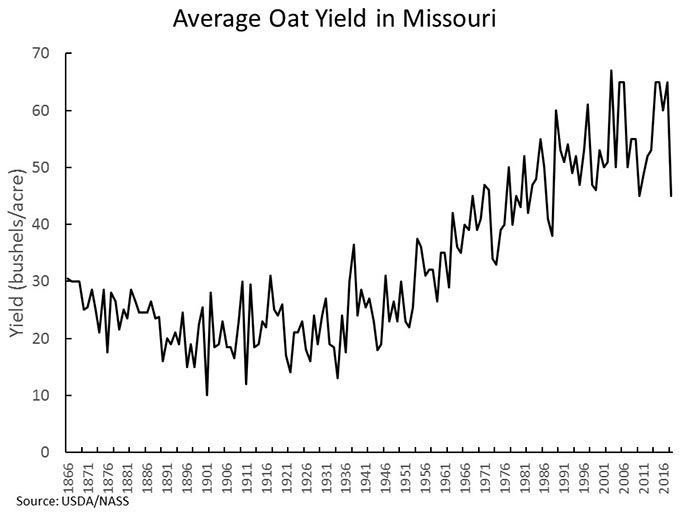
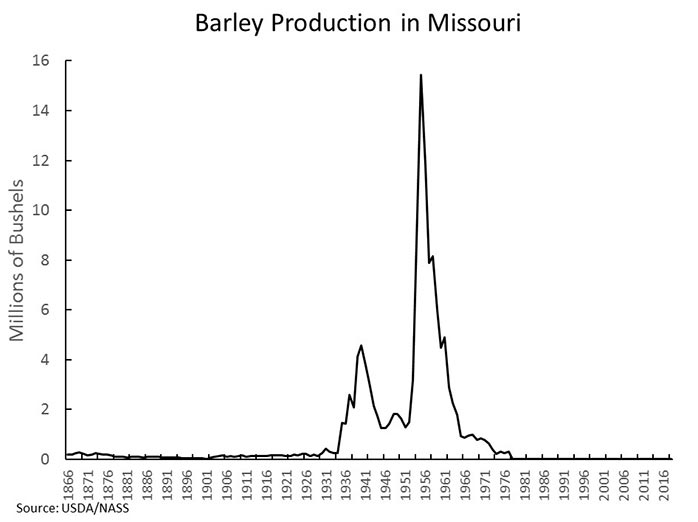
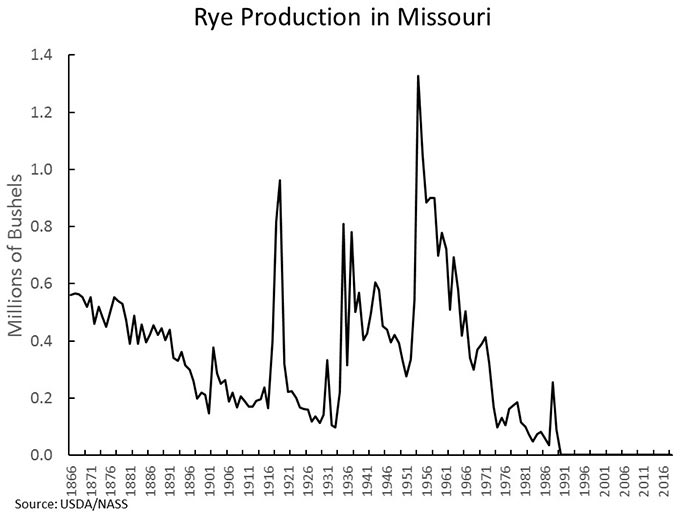
Historical overview of Missouri oat, rye and barley production