This page tracks spring rainfall and identifies danger areas that may be on track to have problems with nitrogen loss and deficiency in corn. This is a serious production and environmental problem that is estimated to have cost Midwestern corn producers 2 billion bushels total from 2008 to 2011.
Current tracking will be posted if available. Please view the archive below for historical nitrogen watch information.
Thanks to the Midwest Regional Climate Center for the rainfall maps on which Nitrogen Watch is based.
Nitrogen Watch archive
Well- and moderately well-drained soils
Poorly- and somewhat poorly-drained soils
Well- and moderately well-drained soils
Poorly- and somewhat poorly-drained soils
Well- and moderately well-drained soils
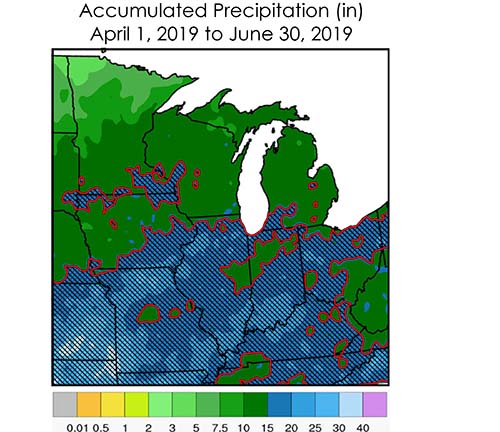
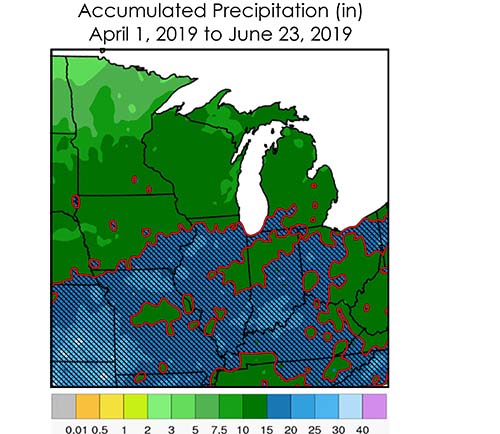
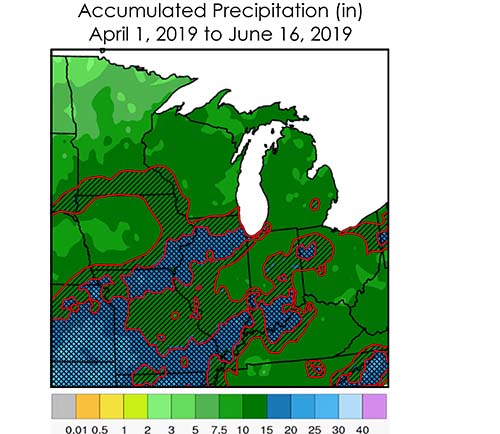
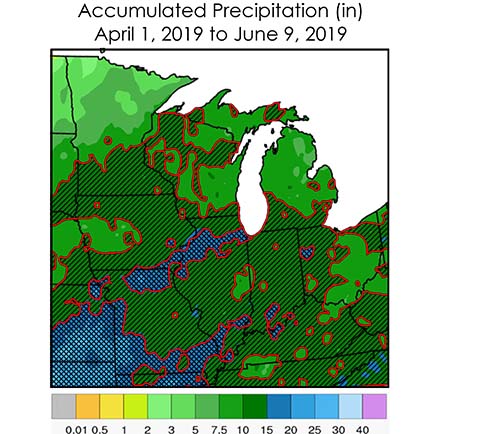
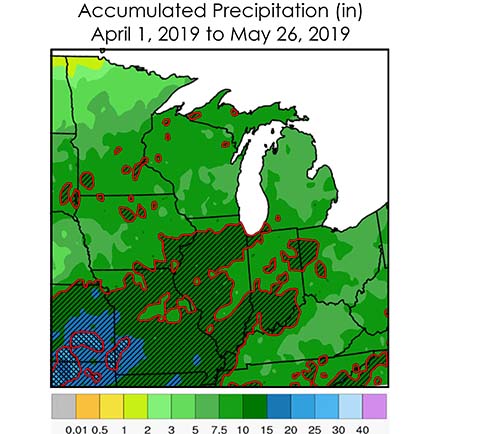
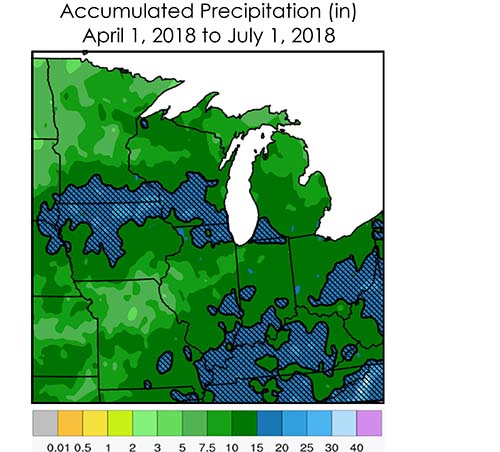
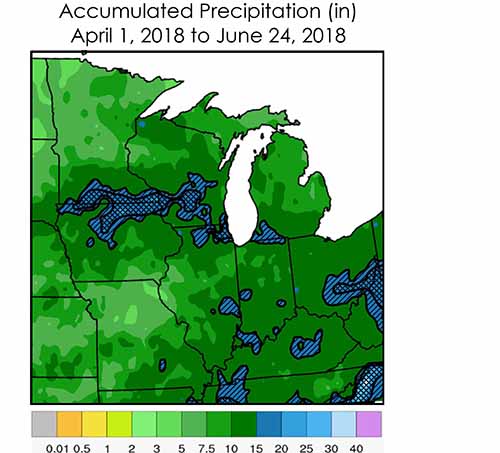
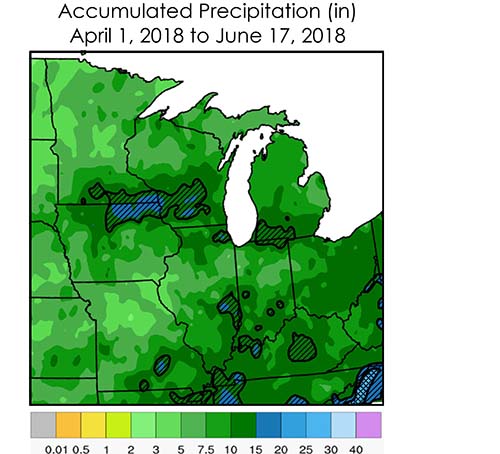
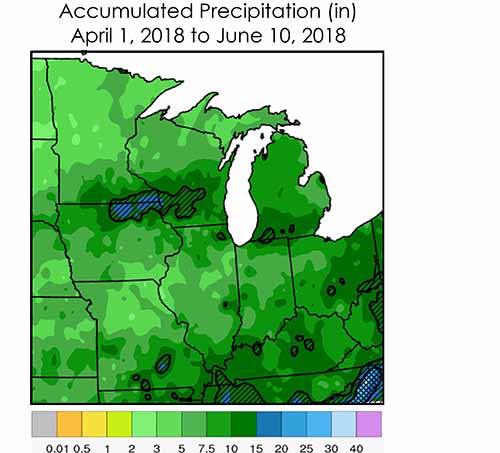
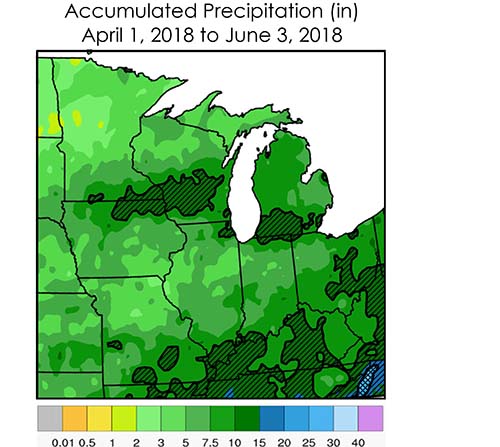
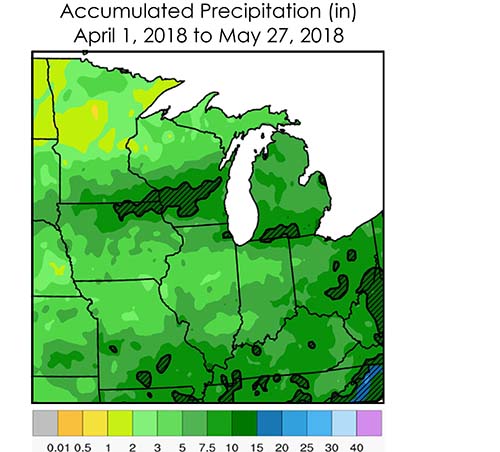
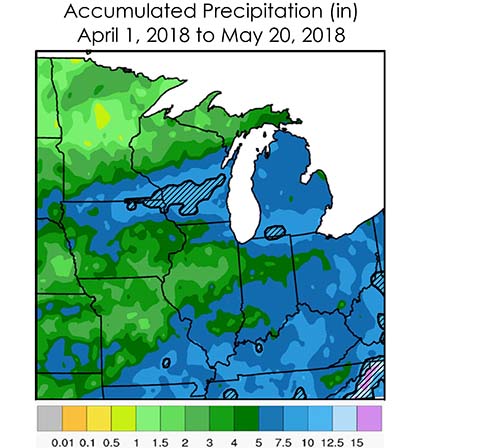
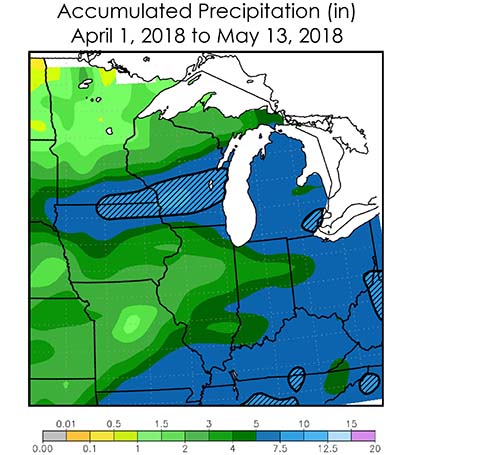
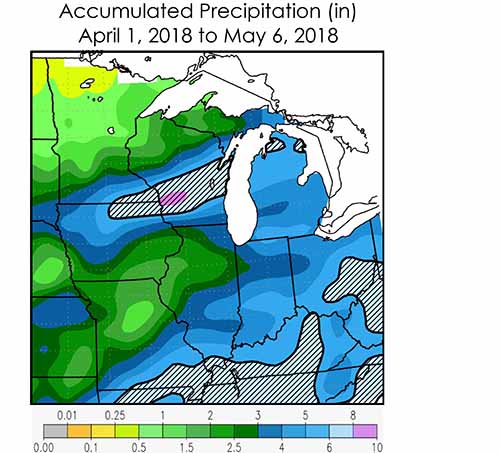
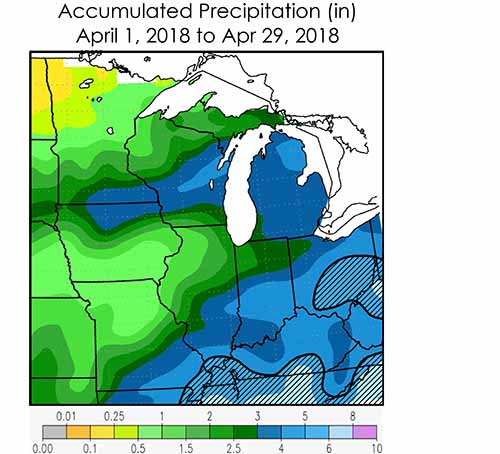
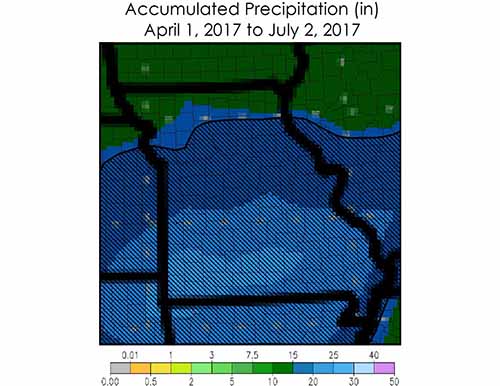
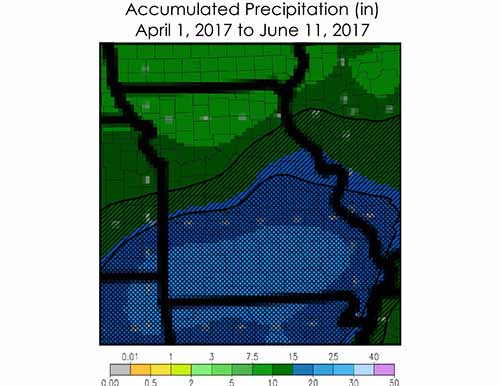
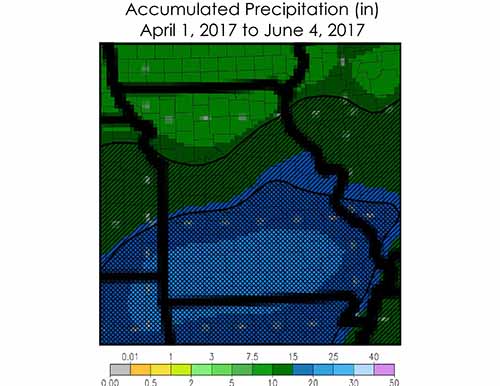
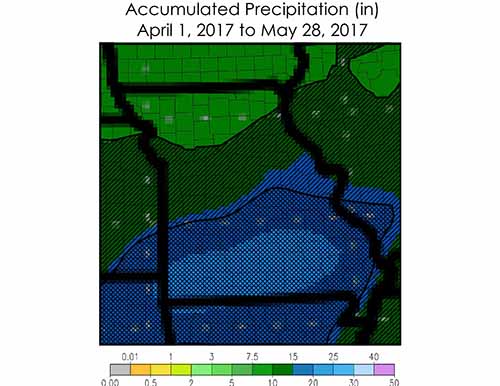
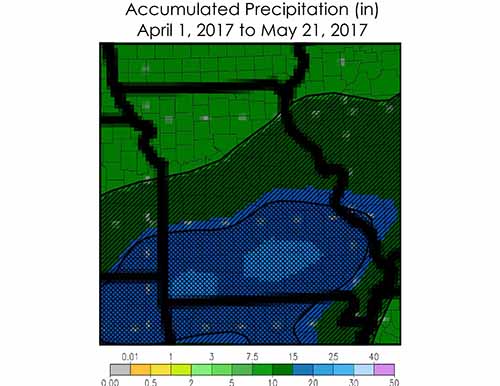
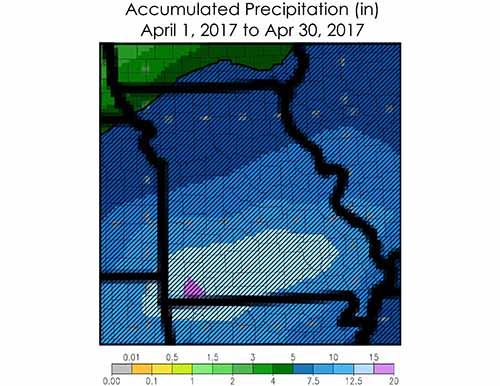
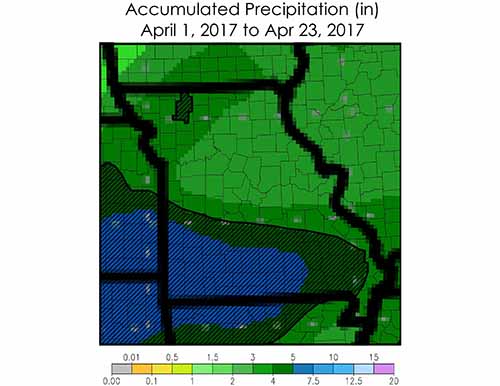
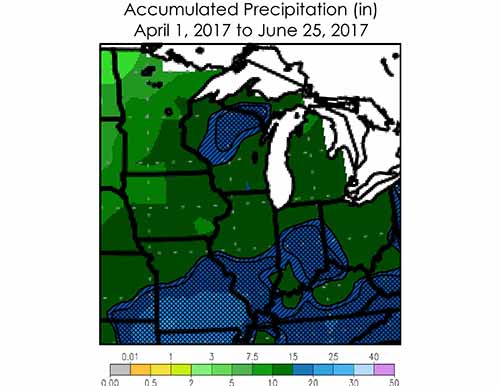
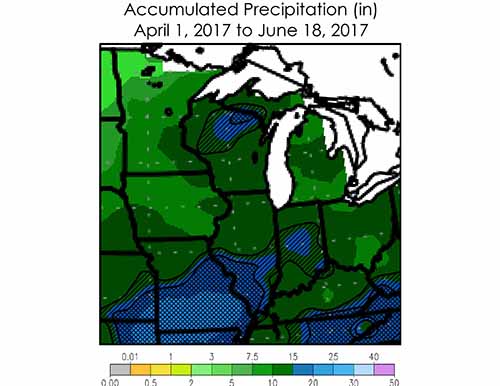
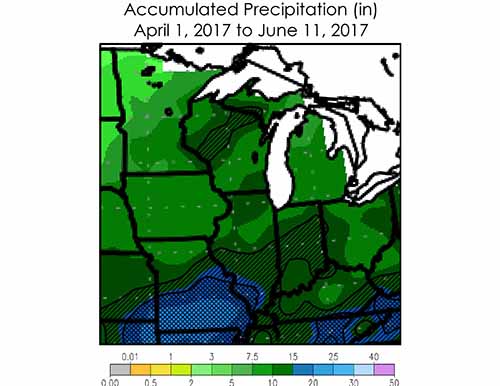
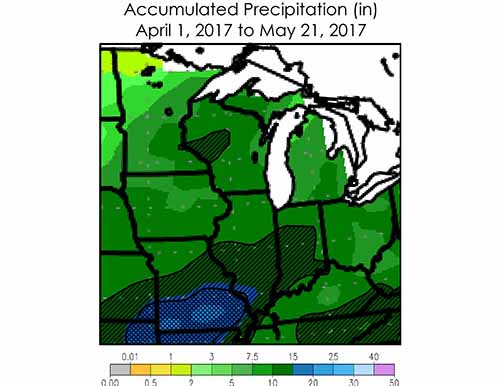
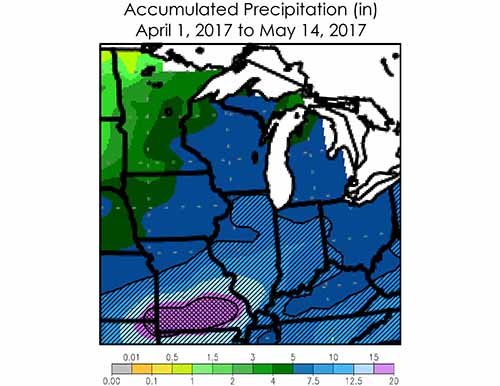
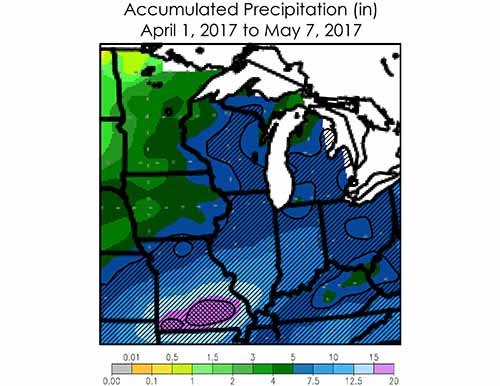
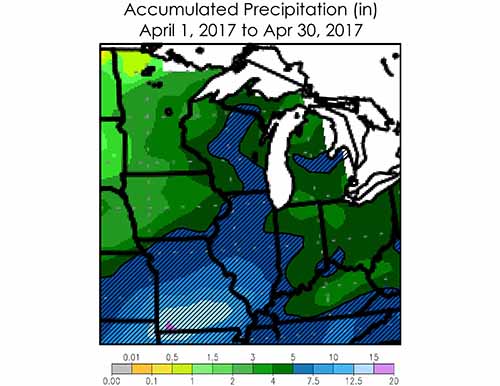
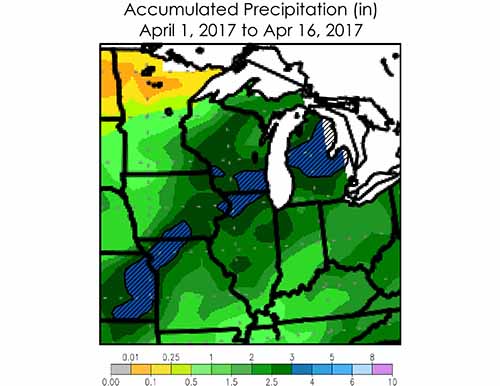
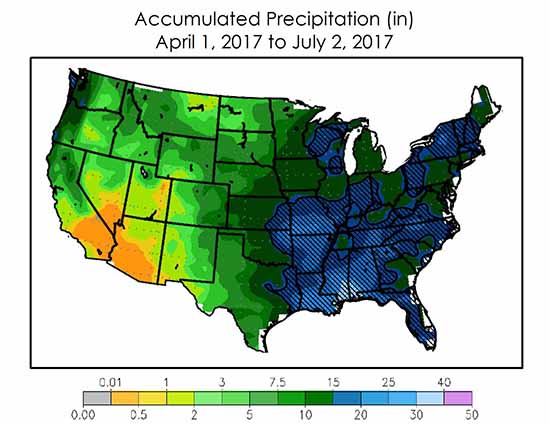
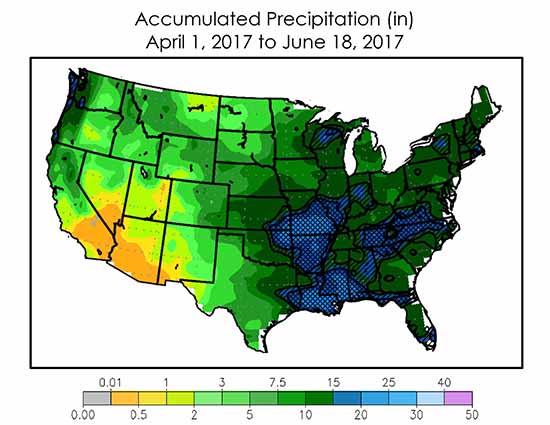
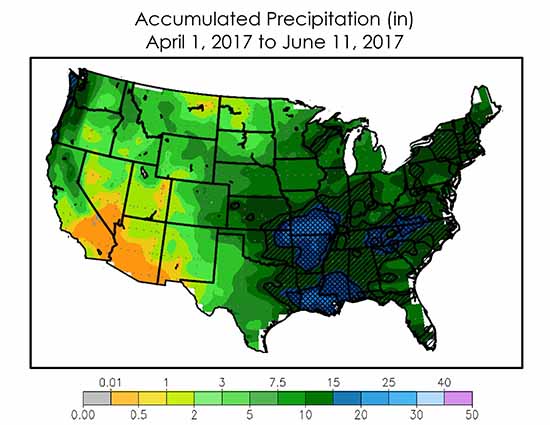
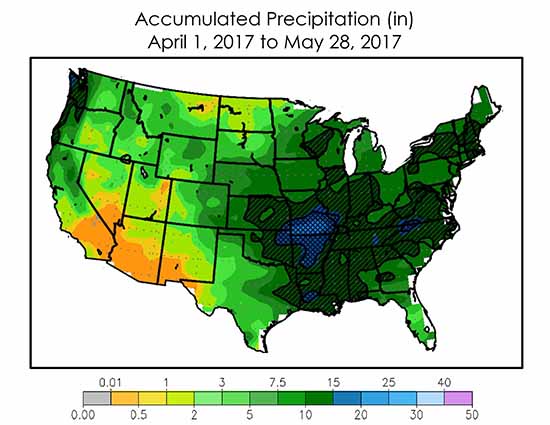
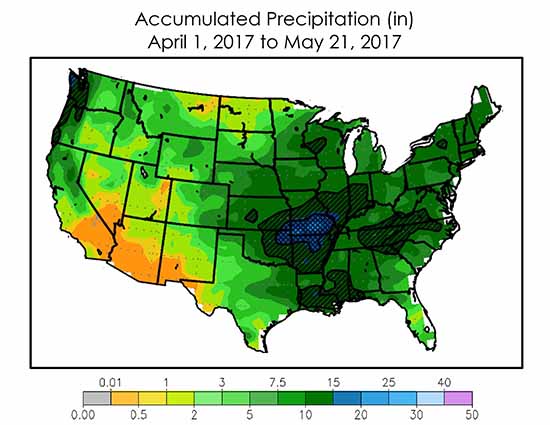
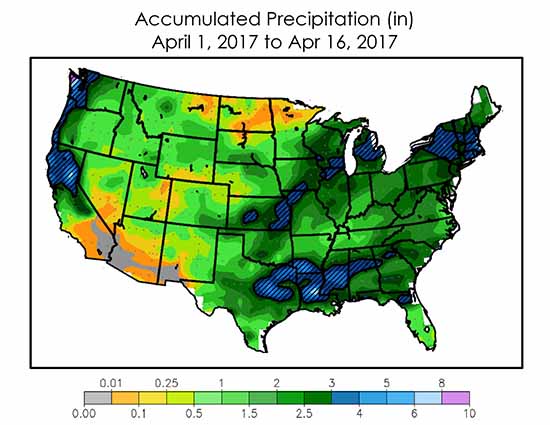
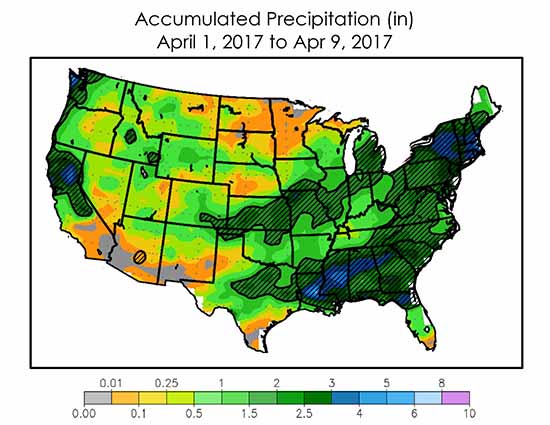
Well-drained soils are vulnerable mainly to nitrogen loss from leaching. This process can start shortly after fertilizer application (with some delay for ammonia). We have used April 1 to represent a preplant N application date. For ammonia or for applications later than April 1, risk is lower; for applications before April 1, risk is higher.
Areas with diagonal shading are ‘danger areas’ that are on track to have 16 or more inches of rainfall from April 1 to June 30. This does not mean that significant loss of N has already happened, just that producers in these areas should be watchful and aware of the potential for N loss and deficiency.
Areas shown in cross-hatch are ‘problem areas’ that have already received 16 or more inches of rainfall since April 1. I expect a majority of fields to have substantial yield loss due to N deficiency when all N was applied pre-plant. I suggest that producers look at their fields and when N stress is seen apply additional N. Rescue N applications are likely to be profitable until tasseling or later in fields with deficiency symptoms. Satellite images or canopy sensors potentially provide a way to improve distribution of this N application, putting more N where stress is greatest and little or none where corn looks good.
Poorly- and somewhat poorly-drained soils
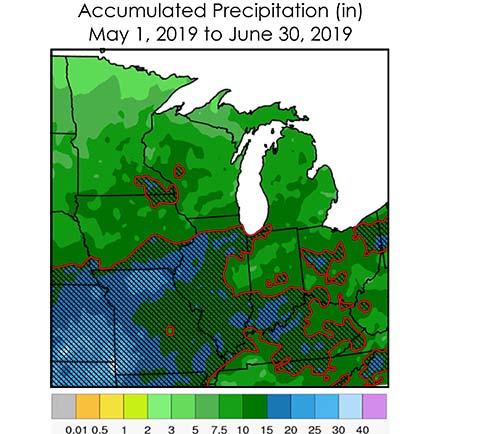
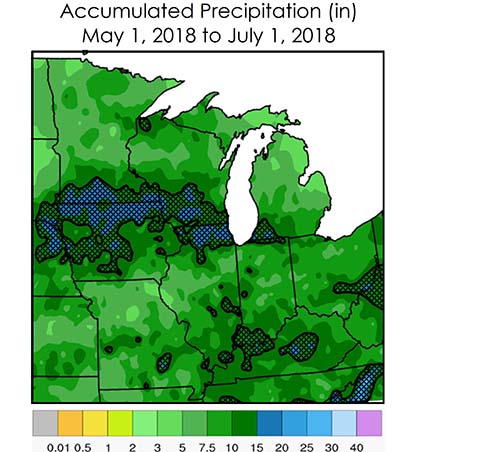
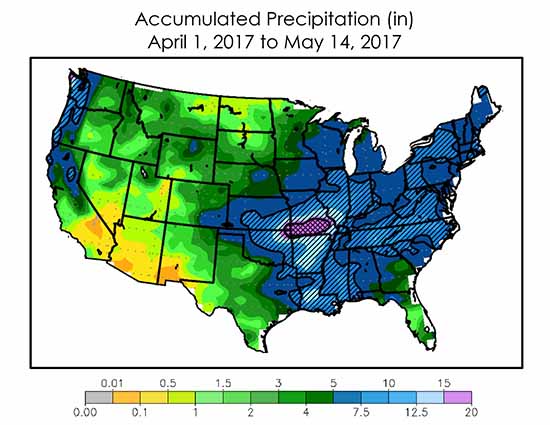
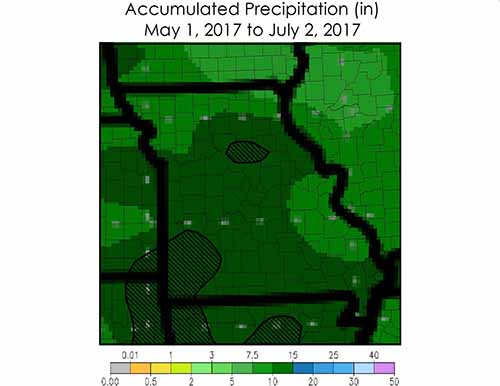
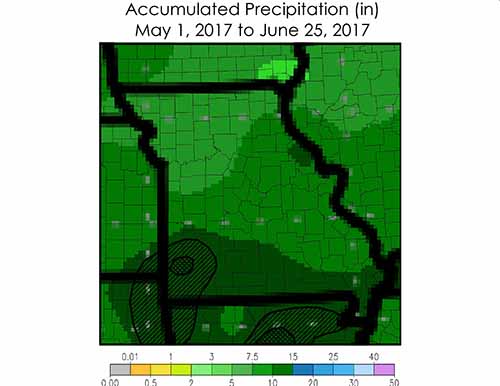
Poorly-drained soils lose N mainly by denitrification, which is very temperature-sensitive. My rule of thumb is that wet conditions in May and June cause denitrification losses, but losses in April are minimal.
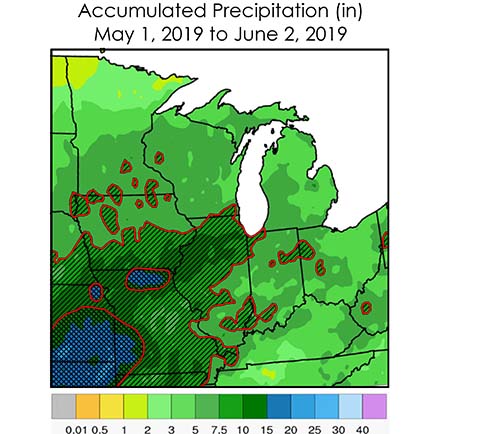
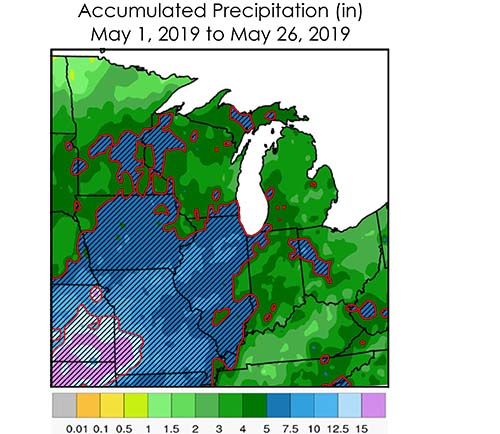
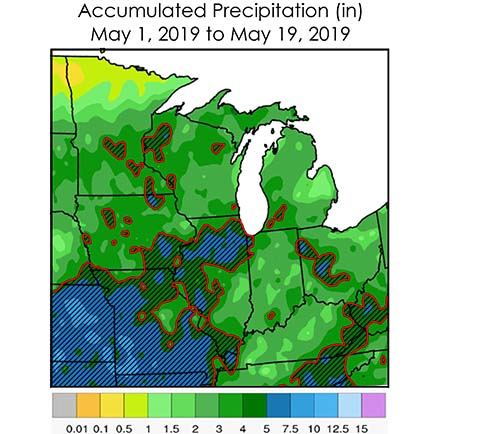
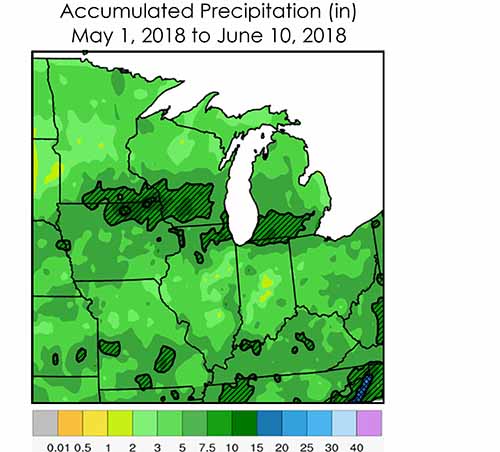
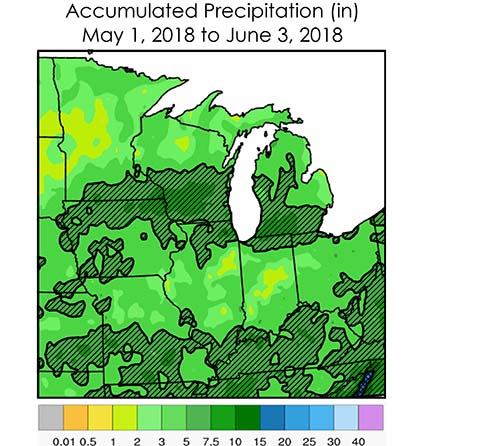
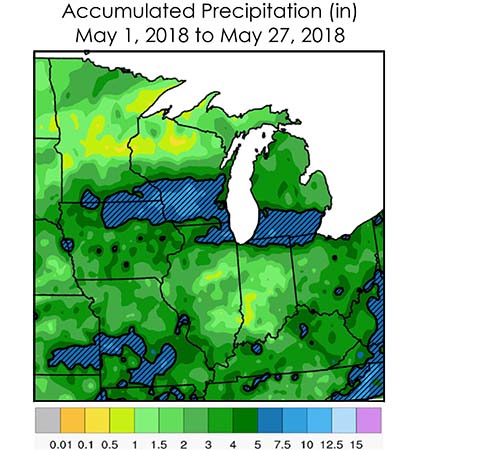
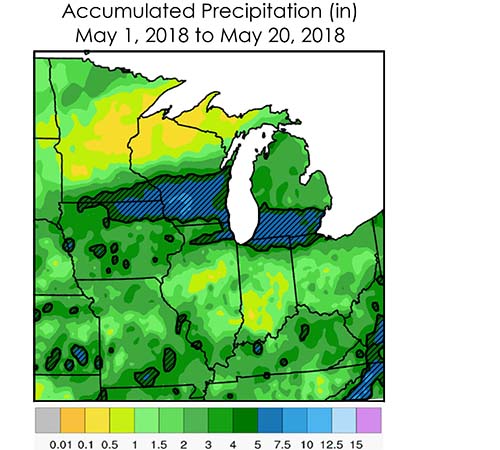
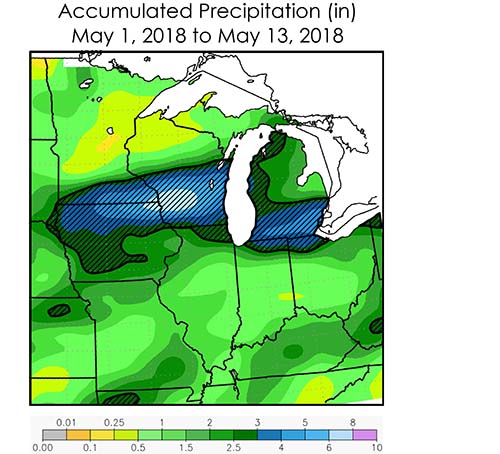
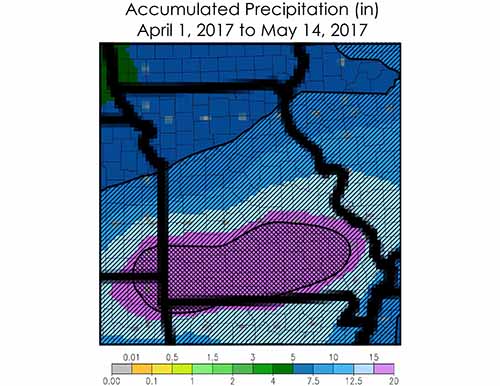
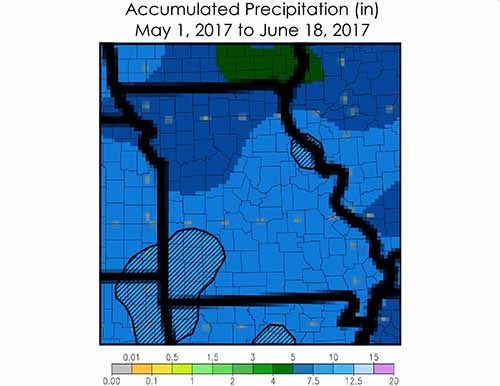
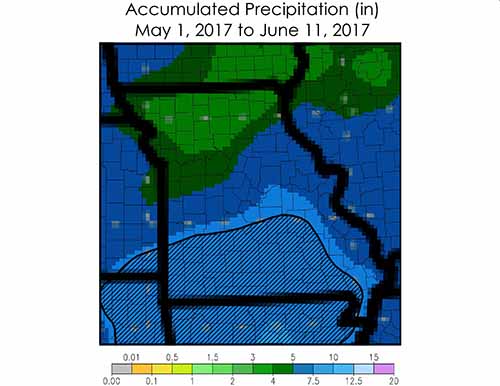
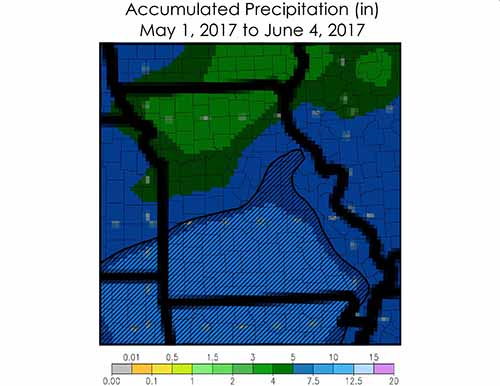
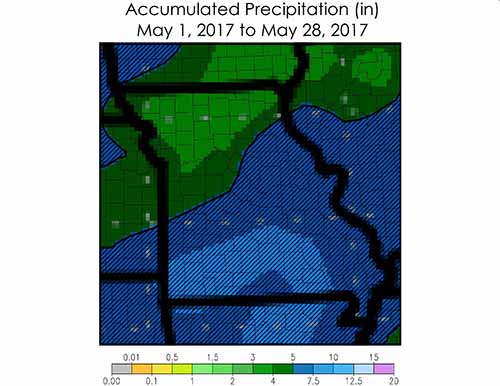
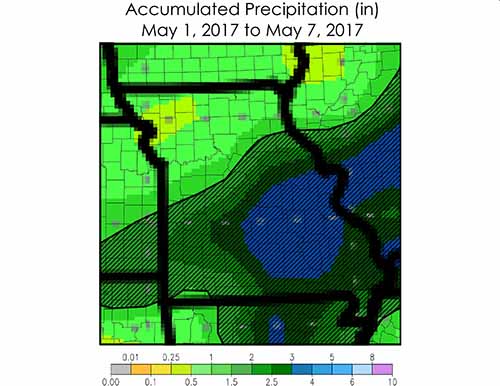
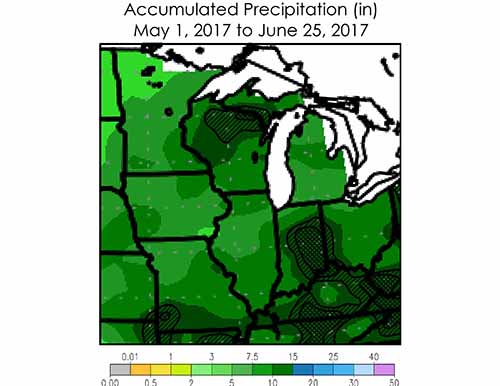
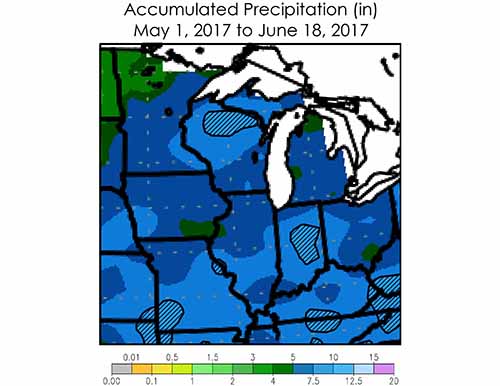
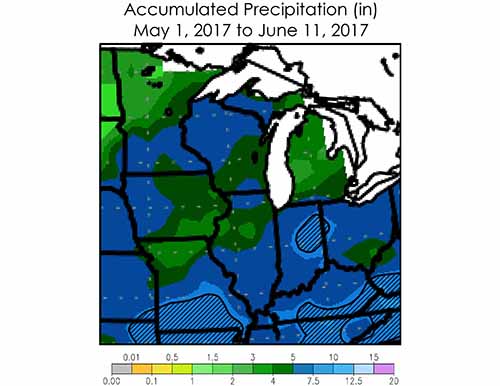
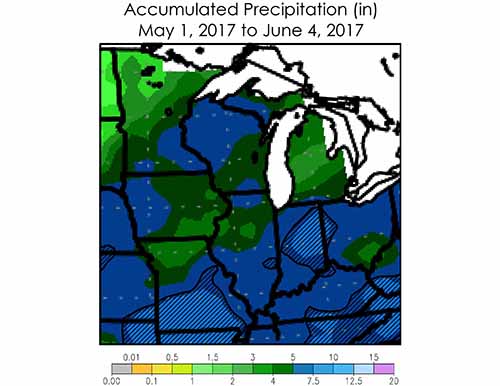
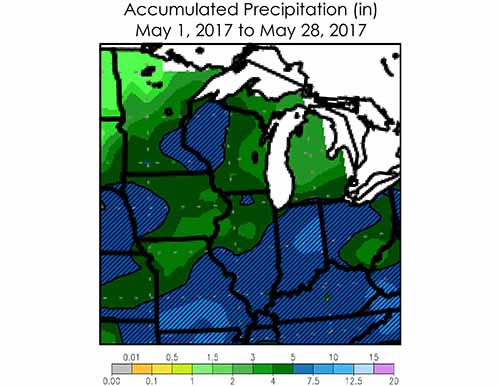
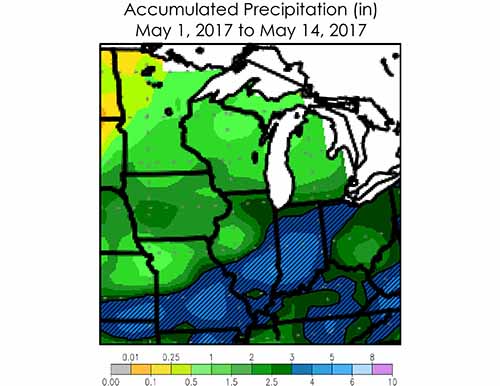
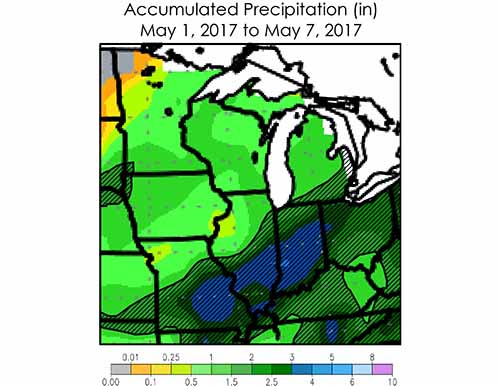
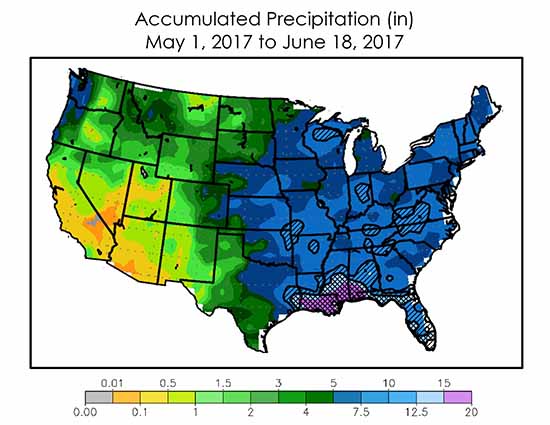
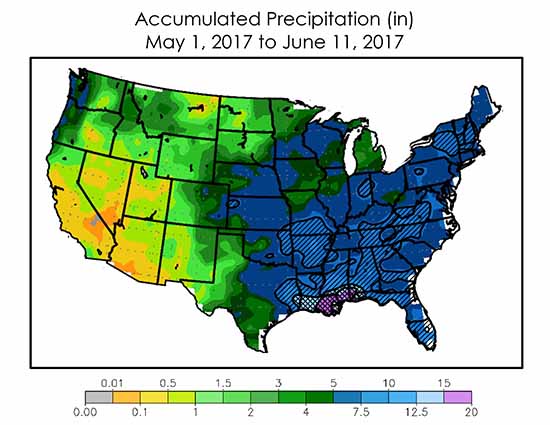
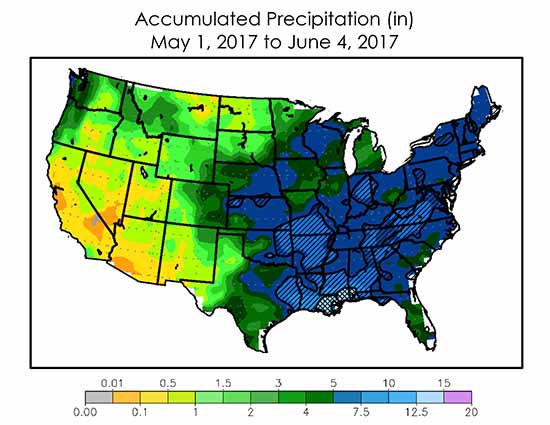
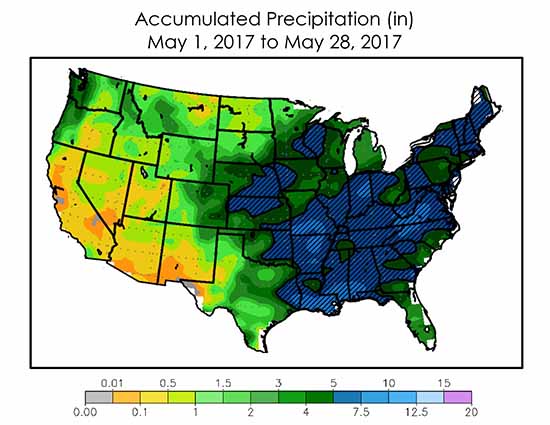
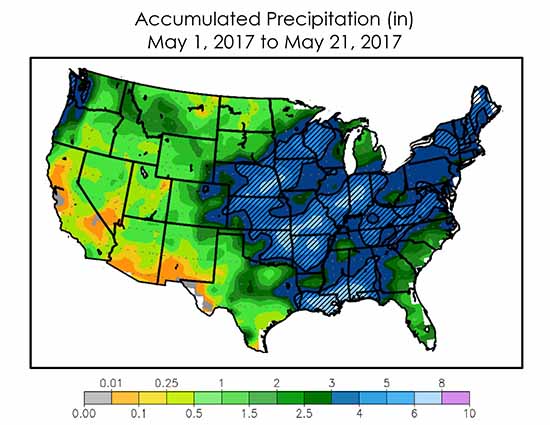
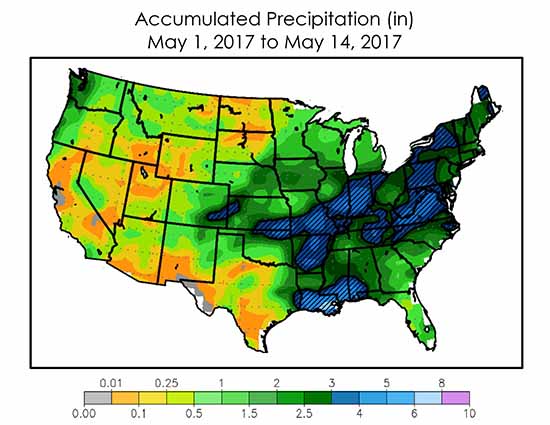
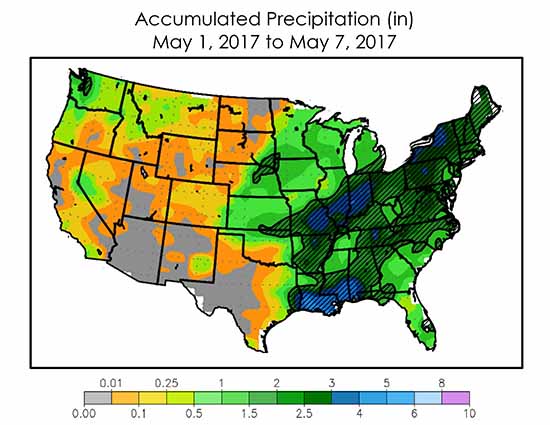
Areas with diagonal shading are ‘danger areas’ that are on track to have 12 or more inches of rainfall from May 1 to June 30. This does not mean that significant loss of N has already happened, just that producers in these areas should be watchful and aware of the potential for N loss and deficiency.
Areas shown in cross-hatch are ‘problem areas’ that have already received 12 or more inches of rainfall since May 1. I expect a majority of fields to have substantial yield loss due to N deficiency when all N was applied pre-plant. I suggest that producers look at their fields and when N stress is seen apply additional N. Rescue N applications are likely to be profitable until tasseling or later in fields with deficiency symptoms. Satellite images or canopy sensors potentially provide a way to improve distribution of this N application, putting more N where stress is greatest and little or none where corn looks good.
Well-and moderately well-drained soils
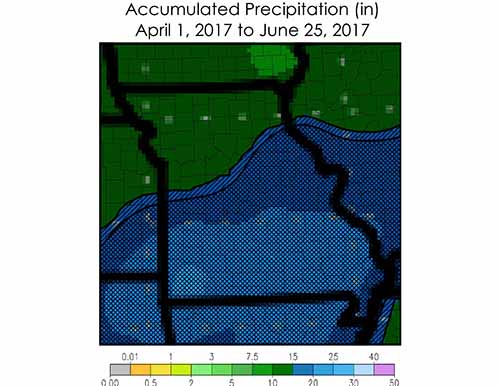
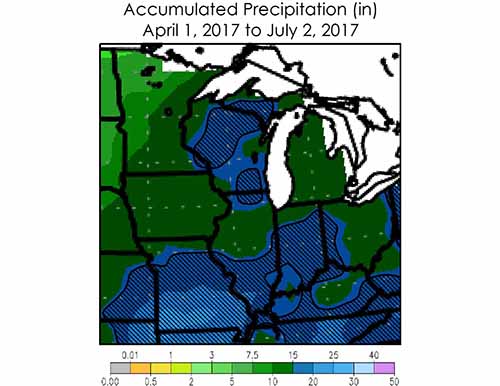
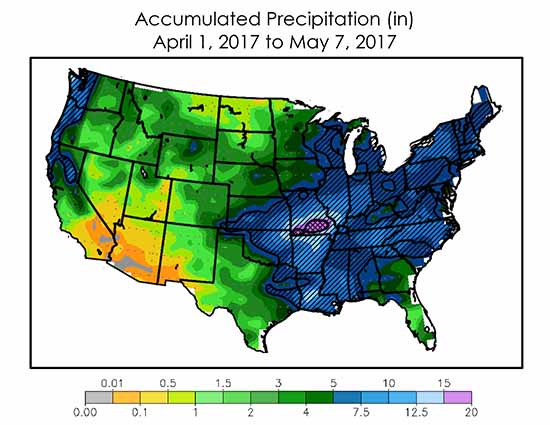
Well-drained soils are vulnerable mainly to nitrogen loss from leaching. This process can start shortly after fertilizer application (with some delay for ammonia). We have used April 1 to represent a preplant N application date. For ammonia or for applications later than April 1, risk is lower; for applications before April 1, risk is higher.
Areas with diagonal shading are ‘danger areas’ that are on track to have 16 or more inches of rainfall from April 1 to June 30. This does not mean that significant loss of N has already happened, just that producers in these areas should be watchful and aware of the potential for N loss and deficiency.
Areas shown in cross-hatch are ‘problem areas’ that have already received 16 or more inches of rainfall since April 1. I expect a majority of fields to have substantial yield loss due to N deficiency when all N was applied pre-plant. I suggest that producers look at their fields and when N stress is seen apply additional N. Rescue N applications are likely to be profitable until tasseling or later in fields with deficiency symptoms. Canopy sensors potentially provide a way to improve distribution of this N application, putting more N where stress is greatest and little or none where corn looks good.
Midwest
Poorly- and somewhat poorly-drained soils
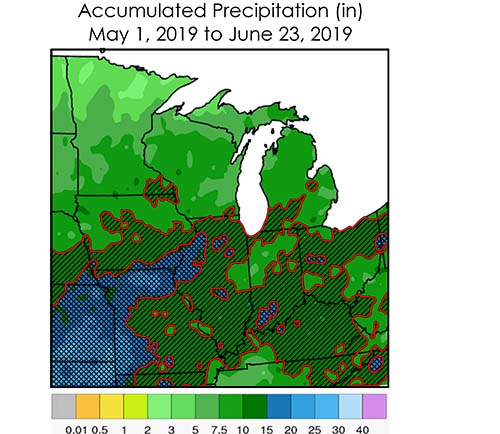
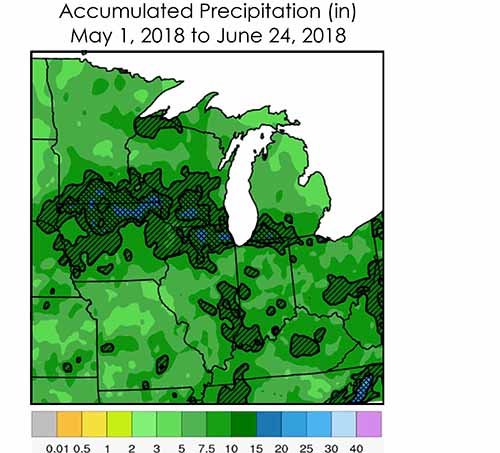
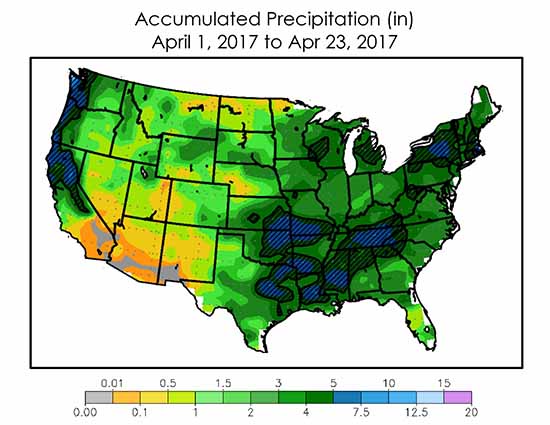
Poorly-drained soils lose N mainly by denitrification, which is very temperature-sensitive. My rule of thumb is that wet conditions in May and June cause denitrification losses, but losses in April are minimal.
Areas with diagonal shading are ‘danger areas’ that are on track to have 12 or more inches of rainfall from May 1 to June 30. This does not mean that significant loss of N has already happened, just that producers in these areas should be watchful and aware of the potential for N loss and deficiency.
Areas shown in cross-hatch are ‘problem areas’ that have already received 12 or more inches of rainfall since May 1. I expect a majority of fields to have substantial yield loss due to N deficiency when all N was applied pre-plant. I suggest that producers look at their fields and when N stress is seen apply additional N. Rescue N applications are likely to be profitable until tasseling or later in fields with deficiency symptoms. Canopy sensors potentially provide a way to improve distribution of this N application, putting more N where stress is greatest and little or none where corn looks good.
Midwest
Well-and moderately well-drained soils
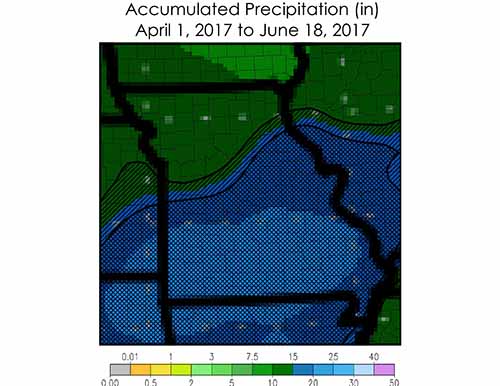
Well-drained soils are vulnerable mainly to nitrogen loss from leaching. This process can start shortly after fertilizer application (with some delay for ammonia). We have used April 1 to represent a preplant N application date. For ammonia or for applications later than April 1, risk is lower; for applications before April 1, risk is higher.
Areas with diagonal shading are ‘danger areas’ that are on track to have 16 or more inches of rainfall from April 1 to June 30. This does not mean that significant loss of N has already happened, just that producers in these areas should be watchful and aware of the potential for N loss and deficiency.
Areas shown in cross-hatch are ‘problem areas’ that have already received 16 or more inches of rainfall since April 1. I expect a majority of fields to have substantial yield loss due to N deficiency when all N was applied pre-plant. I suggest that producers look at their fields and when N stress is seen apply additional N. Rescue N applications are likely to be profitable until tasseling or later in fields with deficiency symptoms. Canopy sensors potentially provide a way to improve distribution of this N application, putting more N where stress is greatest and little or none where corn looks good.
Missouri
Midwest
Contiguous USA
Poorly- and somewhat poorly-drained soils
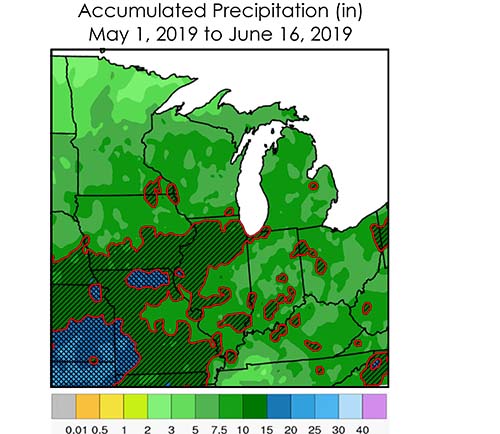
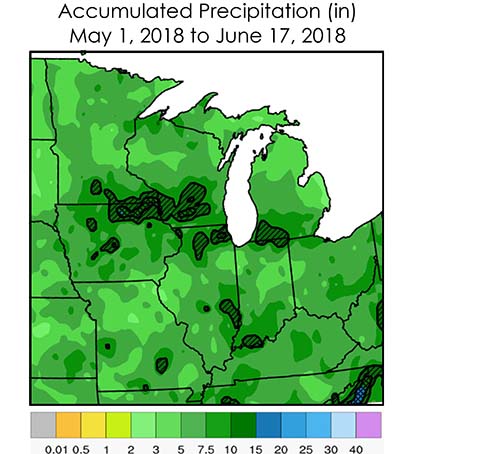
Poorly-drained soils lose N mainly by denitrification, which is very temperature-sensitive. My rule of thumb is that wet conditions in May and June cause denitrification losses, but losses in April are minimal.
Areas with diagonal shading are ‘danger areas’ that are on track to have 12 or more inches of rainfall from May 1 to June 30. This does not mean that significant loss of N has already happened, just that producers in these areas should be watchful and aware of the potential for N loss and deficiency.
Areas shown in cross-hatch are ‘problem areas’ that have already received 12 or more inches of rainfall since May 1. I expect a majority of fields to have substantial yield loss due to N deficiency when all N was applied pre-plant. I suggest that producers look at their fields and when N stress is seen apply additional N. Rescue N applications are likely to be profitable until tasseling or later in fields with deficiency symptoms. Canopy sensors potentially provide a way to improve distribution of this N application, putting more N where stress is greatest and little or none where corn looks good.