Nitrogen is the most-used fertilizer nutrient, and often gives large yield increases when applied to non-legume crops. Smil (Enriching the Earth, 2001, MIT Press) estimates that 40 percent of the human population would not be alive today without nitrogen fertilizer.

Nitrogen is also more prone to loss than the other primary nutrients. Nitrogen lost from crop fields contributes to low-oxygen coastal waters and to high nitrate concentrations in drinking water.

View all nitrogen resources

Nitrogen considerations

The nitrogen loss process is complicated, but producers need to be able to make decisions about applying additional nitrogen that are at least in the ballpark. And they need to be able to correctly prioritize which of their fields need the largest additional applications of nitrogen fertilizer. The nitrogen loss scoresheet (PDF) can provide some insight.

View all nitrogen loss resources

Nitrogen watch

Rainfall maps to identify areas at risk of nitrogen loss.

View nitrogen watch

Rate is one of the most crucial decisions in the nitrogen management process. Our on-farm research has shown that the most profitable N rate varies widely from field to field, and from place to place within a field. (See more: Field-Scale Variability in Optimal Nitrogen Fertilizer Rate for Corn)

In order to manage this variability, producers need to have a way to reliably diagnose where to put more N and where to put less. Diagnosis has, unfortunately, turned out to be difficult. Recent research has shown that crop color is a more accurate way to diagnose N need than other methods.

Diagnosis needs to not only be accurate but convenient. A hand-held meter can accurately diagnose nitrogen need, but is too slow to be convenient over large acreage. Aerial photos can also predict nitrogen need, and can be acquired quickly over large areas. However, weather may delay acquisition of photos from airplanes or drones. Large fleets of small satellites are helping to overcome this obstacle since they are capturing many images of a field each week and you can look back in time for a clear day instead of waiting for one in the future. Another limitation is that images are difficult to use successfully until a crop has reached full canopy (due to interference by soil color).

Reflectance (color) sensors mounted on a fertilizer applicator allow diagnosis and application of the appropriate fertilizer rate in a single trip through the field. This technology offers great promise to reduce nitrogen rates and minimize nitrogen loss to the environment while maintaining full productivity. Sensor-guided nitrogen management for corn (PDF) and cotton (PDF) is one of the main components of our research and extension programming on nitrogen management. Scharf has developed a manual to help producers, retailers and consultants who are interested in adopting crop sensor technology to guide variable-rate N applications. Managing nitrogen with crop sensors: Why and how (PDF) is based on six years of on-farm demonstrations, which followed seven years of research to set the foundation for why and how sensors can help to manage nitrogen fertilizer better.

View all nitrogen rate resources

Timing of nitrogen fertilizer applications is complex. There are substantial risks associated with applications that are too early or too late — moving targets that depend on the weather.

Nitrogen is more easily lost than other plant nutrients. If applied too early, the N may be lost before the crop takes it up. Loss occurs in wet weather, so whenever N is applied, excessively wet weather between N application and crop uptake makes the application too early.

at planting N application
At-planting vs sidedress N applications to corn at Columbia, Mo. in 2008

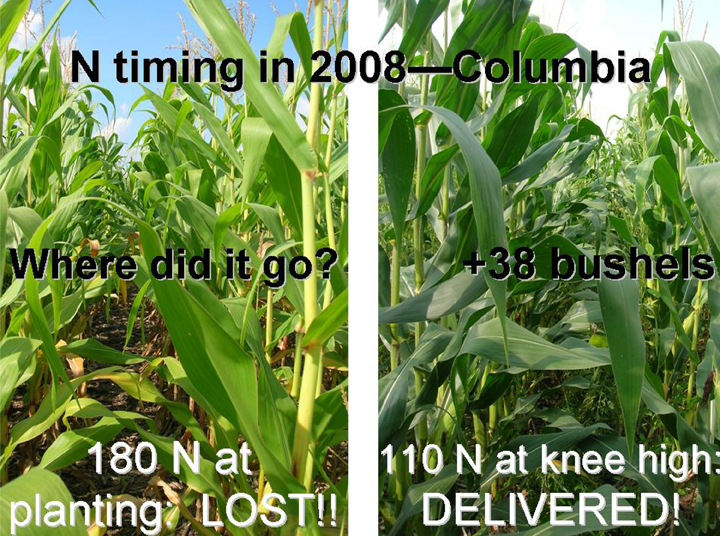
Even though our at-planting application on May 8 was much later than most producers, N was lost and the crop was very N deficient. Sidedress applications to knee-high corn delivered N to the crop much more effectively and gave higher yields with lower N rates.

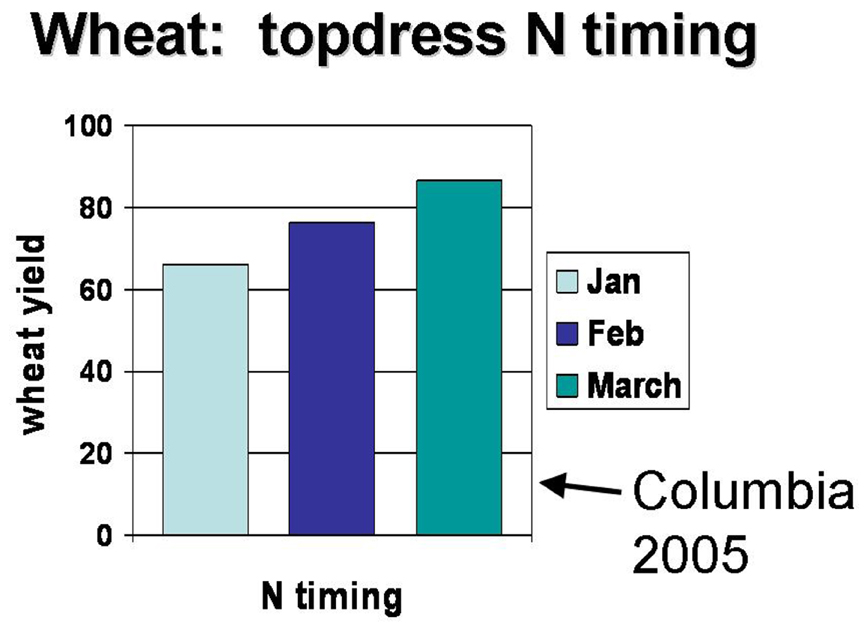
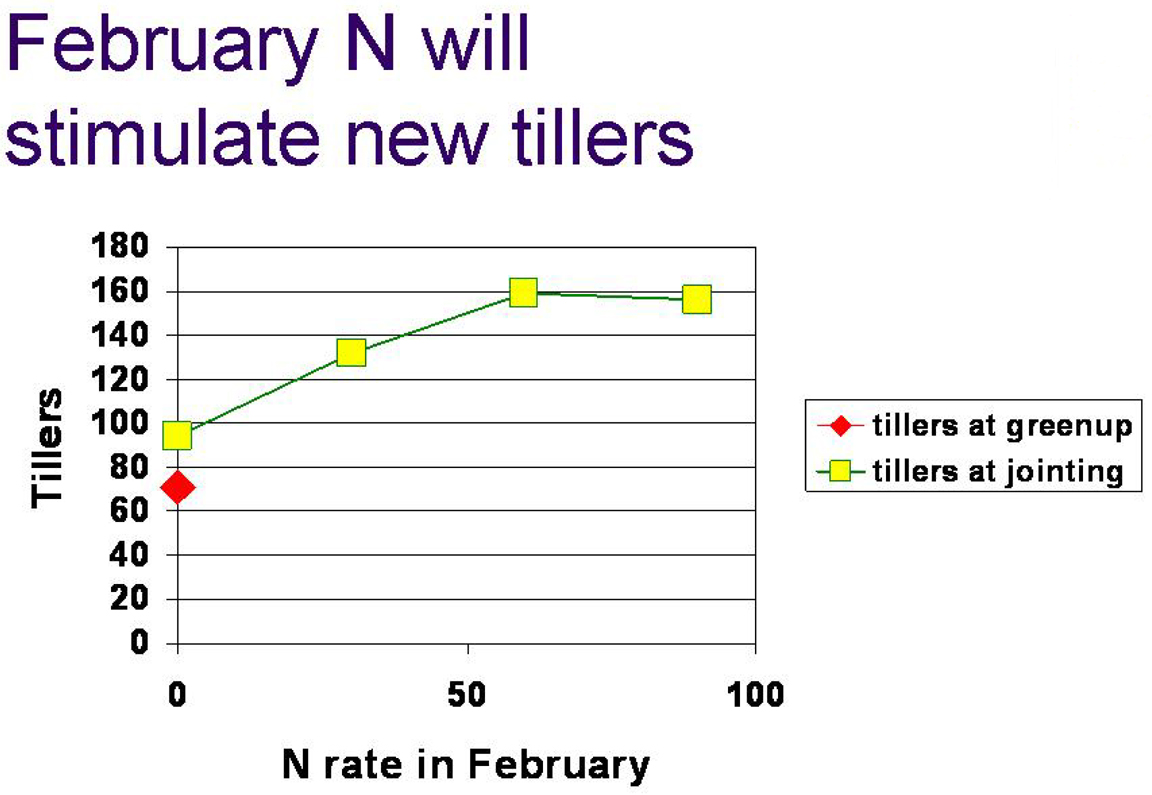
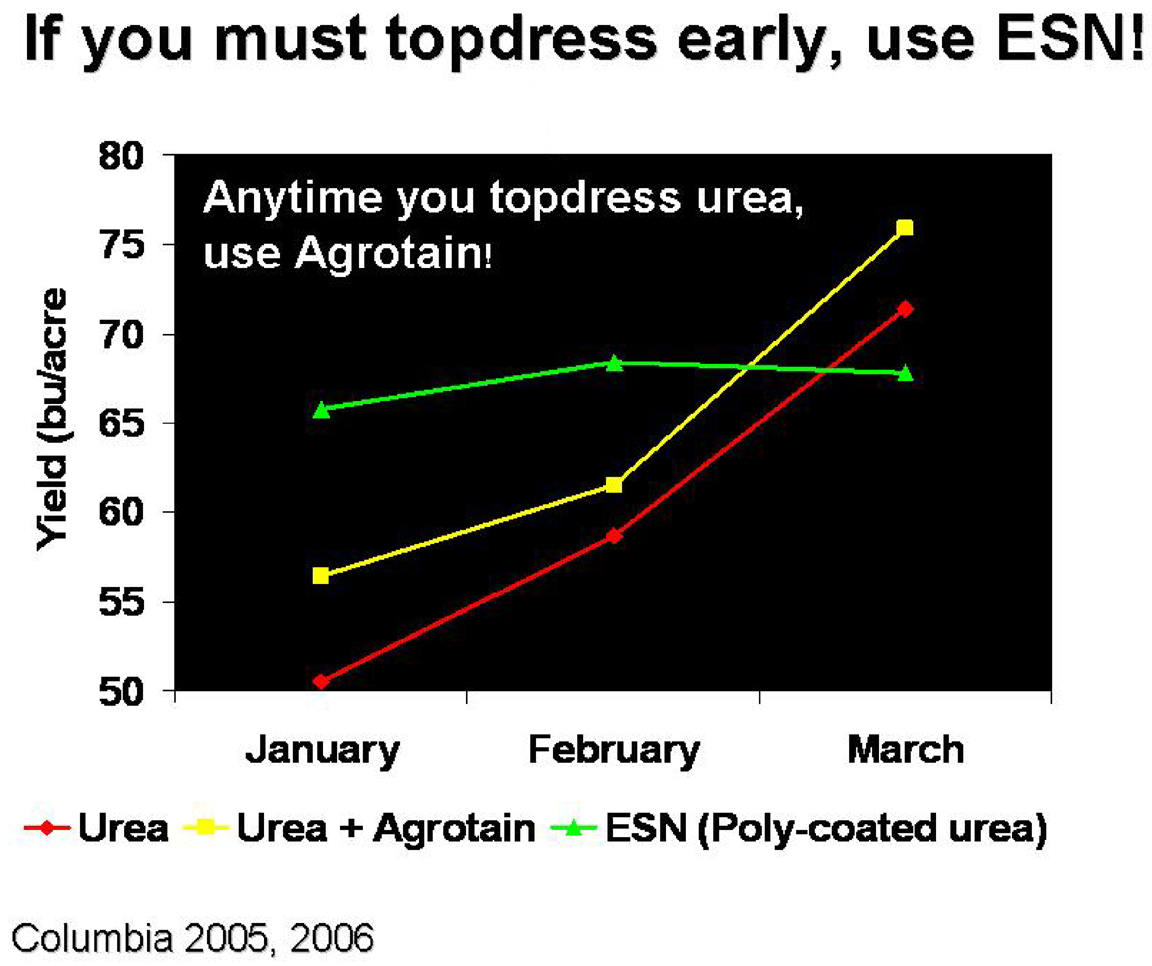
Wheat is also sensitive to N timing. In both 2005 and 2006, March topdressing gave substantially better yields than February or January applications. See 2005 results below. This happened even though rainfall was average. The reason for the lower yield with earlier topdress is not clear. However, similar N timing effects have been found by Steve Ebelhar and co-workers in Illinois. Wheat should be topdressed in March when possible unless tiller number at greenup is too low, in which case N should be applied at greenup to stimulate development of more tillers. If wheat is topdressed in January, ESN (coated urea) is preferred.

2005 results
2005 results
February N will stimulate new tillers
 
early topdress
Early topdress requires ESN
 

Ideally, nitrogen fertilizer would be applied just before the crop’s peak demand for N. For corn, this would be knee- to thigh-high, for wheat it would be just before jointing, and for cotton it would be at early square stage.

With this strategy, if weather prevents application at the planned time, then the N application will be too late. Crop yield may suffer or logistics of application may become more difficult or expensive, particularly with corn. Experiments across five states suggest that, with corn delayed N application gives (on average) the same yield as all pre-plant N until corn is 3 feet tall and declines slowly after that.

corn timing
Corn N timing
 

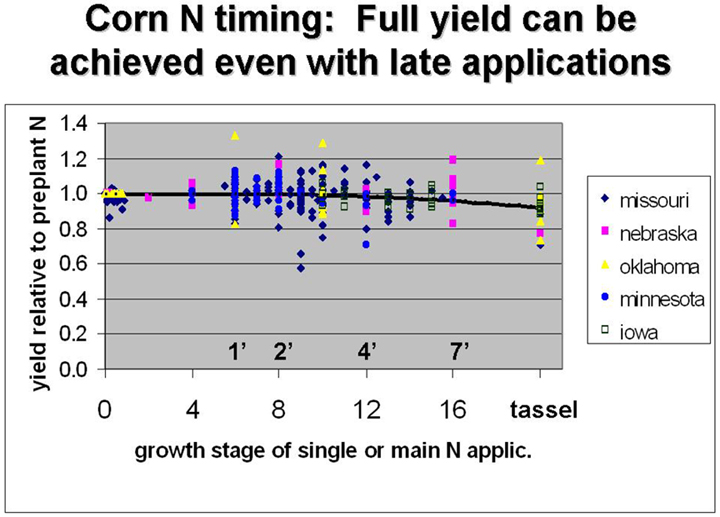
In some cases, delayed N application gives higher yields than preplant N, and in some cases it gives lower yields, on average balancing out. The biggest problem with corn N applications that are too late is that they can’t be made with tractor-based applicators.

Uneven application of nitrogen fertilizer is a longstanding problem that is getting worse. The main causes of uneven N application are:

  • Anhydrous ammonia manifolds that distribute N unevenly to knives.
  • ‘Dusty’ dry N fertilizer (urea or ammonium nitrate) spread with spinner spreaders. This problem is getting worse due to increasing imports of dry N fertilizer, leading to more handling (augering) and breakdown of prills or granules into smaller pieces. The smaller pieces can’t be spread as far as larger ones, and N rate is higher in and near the applicator path. Even when fertilizer is intact going into the spreader, it may break into smaller pieces when the spreader vanes hit it, causing similar problems with small particles that will not travel far enough.
  • Even when dry fertilizer quality is good, we have found uneven patterns using catch pans in commercially-applied fields.  Spinner spreader mechanisms need to be tested and adjusted to give the correct spread pattern.

View all even application resources

Grain nutrient removal per bushel of yield appears to vary from year to year and region to region based on samples collected at a range of sites around Missouri from 2006 to 2008 for corn (PDF)soybean (PDF), and wheat (PDF).

The variability seen means that calculated grain removal values for N, P, and K will not always be accurate. Most fertilizer recommendations use these removal values as part of the basis for rate decisions. Current National Research Council feed grain values for N, which are currently the basis for University of Missouri nutrient removal calculations, are shown in golden brown.

Applying nutrients at rates to replace those removed by the crop is a sound approach, but putting too much faith in the ‘book values’ for removal could lead to problems. Soil testing should be used as another source of information about the nutrient status of soils.