Top 10 U.S. states for corn production | Top 10 U.S. states for grain sorghum production | Top Missouri counties for corn production | Historical overview of Missouri corn farming | Historical overview of Missouri grain sorghum farming
Top 10 U.S. states for corn production
| State | Rank | Production — # of bushels | # of acres | Yield — bushels/acre |
|---|---|---|---|---|
| Iowa | 1 | 2,508,800,000 | 12,800,000 | 196 |
| Illinois | 2 | 2,278,500,000 | 10,850,000 | 210 |
| Nebraska | 3 | 1,787,500,000 | 9,310,000 | 192 |
| Minnesota | 4 | 1,363,180,000 | 7,490,000 | 182 |
| Indiana | 5 | 982,800,000 | 5,200,000 | 189 |
| South Dakota | 6 | 777,600,000 | 4,860,000 | 160 |
| Kansas | 7 | 645,000,000 | 5,000,000 | 129 |
| Ohio | 8 | 617,100,000 | 3,300,000 | 187 |
| Wisconsin | 9 | 545,240,000 | 3,170,000 | 172 |
| Missouri | 10 | 466,290,000 | 3,330,000 | 140 |
Source: U.S. Department of Agriculture/National Agricultural Statistics Service
Top 10 U.S. states for grain sorghum production
| State | Rank | Production — # of bushels | # of acres | Yield — bushels/acre |
|---|---|---|---|---|
| Kansas | 1 | 233,200,000 | 2,650,000 | 88 |
| Texas | 2 | 62,100,000 | 1,350,000 | 46 |
| Colorado | 3 | 17,225,000 | 325,000 | 53 |
| South Dakota | 4 | 16,000,000 | 200,000 | 80 |
| Nebraska | 5 | 15,980,000 | 170,000 | 94 |
| Oklahoma | 6 | 12,000,000 | 240,000 | 50 |
| Missouri | 7 | 2,100,000 | 21,000 | 100 |
| New Mexico | 8 | 1,786,000 | 47,000 | 38 |
| Illinois | 9 | 1,776,000 | 16,000 | 111 |
| Georgia | 10 | 795,000 | 15,000 | 53 |
Source: U.S. Department of Agriculture/National Agricultural Statistics Service
Top 10 Missouri counties for corn production, acreage and yield
| Production | Harvested Acres | Yield | |||
|---|---|---|---|---|---|
| County | Bushels | County | Number | County | Bushels / acre |
| 1. Saline | 27,467,000 | 1. Saline | 138,100 | 1. Lafayette | 206 |
| 2. Atchison | 23,617,000 | 2. Atchison | 128,300 | 2. Holt | 203 |
| 3. Nodaway | 21,401,000 | 3. Nodaway | 118,800 | 3. Saline | 199 |
| 4. Lafayette | 20,619,000 | 4. Lafayette | 100,300 | 4. New Madrid | 195 |
| 5. Holt | 19,362,000 | 5. Audrain | 99,700 | 5. Jackson | 193 |
| 6. Audrain | 17,839,000 | 6. Holt | 95,300 | 6. Dunklin | 190 |
| 7. Carroll | 15,545,000 | 7. Carroll | 86,800 | 7. Scott | 186 |
| 8. Chariton | 14,290,000 | 8. Chariton | 79,900 | 8. Cooper | 185 |
| 9. Stoddard | 11,507,000 | 9. Stoddard | 68,000 | 9. Atchison | 184 |
| 10. Bates | 11,313,000 | 10. Bates | 67,700 | 10. Mississippi | 183 |
Source: U.S. Department of Agriculture/National Agricultural Statistics Service
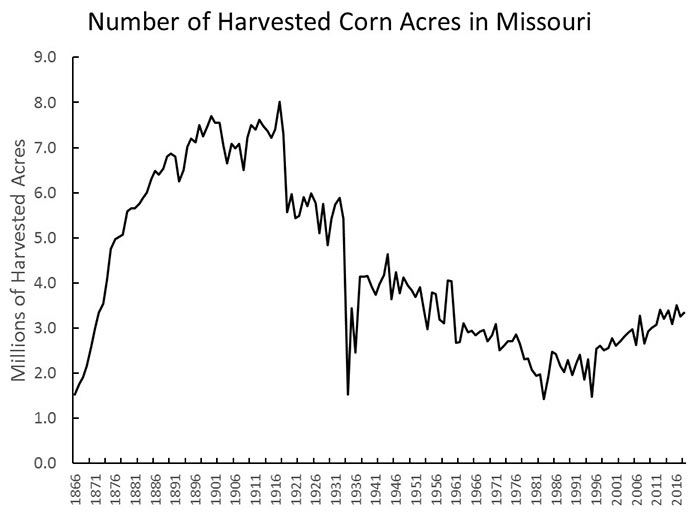
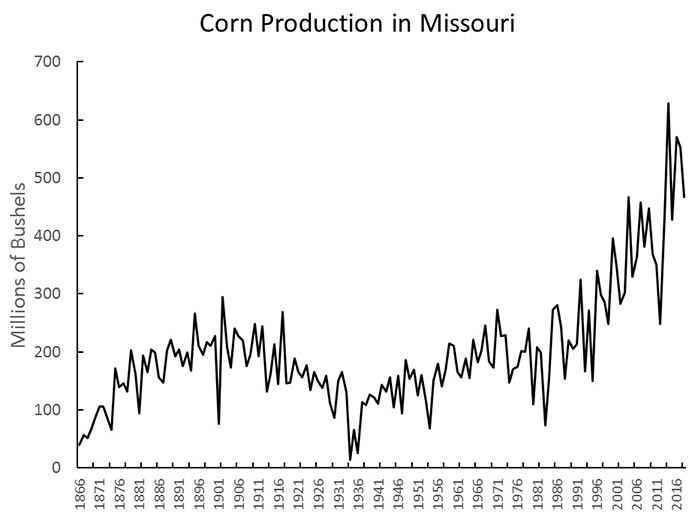
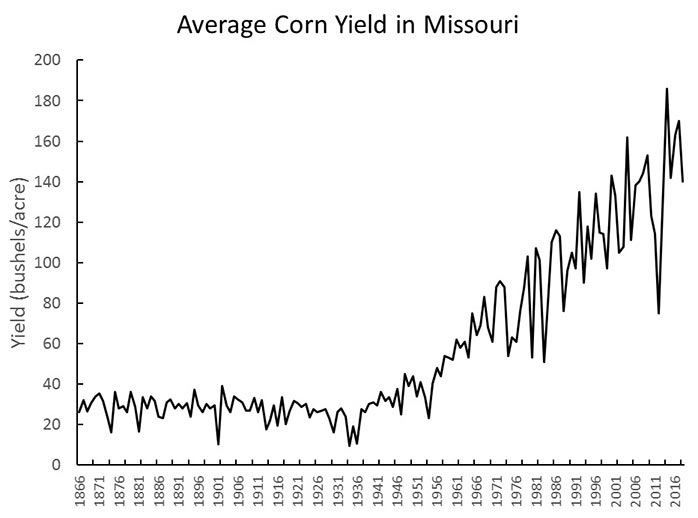
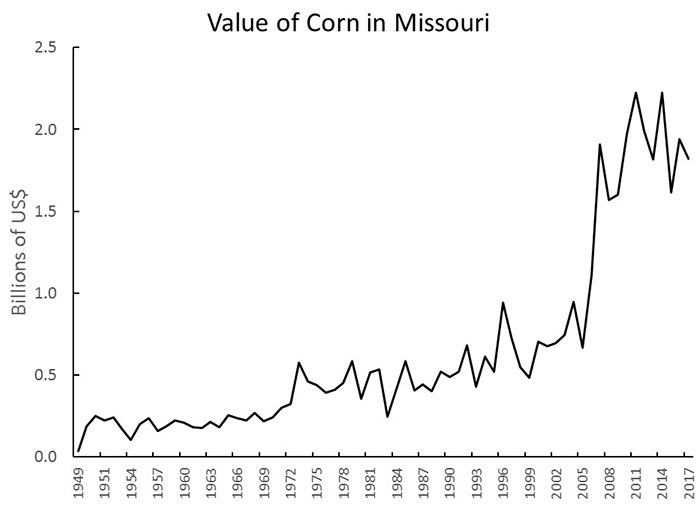
Historical overview of Missouri corn farming
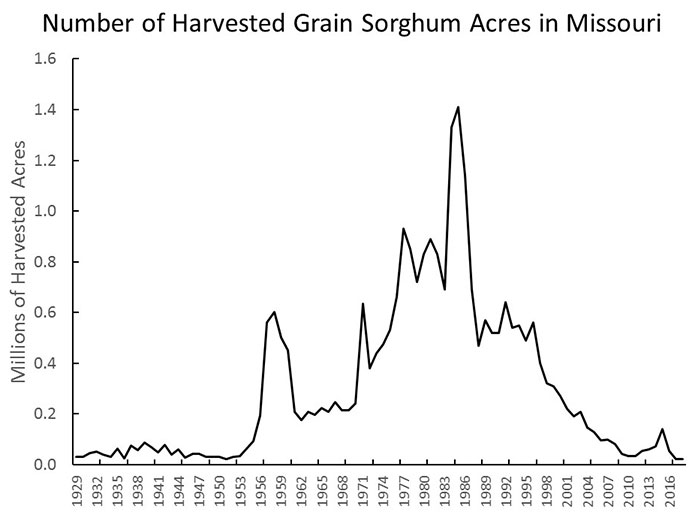
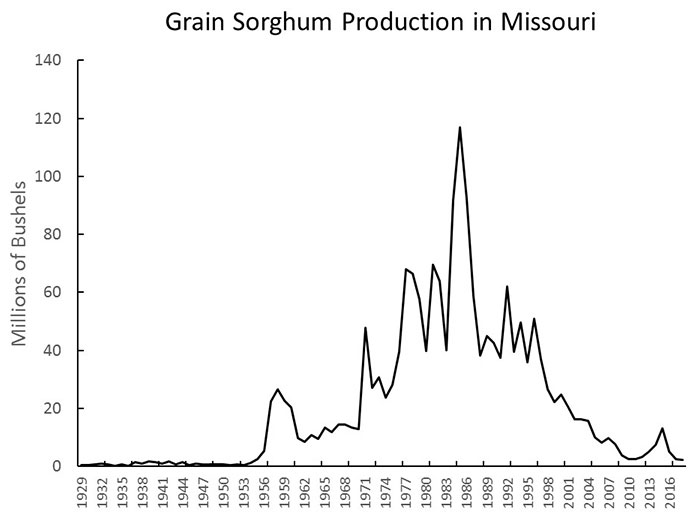
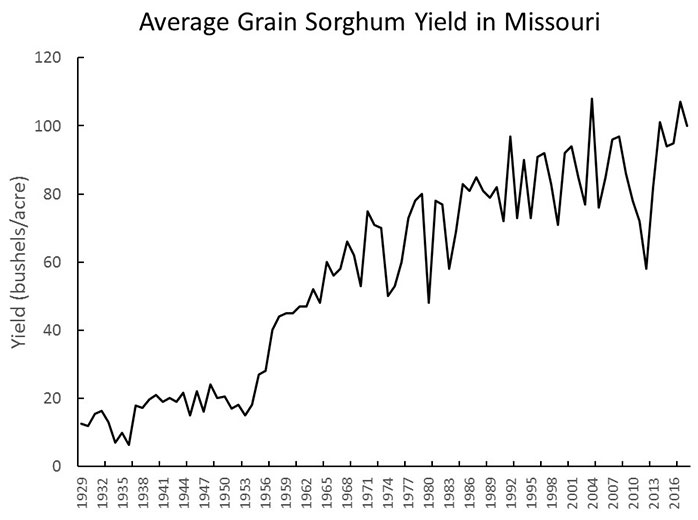
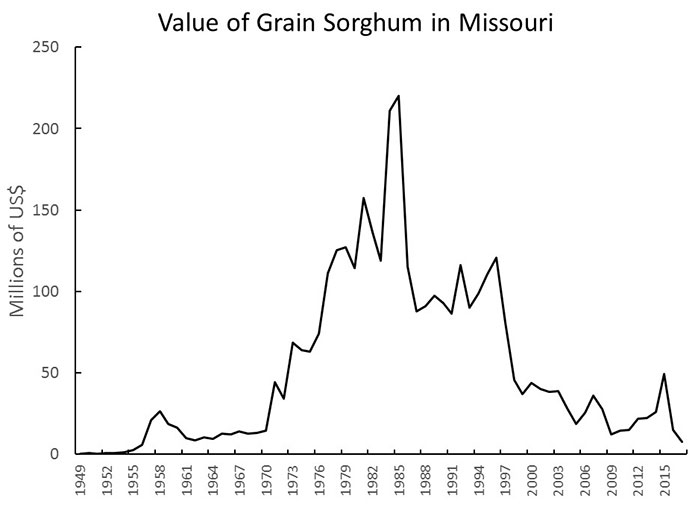
Historical overview of Missouri grain sorghum farming