In Missouri, soils generally contain from 800 to 2,000 pounds of total phosphorus (P) per acre. Most of the phosphorus is fixed, that is, not available for use by plants.
When added to soils, phosphorus fertilizer enters into several different reactions, including adsorption on soil particles and precipitation into various compounds. The speed and kind of reactions involved depend upon pH, soil moisture, form of fertilizer, and many soil chemical properties.
Despite the reactions, the net result is the retention of phosphorus, followed by its reversion to relatively insoluble and unavailable forms. The degree to which this happens depends in part on how much phosphorus is already in the soil. So phosphorus recommendations usually exceed crop removal because the soil renders some of the phosphorus unavailable.
The efficient use of phosphorus is becoming more and more important. This publication discusses:
- Phosphorus reactions in soil
- Soil phosphorus buildup
- Crop's response to phosphorus
- Efficient use of phosphorus through a management program that includes soil testing.
Phosphorus reactions in soils
Phosphorus is found in both organic and inorganic forms in soils. The organic forms are found in humus and plant residues. In general, the inorganic forms of phosphorus are very slowly available because of their reactions with iron, aluminum, calcium or other elements.
Organic phosphorus
Phosphorus in organic matter may account for up to one-half of the total phosphorus in Missouri soils. However, organic phosphorus is probably the more important half in supplying phosphorus to plants.
A process called mineralization converts organic forms of phosphorus to inorganic available forms. This conversion occurs as microorganisms break down organic matter. Mineralization is most rapid in warm, well-aerated soils when microorganisms are most active.
In the spring, when soils remain wet and cold for long periods, crops often show symptoms of phosphorus deficiency. With the onset of warm weather, the crop may grow out of the deficiency. This deficiency is caused by the slow breakdown and release of the organic phosphorus, the slow rate of root growth and the reduced availability of oxygen, which may affect phosphorus uptake. Under these conditions, a small amount of row-applied phosphorus benefits early growth on corn more than broadcast phosphorus only.
Inorganic phosphorus
Phosphorus is taken up by plants as inorganic ions (H2PO4- and HPO4-2), which are present in the soil solution. These inorganic phosphate ions will readily react with iron, aluminum and manganese. With soils that have salt pH greater than 7.0, phosphorus becomes unavailable when it reacts with calcium. Liming acid soils to a salt pH of 5.5 to 7.0 increases solubility of iron, aluminum and other metal phosphates. Thus, the availability of soil and phosphorus fertilizer is increased (Figure 1).
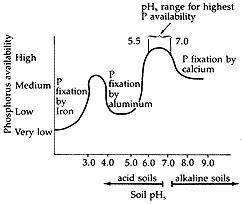 Figure 1
The availability of phosphorus is affected by soil salt pH.
In addition to the effect of pH, phosphorus availability also depends on the forms present in the soil. Apatite, a soil mineral which contains phosphorus, is very insoluble and very slowly available to plants. Weathered iron and aluminum phosphates and stable organic phosphates are also very slowly available. Freshly formed calcium, iron and aluminum phosphates as formed from fertilizer phosphorus and mineralized phosphates are slowly available to plants (Figure 2).
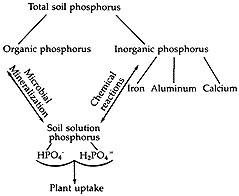 Figure 2
Soil phosphorus forms and plant uptake.
Readily available forms of soil phosphorus, such as the water-soluble and citrate-soluble phosphates, make up most of the phosphorus fertilizer sources generally used in agriculture (Table 1). In general, crops respond equally to any phosphorus fertilizer sources with greater than 50 to 60 percent water solubility.
Table 1
Water solubility of several conventional phosphorus fertilizer sources.
| Fertilizer material | Representative grades, percent N - P2O5 - K2O | Water solubility |
|---|---|---|
| Triple super phosphate | (0-46-0) | 87 percent |
| Diammonium phosphate | (18-46-0) | 95 percent |
| Ammonium polyphosphate | (10-34-0) | 100 percent |
| Monoammonium phosphate | (11-53-0) | 93 percent |
| Phosphoric acid | (0-55-0) | 100 percent |
| Rock phosphate | (0-32-0) | less than 1 percent |
TVA (1980)
Most rock phosphate materials fall into the categories of very slowly and slowly available phosphates. Phosphorus in the soil solution is present at very low concentrations, even when soils are moist to field capacity and contain adequate phosphorus reserves. Concentrations are frequently in the range of 0.05 to 0.25 pounds of phosphate (P2O5) per acre in the surface 6 inches of soil. As a crop grows, this phosphorus in solution is taken up by the plant. Then through the slow chemical reactions of the organic, inorganic and fertilizer reserves, soil solution phosphorus is replenished.
For example, assume an alfalfa crop of 6 tons per acre removes about 60 pounds of P2O5. If you then assume most of the phosphorus is taken up from the top foot of soil and the soil solution contains 0.25 pounds of P2O5 per acre in the top foot, the soil solution would need to have been renewed 240 times during that growing season. Also, remember these figures account for only the phosphorus taken up by the forage and do not include that required by the roots. Soil conditions must favor organic phosphorus mineralization and chemical weathering of inorganic or mineral forms to provide adequate phosphorus to a growing crop.
Building up soil phosphorus
On soils low in available phosphorus, the fertilizer rates that yield the greatest return are usually higher than the amount of phosphorus that crops remove from the soil. As soil test phosphorus increases, the crop's response to fertilizer phosphorus generally decreases.
Through proper use of fertilizer phosphorus, farmers are increasing soil test phosphorus levels on many of their fields (Table 2). Figure 3 shows the 1981 percentage of soil samples tested in each county that fell into the high available phosphorus category. Over three-fourths of the soils in the extreme northwest and in the Bootheel region of Missouri tested high or very high in phosphorus. It's likely that the crop response to phosphorus fertilizer on those high-testing soils would not be great. Small maintenance applications of phosphorus, or in some cases no phosphorus for a few years, would be adequate for top yields.
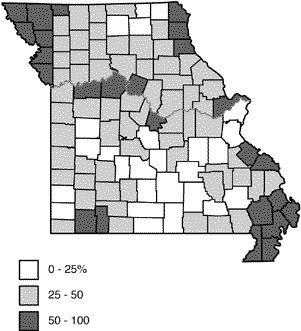 Figure 3
Percent of soil samples testing high in available phosphorus.
Table 2
Available phosphorus level in soil tested by MU Soil and Plant Testing Laboratory
| Available P level | 1972 | 1978 | 1984 | 1989 |
|---|---|---|---|---|
| Very low | 27 percent of samples | 31 percent of samples | 27 percent of samples | 22 percent of samples |
| Low | 29 percent of samples | 36 percent of samples | 15 percent of samples | 16 percent of samples |
| Medium | 17 percent of samples | 16 percent of samples | 27 percent of samples | 27 percent of samples |
| High and very high | 37 percent of samples | 37 percent of samples | 32 percent of samples | 35 percent of samples |
However, very few Ozark soils have adequate phosphorus soil test levels. This strongly suggests that phosphorus fertilizer rates should exceed crop removal or maintenance levels to build up available phosphorus in these soils. In these areas, crop response to phosphorus fertilizer would likely be great. Figure 4 shows alfalfa's yield response to phosphorus plowdown and topdressing rates on a very low-testing soil in Howell County. These data represent the second year of growth; the alfalfa had been established in the spring of the previous year.
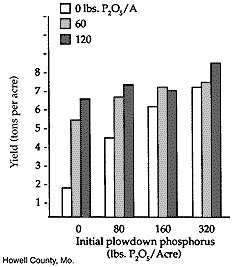 Figure 4
Alfalfa response to phosphorus, very low available phosphorus.
Building up available phosphorus in soils gives flexibility in fertilizer management. When soils test high in phosphorus, you can apply fertilizer every two or three years to maintain high phosphorus availability. But if your cash flow is tight one year, you can delay phosphorus application without fear of reducing yields.
Table 3 shows average phosphorus requirements to increase soil tests from the current level to a desirable level during eight years of annual application. The desirable level of phosphorus varies with crops. In general, row crops and small grains should be increased to 45 pounds phosphorus per acre. Soil for most forages should be at the 40 pounds phosphorus level. The soil test level for warm-season grasses, lespedeza and birdsfoot trefoil should be at the 30 pounds phosphorus per acre soil test level.
Table 3
Building up soil phosphorus
This table shows phosphorus fertilizer required to increase a soil test level to a desired level during an eight-year period.
| Phosphorus soil test level per acre | Desired Bray-I soil test level (pounds of P per acre) | ||
|---|---|---|---|
| 30 | 40 | 45 | |
| Phosphorus fertilizer rate (pounds P2O5) | |||
| 5 pounds | 45 | 57 | 62 |
| 10 pounds | 32 | 43 | 49 |
| 15 pounds | 22 | 34 | 39 |
| 20 pounds | 14 | 25 | 31 |
| 25 pounds | 7 | 19 | 24 |
| 30 pounds | 12 | 17 | |
| 35 pounds | 6 | 9 | |
| 40 pounds | 5 | ||
| 45 pounds | |||
Table 4 shows phosphorus soil test interpretations. Building soil phosphorus gradually over several years is recommended for greatest economic benefit. Testing the soil every two to three years to determine the effect of the fertilizer on your soil phosphorus test level is also recommended. These tests provide a basis for adjusting application rates.
Table 4
Phosphorus soil test levels and ratings for a desired level of soil phosphorus
| Soil test rating | Probability of response (percent) | Warm-season grasses, etc. | Crops and forages | Row crops and small grains |
|---|---|---|---|---|
| Soil test level (pounds of P per acre) | ||||
| Very low | 80 to 100 | 0 to 9 | 0 to 12 | 0 to 14 |
| Low | 50 to 80 | 9 to 15 | 12 to 20 | 14 to 22 |
| Medium | 20 to 50 | 15 to 30 | 20 to 40 | 22 to 45 |
| High | 5 to 20 | 30 to 45 | 40 to 60 | 45 to 70 |
| Very high | 0 to 5 | 45 to 90 | 60 to 120 | 70-135 |
| Extremely high | 0 | 90+ | 120+ | 135+ |
In addition to your efforts to build up the phosphorus level, maintenance fertilizer application is recommended. Maintenance applications are based on crop removal. Table 5 gives average phosphorus removal for some commonly grown Missouri crops.
Table 5
Phosphorus removal by selected Missouri crops
| Crop | Yield | Phosphorus fertilizer equivalent removal (P2O5) |
|---|---|---|
| Alfalfa hay | 4 tons per acre | 40 pounds |
| Red clover/grass hay | 3 tons per acre | 25 pounds |
| Fescue | 3 tons per acre | 27 pounds |
| Corn (grain) | 120 bushels per acre | 54 pounds |
| Sorghum (grain) | 6,000 pounds per acre | 56 pounds |
| Soybeans | 45 bushels per acre | 38 pounds |
| Wheat | 50 bushels per acre | 30 pounds |
Efficient use of phosphorus
To get the best use of fertilizer phosphorus, determine the need. Soil testing is the cheapest and most effective means for determining fertilizer need. MU presently uses the Bray and Kurtz 1 or weak Bray soil test for phosphorus. Results are expressed in pounds of phosphorus per acre.
If very low tests show that a soil requires very heavy amounts of fertilizer phosphorus, management of fertilizer can improve efficiency and allow you to reduce your rate of fertilizer without much loss in yield. Some practices that are more efficient than broadcast applications are:
- Band applications at seeding, to the side and slightly below the seed
- Incorporation into the root zone, 4 to 6 inches deep
- Band application with tillage equipment such as a field cultivator, surface band application followed by tillage has given some improved efficiency of phosphorus uptake in limited experiments.
Applying fertilizer at less than the suggested rates increases the risk of losing potential yield. If you must decrease rates, be sure that placement is in the rooting zone of moist soil to ensure the best possible efficiency.
With limited capital, always apply fertilizer to the soils testing the lowest in available phosphorus first. These soils have the greatest potential for response. Medium- or high-testing soils may yield the same with or without additional phosphorus fertilizer except under ideal growth conditions.
This publication is a revised edition. The original author is Daryl D. Buchholz, professor of agronomy at Kansas State University and former faculty member at MU.