Slurry operations are characterized by straight-sided concrete or glass-lined steel manure storage facilities that minimize or eliminate the amount of rain entering the storage and ensure that all the manure is collected and applied at least annually. Slurry manure has a higher concentration of nutrients, higher solids content and lower volume than manure from lagoon operations. Slurry storages are frequently covered, often as under-building storages. One benefit of covered storages is that the volume of manure changes little from year to year. Another advantage of slurry storage systems over lagoons is a smaller manure surface area in contact with the air and a greater opportunity to treat odor as it is vented from a slurry pit under a building.
Construction costs and manure application equipment are frequently more expensive for slurry operations than for anaerobic lagoon operations. These costs can be offset by capitalizing on the increased value of the manure as a fertilizer. It is critical for slurry operations to maximize the fertilizer value of manure. To be successful, slurry operations need to be closely linked with a cropping system that can make use of most of the fertilizer value in the manure. Matching slurry systems with the optimum cropping system has the added benefit of reducing water quality risks associated with overapplication of nutrients.
Slurry manure storage facilities are becoming a more common choice for wean-finish and grow-finish swine operations. This guide helps producers with an existing slurry swine finishing operation or those considering building such an operation to evaluate the land needs, fertilizer value and manure application costs.
This guide focuses on covered slurry manure systems where the manure is injected into fields for corn and soybean production or where the manure is surface applied to fescue pastures. Calculations are based on 4,800-head wean-finish and grow-finish operations. All values in this guide are estimates and should be used for illustrative purposes only. Evaluate the rations used on your farm and use manure testing to determine the proper manure application rates for your farm.
This guide has four parts:
- Managing slurry on corn-soybean rotations.
- Managing slurry on fescue.
- Evaluation of potential returns on investment in slurry storage facilities and land application equipment.
- Additional information used to develop recommendations.
The value of manure varies considerably from farm to farm depending on a wide range of factors. Contact the MU Commercial Agriculture Program if you need a comprehensive estimate of manure value and the feasibility of manure management systems for a specific situation.
Managing slurry on corn-soybean rotations
In corn-soybean rotations, apply manure to meet the nitrogen need of corn and rotate fields receiving manure to ensure that they are balanced for phosphorus. Apply manure every other year to meet the nitrogen need in corn in a corn-soybean rotation. This strategy will be close to phosphorus balanced when using phosphorus-optimized phytase-based diets. This strategy also will maximize the fertilizer value in the manure.
Use soil testing every fourth year in the fall before manure application to monitor trends in soil test phosphorus and potassium. Farmers applying manure every other year often require additional potassium fertilizer applications to maintain soil potassium levels.
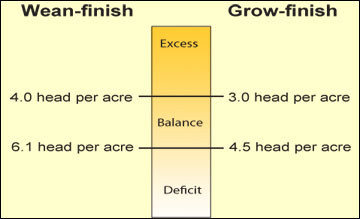 Figure 1
Evaluate phosphorus balance on your farm. Divide your barn capacity by the total acres receiving manure. For example a 4,800-head grow-finish operation applying manure to 1,200 acres has a density of four head per acre. According to the figure, phosphorus inputs are similar to exports on this farm. This figure assumes corn-soybean rotation, slurry manure and optimized low-phosphorus diets. Balanced range reflects differences in yield potential; higher animal densities are supported on more productive land.
Estimated manure value and cost of application
Annual nitrogen, phosphorus and potassium value of swine slurry from a 4,800-head wean-finish operation is estimated to be $51,685 and from a 4,800-head grow-finish operation is estimated to be $68,750. These estimates are based on fertilizer value of $0.35 per pound for nitrogen, $0.28 per pound for phosphate and $0.22 per pound for potash. The recommended practices allow corn and soybean producers to make full use of all the nutrients in the manure. There are also potential savings in fertilizer application charges because manure provides all the nutrient needs for both crops in some years.
Manure application time and costs for a 4,800-head wean-finish or grow-finish operation vary with water use in the building, amount of rainfall entering the storage, the productivity of the land, the distance to fields where manure is applied, the method of manure application and discharge rate from the tanker spreader. Estimated costs for manure application are based on the following assumptions:
- A land base where 50 percent of the land surrounding the operation was in crop production and available for manure application.
- Manure was applied using a 6,000-gallon spreader pulled by a 225-hp tractor. The equipment complement for manure application also included a 105-hp tractor used to power a pump for agitating and removing manure from the storage facility.
- Discharge rate for the manure spreader was adjusted from 350 to 700 gallons per minute to ensure that travel speed during application was less than 5.5 miles per hour.
- Average travel distance to reach all fields needed for manure application was about one mile in this analysis.
- Fuel cost was estimated at $2.00 per gallon and labor at $10 per hour.
Manure application costs ranged from $13 to $24 per thousand gallons for all scenarios using a 6,000-gallon tractor-pulled manure spreader; higher costs were associated with less productive soils requiring more acres for land application (Table 1). Application costs included fuel, labor and all equipment ownership costs. Cost of manure application ranged from 50 to 60 percent of total potential value of manure. Net manure value, after cost of application, exceeded $23,500 per year for wean-finish operations and $35,500 per year for grow-finish operations for all scenarios; returns increase when manure volume is minimized and manure is applied to more productive soils.
Manure application costs are sensitive to manure volume and concentration. Wet-dry feeders reduce the volume of the manure while increasing nutrient concentration. This reduces the number of loads of manure needed to fertilize a field, reducing cost of application (Table 1). The impact of this technology that reduces the volume of animal waste by about 30 percent emphasizes the importance of water management for reducing manure management costs.
It is critical that slurry operations capture the fertilizer value of manure. For slurry systems to a much greater extent than for anaerobic lagoon systems, profitability is closely linked to capturing the value of manure. Capturing this value is most easily done by applying slurry manure onto crop ground under your control so that you can capture the value of the manure through reduced purchases of commercial fertilizer. It is more difficult to obtain full fertilizer value if you sell manure because some of the liabilities of manure as a fertilizer make manure nutrients less valuable than commercial fertilizer nutrients.
Table 1
Average annual time and costs associated with manure application for 4,800-head wean-finish and grow-finish operations applying slurry manure as fertilizer.
| Yield goal | Standard feeders | Wet-dry feeders | ||||
|---|---|---|---|---|---|---|
| Time (hours per year) |
Cost* | Time (hours per year) |
Cost* | |||
| $ per year | $ per 1000 gallons | $ per year | $ per 1000 gallons | |||
| 6,000-gallon tractor-pulled spreader — Corn-soybean rotation, manure only on corn | ||||||
| 4,800-head wean-finish | ||||||
| 130-40 corn-soybean, bushels per acre | 234 | $32,697 | $18.21 | 218 | $31,512 | $24.23 |
| 150-50 corn-soybean, bushels per acre | 205 | $30,469 | $16.97 | 179 | $28,360 | $21.81 |
| 170-60 corn-soybean, bushels per acre | 180 | $28,450 | $15.85 | 156 | $26,426 | $20.32 |
| 4,800-head grow-finish | ||||||
| 130-40 corn-soybean, bushels per acre | 322 | $39,229 | $16.05 | 298 | $37,441 | $21.32 |
| 150-50 corn-soybean, bushels per acre | 286 | $36,594 | $14.98 | 246 | $33,653 | $19.16 |
| 170-60 corn-soybean, bushels per acre | 249 | $33,865 | $13.86 | 213 | $31,124 | $17.72 |
| Dragline injection system — Corn-soybean rotation, manure only on corn | ||||||
| 4,800-head wean-finish | ||||||
| 150-50 corn-soybean, bushels per acre | 63 | $24,058 | $13.40 | 74 | $26,016 | $20.00 |
| 4,800-head grow-finish | ||||||
| 150-50 corn-soybean, bushels per acre | 100 | $29,046 | $11.89 | 97 | $28,733 | $16.36 |
| 6,000-gallon tractor-pulled spreader — Fescue 50-50 hay-pasture, manure every 6 years | ||||||
| 4,800-head wean-finish | ||||||
| 4 tons per acre | 186 | $27,315 | $15.21 | 143 | $23,685 | $18.21 |
| 4,800-head grow-finish | ||||||
| 4 tons per acre | 361 | $33,139 | $13.56 | 199 | $28,366 | $16.15 |
*Manure costs include labor, fuel and equipment costs but not the effect of increased facilities costs for slurry operations.
Time needed for manure application
One cost of manure is the time needed to apply it (Table 1). Farmers must carefully consider if they will have time to apply their manure at the optimum time for application. All tractor-pulled spreader scenarios required three or more work weeks to apply manure.
Ideally, manure is applied in spring close to corn planting time. Spring applications reduce the potential for nitrogen loss between the time of application and the time the crop needs nitrogen. But the extra time needed to fertilize fields with the low-concentration nutrient sources such as manure may pose problems for farmers in the busy spring field season. Another potential application window in northern Missouri (north of I-70) is in late fall after soil temperature has dropped below 40 degrees Fahrenheit. Manure injected into near-freezing soils will remain in the organic and ammonium form as long as soil temperature remains near freezing. In these forms it cannot be displaced from the soil in excessively wet periods in winter and spring.
If application time is too long to fit into these application windows, alternative spreading options include increasing the size of the tanker spreader, using two applicators to apply manure and using a nurse tank to transport manure to fields. All of these options increase application costs.
Extended application times may also have building management implications because building use may be restricted while under-building storages are agitated. For example, agitation may not be possible when young pigs are in the building because they may be more sensitive to the elevated emissions from agitation and the effects of aggressive ventilation procedures. Another benefit of wet-dry feeders is that they reduce both the time and the cost of manure application (Table 1).
Dragline systems
Farms where manure transfer pipe can be laid to all application fields have the option of using a dragline injection system for manure application. Dragline systems pump manure through a transfer pipe to an umbilical line directly attached to a manure injection toolbar on a tractor. The tractor drags the umbilical delivery hose across the field as it injects manure into the soil. Equipment purchase costs are higher for this system than for spreader systems, primarily because of the cost of transfer pipe, but dragline systems typically reduce the time for manure application by at least 50 percent by eliminating the time spent transporting manure by road to the field for application (Table 1). This system has the potential to make slurry more feasible on farms that can use a pipe system to reach their fields.
Managing slurry on fescue
There is considerable interest in integrating slurry manure into forage systems. Managing slurry on forages has the benefit that manure can be applied at many different times of year, making it easier to apply when conditions are favorable for manure application.
Surface application of manure to fescue is recommended as a fall fertilizer to supply 100 pounds of plant-available nitrogen once every four to six years. This rate of application will provide all the phosphorus needed for the cycle and the potash and fall nitrogen needed in the year of application. Apply manure more frequently on fields where you want soil test phosphorus to increase; less frequently on fields where you want to reduce soil test phosphorus levels. Soil testing can be used before manure application to monitor trends in soil test phosphorus. Manure can be applied more frequently when fescue is grown solely as a hay crop because hay has a higher phosphorus-removal capacity.
Applying manure on the surface at a rate that provides 100 pounds of nitrogen per acre will provide nearly five times the annual phosphorus removal capacity of a fescue field used for both hay and pasture. On soils that test low for phosphorus, this would be beneficial because it leads to increased soil test phosphorus. One 4,700-gallon per acre application has the potential to raise soil test phosphorus over 12 pounds per acre. Annual applications at this rate will rapidly raise soil test phosphorus to levels well above agronomic optimum. Manure phosphorus will have no value when applied to high phosphorus-testing soils, eliminating over one-third of the fertilizer value in the manure.
Land needs for fescue systems
Typically fescue fields are in pasture some of the year and are hayed at other times. A forage system typically has a substantially lower annual need for phosphorus than a row crop system does. A fescue field with a yield goal of four tons per acre with 50 percent of the harvest as hay and 50 percent harvested through grazing has an annual phosphate removal capacity of 25 pounds per acre. A corn-soybean rotation would have at least double this annual phosphate removal capacity.
Low phosphate removal capacity translates into larger land requirements for phosphorus-based nutrient management. A 4,800-head wean-finish operation would require a land base of 2,290 acres, and a grow-finish operation of the same size would require a land base of 3,070 acres for phosphorus balance (2.1 and 1.6 head per acre, respectively). Land base for fescue grown solely as a hay crop will require about 30 percent less land (3.0 to 2.3 head per acre) because of the higher phosphorus removal rate.
Managing manure in forage systems
Fertilizer nitrogen applications on fescue are recommended to be split between an application in early spring and a second application in August or early September. Manure best fits into forage systems when it is applied in the August-to-early-September application window to provide fertilizer requirements for fall growth. Applications at this time have much less potential for runoff of manure soon after application than early spring applications. The recommended rate for fall application is typically 100 pounds N per acre.
Ideal forage management in Missouri includes maintaining a significant legume component in a fescue stand and not overapplying nitrogen. High rates of nitrogen promote fescue toxicity and reduce the competitiveness of legumes. Legumes increase the quality of the forage mix and dilute some of the toxic effects of fescue. Ideally the legume component should make up 25 percent or more of spring forage.
Manure is beneficial to legumes in that it can be used to raise soil test phosphorus. Clover and alfalfa require soil test phosphorus to be at least medium for good persistence. However, the nitrogen in manure will tend to reduce the legume component in fescue stands. The recommended strategy is designed to minimize the negative effects of manure on mixed stands of fescue and clover. Applying manure in the fall limits the impact of the applied nitrogen on the clover while promoting fall fescue growth. Applying manure infrequently provides additional opportunities for the legume to thrive.
Manure applications on forages almost have to be some form of surface application. Typically, slurry would be sprayed on the surface. Injection of manure is difficult because of the permanent vegetation and because it has a tendency to leave the ground rough. Low application rates sometimes associated with low nitrogen requirements on forages can also be difficult to attain with injection equipment; it can be difficult to inject manure at the rate of 3,000 gallons or less per acre with equipment that has a pass width of only 10 or 12 feet.
Estimated manure value and cost of application
The annual value of nitrogen, phosphorus and potassium of swine slurry from a 4,800-head wean-finish operation surface applied to fescue is estimated to be $42,940 and from a 4,800-head grow-finish operation is estimated to be $57,030. These estimates are based on fertilizer value of $0.35 per pound for nitrogen, $0.28 per pound for phosphate and $0.22 per pound for potash. The value is less than for injected manure because of ammonia volatilization losses with surface application. The recommended practice of applying manure to provide 100 pounds of nitrogen every four to five years would allow the crop producer to make full use of all the nutrients in the manure.
For tractor-pulled spreaders, application time and costs of application are similar to manure management on row crop ground (Table 1). Application rates are typically lower on pastures. However, surface application facilitates faster discharge rates and wider application patterns from the spreader, reducing application time compared with injection of manure at the same rate.
It is critical for slurry operations to capture the fertilizer value of their manure. But, it is more difficult to profitably use slurry in forage systems compared to grain-crop systems. Potential difficulties in maximizing manure value in forage-based systems include:
- A significant amount of the nitrogen in surface-applied manure is lost as ammonia, thus reducing the nitrogen value of the manure. It is also difficult to predict nitrogen loss from surface-applied manure, making it a less reliable fertilizer than injected manure.
- Farmers typically are not as aggressive about fertilizing fescue pasture with phosphorus; adding manure as a phosphorus source will not necessarily result in a lower fertilizer bill.
- Manure can reduce the quality of fescue-clover pasture if it is overapplied.
There are other ways to capture the fertilizer value of manure on pastures. Higher soil test phosphorus levels will support legumes. Establishing legumes will reduce or eliminate fertilizer nitrogen needs on pastures. Increased productivity and forage quality may allow higher stocking rates.
Is slurry manure a good investment?
Slurry manure can be profitable, particularly when applied to corn-soybean rotations. But is slurry manure a good investment? Do farmers who invest in the equipment and extra storage cost to handle slurry get a good return on their investment?
Return on assets (ROA) is one way to evaluate whether an investment is a worthwhile way to use limited financial resources. The investment alternative that has the highest ROA is preferred over one that may be more profitable but requires more investment in assets.
The following equation is used to estimate ROA:
ROA = Net income + Interest/Assets
In this assessment of ROA for manure management, the following conditions apply:
- Net income is the value of the manure less the costs of application.
- Assets are the assets dedicated to manure management. Assets include the following:
- Manure application equipment such as tankers, pumps, hoses and pipe.
- Tractors used for manure application. Frequently, manure application is only one of many tasks a tractor is used for. The asset should be valued for manure management at the percentage of the annual time it is used for manure management activities.
- Some of the manure storage facility value may be a manure management asset. If you were choosing a slurry storage facility over a less expensive lagoon because slurry manure is more profitable, then the added cost of the slurry storage is a manure management asset.
- Land you purchase solely for access for manure application is also considered a manure management asset.
- Interest is the interest expense associated with your manure management assets.
Assets are the most difficult portion of the ROA equation to estimate. For this assessment, it is assumed that all the manure application and tractor assets were purchased for manure distribution to simplify the calculation. In addition, it is estimated that the cost for building a slurry tank is about $17,000 more than the cost of a shallow flushed pit with an anaerobic lagoon for storage. This estimate accounts for the difference in concrete costs and dirt work needed for an under-building deep pit compared to an under-building shallow pit emptying to a lagoon. It does not account for the cost of flushing equipment for lagoons such as flush tanks, recycle pumps and piping.
In this analysis, return on assets was above 14 percent for all the scenarios considered (Table 2). Operations that do not control the large number of acres needed to maximize fertilizer value of manure will have difficulty obtaining these returns. Manure value and thus manure ROA is less on wean-finish than on grow-finish operations. The amount of nutrients fed on wean-finish operations is less because of the smaller initial size of the animals. Fewer nutrients fed results in reduced nutrients in the manure and lower manure value and ROA. For example, if Scenario 1 in Table 2 were converted to a wean-finish operation, ROA for slurry manure management would decrease from 18.1 percent to 12.9 percent.
Table 2
Financial attributes of three scenarios for managing manure on a 4,800-head grow-finish operation (with no wet-dry feeders).
| Attribute | Scenario 1 | Scenario 2 | Scenario 3 |
|---|---|---|---|
| Operation attributes | |||
| Cropping system | Corn (150 bushels)-soybean (50 bushels) rotation | Corn (150 bushels)-soybean (50 bushels) rotation | Fescue: 50 percent hay, 50 percent pasture |
| Manure application system | 6,000-gallon tractor-pulled spreader | Dragline | 6,000-gallon tractor-pulled spreader |
| Manure placement | Injection | Injection | Surface |
| Manure placement Injection Injection Surface | |||
| Manure net value (annual) | $35,175 | $42,834 | $25,895 |
| Assets | |||
| Storage cost above lagoon | $17,000 | $17,000 | $17,000 |
| Application equipment | $55,605 | $77,000 | $44,605 |
| Tractors | $166,300 | $223,600 | $166,300 |
| Total assets | $236,305 | $316,000 | $226,305 |
| Interest (annual) | |||
| Storage cost above lagoon | $595 | $595 | $595 |
| Application equipment | $1,946 | $2,695 | $1,561 |
| Tractors | $5,050 | $3,200 | $5,072 |
| Total interest | $7,591 | $6,490 | $7,228 |
| Return on assets | 18.1 percent | 15.6 percent | 14.6 percent |
Further considerations
How much manure?
Table 3 lists the nutrient concentrations for the swine diets used to calculate manure nutrient content of the wean-finish and grow-finish systems discussed in this guide. This guide assumes swine diets contain 500 phytase units (FTUs) per kilogram of feed and minimize inorganic phosphorus inclusion rates in grow-finish diets. Feeding phytase has allowed total phosphorus concentration in grow-finish diets to decline by more than 30 percent between 1995 and 2005.
Grow-finish hogs are relatively inefficient at using nutrients in feed. It can be assumed that they excrete 75 percent of the nutrients they consume. Total nutrients in the excreted manure are reported in Table 4. Diets with higher nutrient concentrations will have proportionally more nutrients in the manure. If diets on your farm use 30 percent more phosphorus than the diets in Table 3, then the manure on your farm will contain 30 percent more phosphorus than is estimated in Table 4.
Estimated manure volume is also reported in Table 4. Manure volume will vary between operations based on water additions to the manure storage. Factors such as type of animal drinking water system, the amount of feed wastage, the amount of water used for cleaning the buildings, and whether the manure storage is covered or uncovered influence manure volume. Wet-dry feeders reduce water use by the animals by 30 percent. The range of estimated volumes in Table 4 reflects operations with or without wet-dry feeders. Operations with uncovered storage facilities will have more or less volume than covered storages, depending on the net balance of rainfall to evaporation for the geographic location. Estimated manure nutrient concentrations are reported in Table 5 using the nutrient contents and manure volumes reported in Table 4.
All of these estimates are proportional to the number of animals for the specific type of operation. A 2,400-head grow-finish or wean-finish operation will have half the nutrient production and volume reported in Table 4.
Table 3
Crude protein, total phosphorus and total potassium concentration and daily intake in nursery, grower and finish pig diets.
| Ration | Crude protein percent | Total phosphorus percent | Total potassium percent | Daily intake (pounds per day) |
|---|---|---|---|---|
| Nursery 1 | 24.0 | 0.75 | 0.90 | 0.6 |
| Nursery 2 | 22.0 | 0.75 | 0.90 | 1.1 |
| Nursery 3 | 19.0 | 0.60 | 0.80 | 1.6 |
| Nursery 4 | 17.0 | 0.60 | 0.75 | 2.1 |
| Grower 1 | 16.0 | 0.45 | 0.65 | 3.9 |
| Grower 2 | 14.5 | 0.45 | 0.60 | 5.6 |
| Finish 1 | 13.0 | 0.35 | 0.55 | 6.2 |
| Finish 2 | 11.5 | 0.35 | 0.50 | 6.8 |
Table 4
Total nitrogen, plant-available nitrogen, phosphate and potash in excreted manure and manure volume.
| Operation | Total nitrogen, pounds | Plant-available nitrogen**, pounds | Total phosphate, pounds | Total potash, pounds | Manure volume, gallons |
|---|---|---|---|---|---|
| 4,800 wean-finish | 89,800 | 69,150 | 57,215 | 52,100 | 1,300,600 to 1,795,375 |
| 4,800 grow-finish | 120,665 | 92,910 | 75,450 | 68,665 | 1,756,075 to 2,433,600 |
**For injected manure.
Plant-available nitrogen was estimated as 77 percent of total nitrogen; see text for more information on how plant-available nitrogen was calculated.
Table 5
Estimated nutrient manure test results for slurry manure from a wean-finish and grow-finish operation.
| Feeder type | Total nitrogen, pounds per 1,000 gallons | Plant-available nitrogen***, pounds per 1,000 gallons | Total phosphate, pounds per 1,000 gallons | Total potash, pounds per 1,000 gallons |
|---|---|---|---|---|
| Standard | 50 | 39 | 32 | 29 |
| Wet-dry | 69 | 53 | 43 | 40 |
***For injected manure.
How much land?
Crop nutrient demand depends in large part on the crop grown and the productivity of the field. In this analysis, crop phosphate and potash needs were based on the nutrient removal capacity of the crop, and nitrogen need was based on MU recommendations. Table 6 summarizes nutrient removal for corn, soybean and fescue for selected yield goals.
Manure phosphate and potash were assumed to be 100 percent available and equal to commercial fertilizer sources. Slurry manure was assumed to be 30 percent organic nitrogen. Nitrogen availability was calculated using the Missouri Department of Natural Resources' plant-available nitrogen (PAN) equation. A first-year organic nitrogen availability factor of 35 percent was used. A factor of 95 percent for availability of inorganic nitrogen was used for injected manure and 60 percent for surface-applied manure. This resulted in 77 percent of total nitrogen having fertilizer value in injected manure and 55 percent of the nitrogen having value in surface-applied manure.
Table 7 summarizes land needs for selected corn-soybean rotations and fescue systems associated with 4,800-head wean-finish or grow-finish operations. To adjust these numbers for operations of other sizes, multiply the acres by the appropriate fraction or multiply the animals per acre by the appropriate number of animals.
Table 6
Maintenance nutrient requirements of corn and soybeans for selected yield goals.
| Crop | Yield goal | Recommended nitrogen****, pounds per acre | Phosphate removal, pounds per acre | Potash removal, pounds per acre |
|---|---|---|---|---|
| Corn | 130 bushels per acre | 145 | 60 | 40 |
| Corn | 150 bushels per acre | 175 | 70 | 45 |
| Corn | 170 bushels per acre | 205 | 75 | 50 |
| Soybean | 40 bushels per acre | 0 | 35 | 60 |
| Soybean | 50 bushels per acre | 0 | 40 | 70 |
| Soybean | 60 bushels per acre | 0 | 50 | 85 |
| Fescue hay | 4 tons per acre | 160 | 36 | 144 |
| Fescue pasture | 4 tons per acre | 160 | 12 | 48 |
****Nitrogen recommendation for corn should be reduced 30 pounds per acre when corn follows soybean.
Table 7
Land needs for 4,800-head slurry-based wean-finish and grow-finish hog operations for selected cropping systems; all applications are approximately P balanced. Manure applied to meet nitrogen needs in corn in corn-bean rotations.
| Crop (yield goal) | 4,800-head wean-finish acres (animals per acre) | 4,800-head grow-finish acres (animals per acre) |
|---|---|---|
| Corn (130 bushels per acre)-Bean (40 (bushels per acre) | 1,205 (4.0) | 1,620 (3.0) |
| Corn (150 bushels per acre)-Bean (50 (bushels per acre) | 955 (5.0) | 1,285 (3.7) |
| Corn (170 bushels per acre)-Bean (60 (bushels per acre) | 790 (6.1) | 1,062 (4.5) |
| Fescue hay | 1,590 (3.0) | 2,095 (2.3) |
| Fescue pasture-hay mix | 2,290 (2.1) | 3,020 (1.6) |
| Fescue pasture | 4,770 (1.0) | 6,290 (0.8) |
Example
How much land is needed for a 2,400-head wean-finish operation applying manure to a corn-soybean rotation once every two years on land that has yield goals of 150 bushels of corn and 50 bushels of soybeans per acre?
Using the data in Table 7, there are two options.
Option 1
(2,400/4,800) x 955 acres = 478 acres
Option 2
2,400 head/5 animals per acre = 480 acres
In this example, about 480 acres of land are needed for a 2,400-head wean-finish operation.
Manure application equipment
Table 8 summarizes the equipment complement used for the three application systems considered in this guide.
Table 8
Equipment complement used for land application of manure.
| System | Scenario 1 | Scenario 2 | Scenario 3 |
|---|---|---|---|
| Operation attributes | |||
| Cropping system | Corn (150 bushels)-soybean (50 bushels) rotation | Corn (150 bushels)-soybean (50 bushels) rotation | Fescue: 50 percent hay, 50 percent pasture |
| Manure application system | 6,000-gallon tractor-pulled spreader | Dragline | 6,000-gallon tractor-pulled spreader |
| Manure placement | Injection | Injection | Surface |
| Equipment | |||
| Power | 225-hp tractor 130-hp pump tractor |
225-hp tractor 130-hp pump tractor 105-hp utility tractor |
225-hp tractor 130-hp pump tractor |
| Application equipment | 2,200 gpm agitation pump 6,000-gallon tanker 15-foot injection toolbar |
2,200 gpm agitation pump 15-foot injection toolbar 2 660-foot dragline hoses 14 660-foot delivery hoses 2 hose reels |
2,200 gpm agitation pump 6,000-gallon tanker |