Lagoons can be an effective means of treating and storing flushed manure and providing a holding basin for recycling water. A lagoon is a key component to a successful flush dairy. If the lagoon is properly designed and built, many years can go by without any significant maintenance requirements to the system outside of water management, pumps, and valves. Water management, in this context, consists of pumping liquid supernatant from the lagoon to be spread on fields as supplemental crop fertilizer. Depending on rainfall, drawdown (pumping) of the lagoon may be needed one or more times per year to manage the water inventory.
Below the liquid layer is a blanket of settled solids. A portion of these solids is digested by microbes over time. Since some of the solids are not degradable, a build-up of solids is expected over time. The design of lagoons should account for additional lagoon volume for solids storage. It may take five, ten, or twenty years, but the water holding capacity of the lagoon will become diminished to a point where normal operation is affected.
The operator of the manure system can continue operating the lagoon with diminished capacity for some time by drawing down the liquid level more frequently. However, the longer this continues, the more likely the drawdown will have to occur during times that are not ideal, possibly even when prohibited, such as when the ground is frozen or saturated. Water topping the lagoon is another possibility, which can in turn, lead to berm failure.
Pumping the solids out of the lagoon can be resource-intensive, requiring specialized equipment with trained operators, seasonal planning, and suitable land to which solids can be applied. Sometimes finding suitable land can be the most challenging aspect to overcome. Manure slurry is heavy and expensive to transport, so the land application must be as close to the lagoon as possible. Crop cover and rotation, crop yield and nutrient uptake, weather, and current nutrient concentrations in the soil are other aspects to consider.
The purpose of this case study is to highlight some of the aspects involved with a recent solids removal effort at a flush dairy lagoon in central Missouri. A contractor specializing in lagoon agitation, pumping, and land application was hired to complete the project. The effort was so extensive that the dairy’s managers decided to install a coarse-solids removal system to reduce the amount of non- and slowly degradable solids that entered the lagoon.
Background
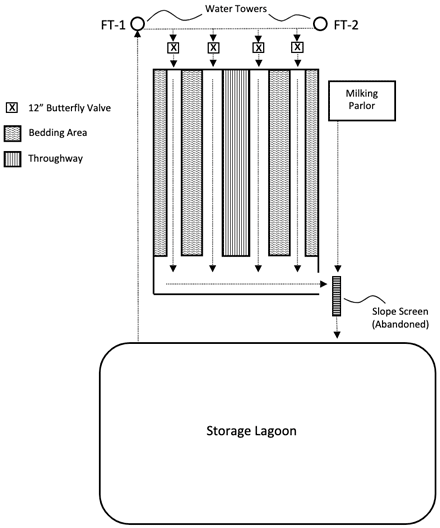
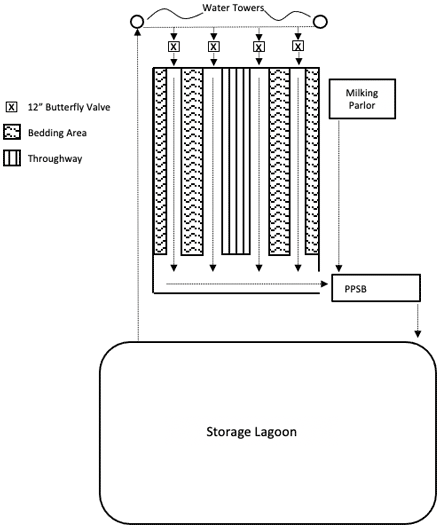
FM Dairy is located in Boone County, Missouri, and is home to a herd of 140–160 lactating cows. The dairy used mattress bedding with supplemental cedar shavings (89 cubic feet per day) in a freestall barn, the layout of which is shown in Figure 1.
The 100-foot by 200-foot freestall barn had four flush alleys. The alleys were served by two flush water towers that were each approximately 14,000 gallons. The barn was flushed two to three times per day, with three times per day being typical. Greater detail provided by the operators revealed the dairy may flush as much as four times per day; morning flush, then scrape, then flush again, followed by flushing around noon and again in the evening. The milking parlor and holding pen were also flushed to the lagoon, but the water contribution was only 2 percent of the total daily flush water usage.
A 5-horsepower submersible pump was used to send water from the lagoon to Flush Tower 1 (FT-1). Flush Tower 2 (FT-2) was filled by gravity from FT-1. Pump operation was controlled by a pressure switch in FT-1. The 28,000-gallon total capacity allowed all four lanes to be flushed at once (i.e., 3,500 gallons per flush per lane). However, the operational standard dictated those lanes be flushed sequentially. Each lane had its own 12-inch valve. Two of the lanes had buried pipes with mechanically actuated valves. The other two lanes had pop-up valves: one being manual and one being pneumatic. Farm staff walked the line of valves, opening and closing each valve one at a time. The time each valve allowed to remain open was highly subjective.
There was, at one time, an elevated screen that helped remove the large solids from the flush, but the screen fell into disrepair several years ago and was abandoned. When operable, farm staff would wait thirty minutes between lane flushes so as not to overwhelm the screen. The elevated screen was seen as problematic since the sand and grit that was carried in would eat away at the metal. There was also a sense that the screen required significant maintenance.
It had been approximately twenty years as of the time of this writing since solids have been effectively removed from the lagoon at FM dairy. Solids accumulation had become so great that, by 2020, islands of solids could be seen in the middle of the lagoon. The operational capacity of the lagoon had been decreased to the point that the manure flushing system was nearly inoperable.
Solids removal and land application
The solids removal and application process should begin with an estimate of the volume of solids and the mass of nutrients needed to be removed and land applied. The mass of nutrients must be calculated to understand the amount of land needed for application and if hauling a portion of the slurry away will be required. Lastly, contracting with a firm may be needed due to specialized equipment requirements.
Estimating the mass of solids and nutrients
Several companies with specialized equipment and training were contacted for estimates removing the lagoon solids. The primary expense factors for solids removal include (a) the number of gallons pumped and (b) the distance between the lagoon and the location where the solids are deposited. Often there is a small window of opportunity for the land application of solids in the spring, prior to crops being planted, and in the fall, between post-harvest and frost. Delays can occur if rain or snowmelt causes the ground to be saturated. The first step was to gather information on the lagoon and its contents so that specialized contractors could provide accurate proposals.
The lagoon at FM Dairy was oblong with curved ends (approximately 400 ft x 280 ft, LxW), which means the exact dimensions are difficult to determine without extensive land surveying. There were no “as-built” plans available that would indicate precise length, width, side slope, or depth. The manager believed the depth of the lagoon to be 10 to 12 feet. It is common to have a slide slope of approximately 3-to-1, which is often the maximum slope allowed to maintain berm integrity while minimizing the footprint. Dimensions could be estimated from an online satellite view even though they were not exact. Contractors use these essential characteristics to estimate the volume of the lagoon (FM Dairy lagoon was estimated to be 7.5 million gallons). However, the cost of the project is determined by the volume of sludge pumped or dredged, which means sludge inventory is important for an accurate estimate.
A sludge survey is needed to determine solids depth, volume, and nutrient content. These factors will play an important role in both costs of removal and land requirements for application. There are several methods to accomplish a sludge survey, and Mahmoud Sharara does an excellent job of detailing methods and procedures in a 2020 paper entitled “Sludge Survey Methods for Anaerobic Lagoons.” (Sharara 2020)
The sludge survey at FM Dairy was unable to be fully executed. Surveyors discovered the sludge blanket in the lagoon was so high that the boat would get stuck as soon as it was placed in the water. This made an estimation of the solids volume relatively easy insomuch as it was approximately equal to the volume of the lagoon. However, that was not equivalent to the volume of solids that needed to be pumped from the lagoon due to the solids concentration. Two samples were taken with a heavy-duty sludge judge that was constructed onsite and sent to the lab for analysis. Table 1 shows the results of that analysis. The moisture content was approximately 87% between the two samples, equating to 13 percent solids content. This solids concentration is in agreement with Sharara, who, in the 2020 paper noted above, suggested sludge could be approximately 14% solids. The contractor however indicated that they liked to pump a solids concentration of 5–8 percent and would use water from a nearby pond to dilute the lagoon solids. Therefore, the farm manager must understand the details and caveats of the land application contract to do proper budgeting. FM Dairy would have had to pump, and land apply nearly 15 million gallons under this scenario, rather than the 7.5 million gallons of lagoon volume. They opted to not completely remove all the solids from the lagoon, applying 8.05 million gallons. A lagoon volume of 7.5 million gallons full of sludge with a 13% solids content results in an estimated overall solids mass of 815,000 pounds. The contractor pumped approximately 472,000 pounds of solids, leaving roughly 35% of the original mass of solids in the lagoon.
As seen in Table 1, the nutrient content of the lagoon solids was also returned with the lab analysis. The concentration of nutrients can vary significantly between samples. It may be prudent to look at the maximum value returned among the samples when planning the amount of land required for application. Samples can, and should, be taken during the land application process to track the mass of nutrients being applied and the solids content in the slurry. Dilution of the solids will also reduce nutrient concentrations. For example, the undiluted nitrogen concentration might be 25 pounds per thousand gallons, but the diluted concentration (from 13 percent to 6.5 percent) would be 12.5 pounds per thousand gallons. Lastly, it is worth noting that the actual mass of phosphorous is approximately 44% of P2O5. In other words, 30 pounds of P2O5 is equivalent to 13 pounds of phosphorous. Similarly, potassium is 83% of K2O.
Table 1. Nutrient analysis of lagoon solids.
| Nutrient | 28-Apr-20 | 12-May-20 | |
|---|---|---|---|
| Nitrogen (N) | ppm | 3041 | 2396 |
| lb/1000 gal | 25.3 | 20 | |
| Ammonium (NH4+-N) | ppm | 485 | 505 |
| Phosphorus (P) | ppm | 1591 | 1149 |
| lb P2O5/1000 gal | 30.4 | 21.9 | |
| lb P/1000 gal | 13.4 | 9.6 | |
| Potassium (K) | ppm | 1009 | 994 |
| lb K2O/1000 gal | 10.1 | 9.93 | |
| lb K/1000 gal | 8.4 | 8.2 | |
| Moisture | % | 86.1 | 87.9 |
| pH | 7.89 | 7.44 | |
Lagoon agitation and land application
Solids in the lagoon at FM Dairy were agitated and pumped out from May 21, 2020 through June 8, 2020. Precision Pumping (Quincy, IL) was contracted to apply a total of 8 million gallons over 280 acres, averaging approximately 29,000 gallons per acre.
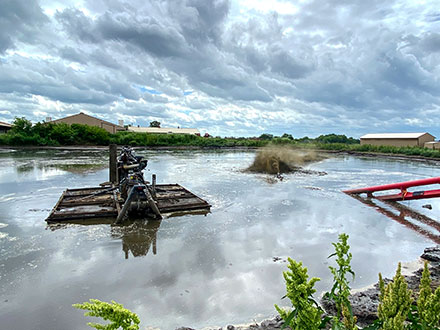
The process began by agitating from the shore using two 8-inch lagoon agitators (NUHN, Sebringville, ON, Canada) (Figure 2) connected to two tractors (John Deere, Moline, IL), including an 8100 160 PTO hp using 9 gallons of diesel per hour and an 8295R 242 PTO hp using 13 gallons of diesel per hour.
The agitators require a minimum of 95 hp to produce a maximum flow of 8,000 gallons per minute. As seen in Figure 2, these agitators began operation by breaking up the surface solids using a high-powered jet as they were moved to different locations around the lagoon.
They were set up on opposite corners of the lagoon to create a circular flow within the lagoon once the initial surface agitation was complete. The discharge jets were then lowered into the water to create a circular mixing pattern in the lagoon to keep solids in suspension.
An agitation boat (2067C, Puck Enterprises, Manning, IA) was used once the two agitators had sheared off enough of the upper solids blanket to allow for the boat’s draft (Figure 2). The boat is powered by a 6.8L, 275 hp John Deere engine that consumes 5–6.5 gallons of diesel per hour. It operates a Cornell pump with a 17-inch impeller that feeds 3 guns with a total of 4,000 gallons per minute at 30 psi. These guns provide jet propulsion for the boat and break up the solids blanket below the boat. The boat is remote-controlled with an optional GPS setting to allow for line-of-sight operation and automated hands-free operation if chosen.
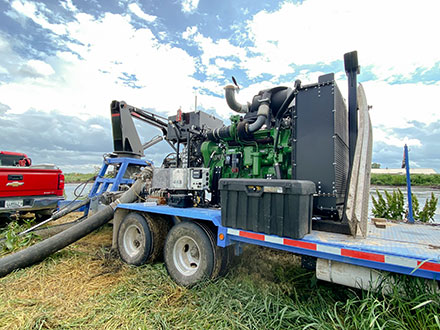
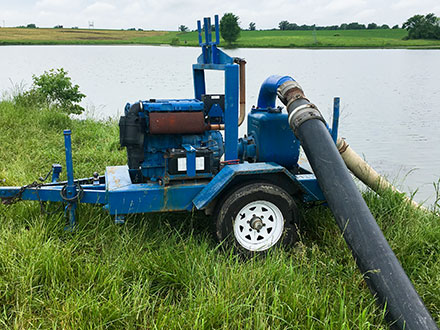
A Zoske (Iowa Falls, IA) pump trailer (Figure 3) was used to deliver the agitated lagoon effluent to the injection sites through an 8-inch, 200 psi hose. The pump trailer consists of a Cornell centrifugal pump powered by a John Deere motor.
An Atlas Copco (Rock Hill, SC) compressor was set adjacent to the pump trailer to provide compressed air to unclog the discharge line if needed. Note the “Y” in the discharge line in Figure 4 with a compressed air line attached to one branch. The pump trailer intake line (Figure 4) was then suspended in the lagoon using a boom that is attached to the pump trailer.
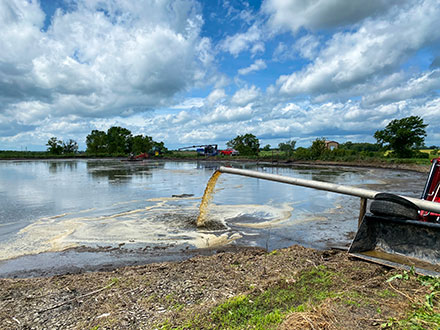
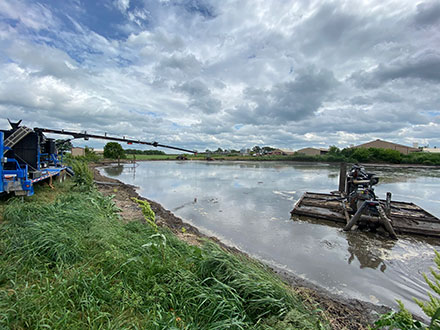
Two additional pumps supported the operation: the dilution and booster pumps. The dilution pump, consisting of a Thompson (Port Orange, FL) centrifugal pump mounted on a 60 hp KHD Deutz (Deutz, Norcross, GA) motor, was used to pump fresh water from two nearby ponds into the lagoon (Figure 5).
The exact amount of dilution water used is unknown. The contractor reported optimal pumping conditions to occur when the slurry is approximately 5 to 8 percent solids. The initial slurry had a 10–13 percent solids content, so a significant amount of dilution water was needed to dilute the solids content to the target range. The contractor had to continually balance the flow of dilution water with the speed of the agitation boat to hit the target solids content. Too high of a solids content could clog hoses and injectors, while too low a solids content would result in inefficient operation.
The booster pump, consisting of a Smart Turner (Brantford, Ontario, Canada) centrifugal pump paired with a John Deere engine (Figure 6), was used to maintain a flowrate over 1,800 gallons per minute through the drag hose, which was reduced from 8-inch to 6-inch immediately after the booster pump.
A toolbar (Hydro Engineering, Norwood Young America, MN) with 13 Dierich shanks on 24-inch centers was used for manure injection. The toolbar was mounted to a John Deere tractor (8320R, 263 PTO hp using 15 gallons of diesel per hour), as seen in Figure 6.
The injection equipment was supported by a John Deere (8285R with 239 PTO hp using 15 gallons of diesel per hour fuel use) that used a Zoske Open Spool Hose Humper to feed the drag line from a Zoske Raptor 32 Hose Cart (Figure 6). The hose cart has a capacity of either 16 sections of 8-inch hose in 660-foot lengths or 32 sections of 6-inch hose in 660-foot lengths and is capable of layout speeds up to 10 miles per hour when the spool is under power.
The agitation process began on May 21, and a relatively small volume of the slurry was land applied (0.18 million gallons). The majority of volume was land applied on May 22 (1.5 million gallons), May 23 (0.79 million gallons), May 26 (0.97 million gallons), May 27 (0.82 million gallons), June 1 (0.87 million gallons), June 2 (1.5 million gallons) and June 3 (1.4 million gallons). A nominal volume (14,000 gallons) was applied on June 8 as part of the clean-up process after several days of inclement weather prevented further application. Daily samples were taken from the pump trailer discharge on six of the seven days that significant volume was applied (Table 2). It should be noted that the application did not occur over the Memorial Day weekend (5/23–5/25) or the following weekend (5/30–5/31) and neither on 5/28 nor 5/29 due to inclement weather.
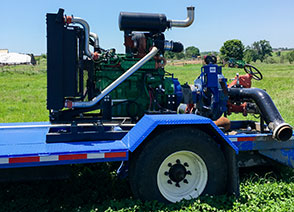
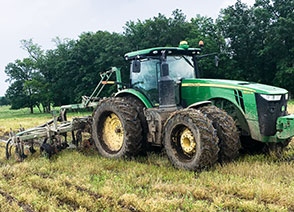
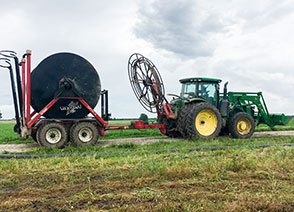
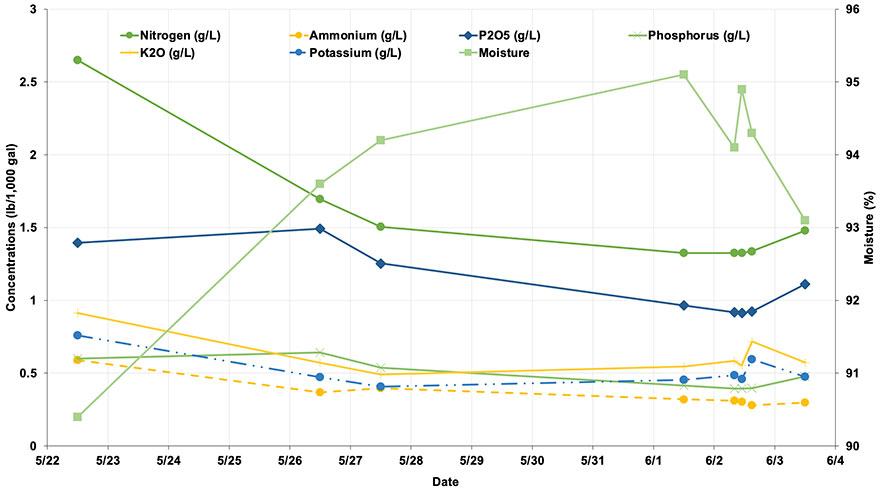
Table 2 displays a general pattern of decreasing concentration as moisture content increases from May 22 through June 1. Nutrient concentration increases after June 1 as the moisture content decreases (i.e., solids concentration becomes less dilute). A lower nutrient concentration between days with similar moisture contents (e.g., 5/27 vs. 6/2) can be explained by solids coming from a lower stratum in the solids blanket on the later date, meaning the solids are older and more thoroughly digested than the solids in the upper stratum.
Table 2. Land application sample analysis.
| Nutrient | 22-May | 26-May | 27-May | 1-Jun | 2-Jun | 3-Jun | |
|---|---|---|---|---|---|---|---|
| Nitrogen (N) | g/L | 2.7 | 1.7 | 1.5 | 1.3 | 1.3 | 1.5 |
| lb/1000 gal | 22 | 14 | 13 | 11 | 11 | 12 | |
| Ammonium-Nitrogen (NH4+-N) |
g/L | 0.59 | 0.37 | 0.4 | 0.29 | 0.3 | 0.3 |
| lb/1000 gal | 4.9 | 3.1 | 3.3 | 2.4 | 2.5 | 2.5 | |
| P2O5 | g/L | 1.4 | 1.5 | 1.3 | 0.87 | 0.92 | 1.1 |
| lb/1000 gal | 12 | 13 | 11 | 7.3 | 7.7 | 9.3 | |
| Phosphorous (P) | g/L | 0.6 | 0.64 | 0.54 | 0.37 | 0.39 | 0.48 |
| lb/1000 gal | 5 | 5.4 | 4.5 | 3.1 | 3.3 | 4 | |
| K2O | g/L | 0.91 | 0.57 | 0.49 | 0.72 | 0.62 | 0.57 |
| lb/1000 gal | 7.7 | 4.8 | 4.1 | 6 | 5.2 | 4.8 | |
| Potassium (K) | g/L | 0.76 | 0.47 | 0.41 | 0.6 | 0.51 | 0.48 |
| lb/1000 gal | 6.4 | 4 | 3.4 | 5 | 4.3 | 4 | |
| Moisture | % | 90 | 94 | 94 | 96 | 94 | 93 |
| pH | 7.6 | 8 | 7.7 | 7.6 | 7.7 | 7.7 | |
Multiple samples were taken throughout the day on June 2 to gauge the consistency of nutrient concentrations. Table 3 displays the samples taken at 8 am, 11 am, and 2 pm. The average, standard deviation, and coefficient of variation (percentage of standard deviation relative to the average) are shown for concentrations of nutrients, moisture, and pH. Mass per volume averages are not shown because they are related to the concentrations. Nitrogen, phosphorous, moisture, and pH are all consistent, with statistically significant variation being less than 1% of the average. Ammonium was somewhat variable, with approximately 6% of the average variation. Potassium is even more variable, with the variation being 14% of the average. While the cause of greater variation of ammonium and potassium is not clear, it does appear that the key nutrients of concern are being applied at a relatively consistent concentration throughout the day. This would seem to suggest that, once completely mixed via agitation, the applied nutrient concentration from a single sample is a reliable estimate within a working day if the moisture content is consistent.
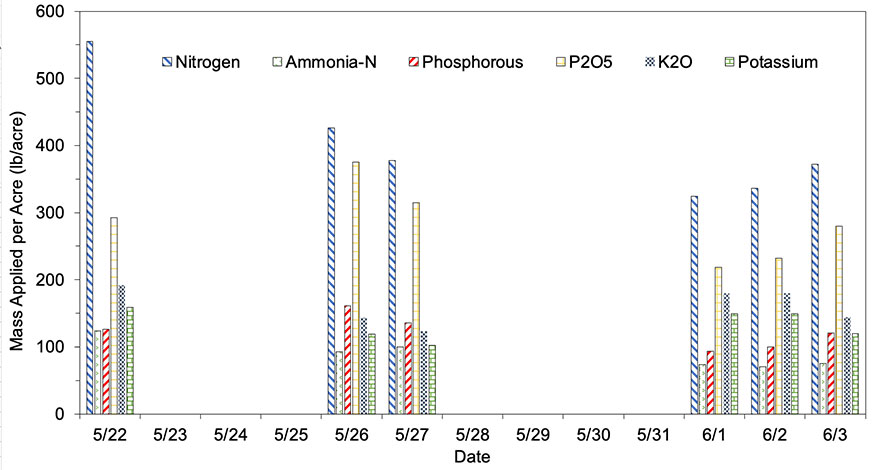
The soil had been tested for existing nutrient content within three years of land application discussed herein. GPS and application flow data were combined by software made available by John Deere, the output of which was provided to the farm to show how many gallons of slurry had been applied to each acre. It is worth noting that publishing limitations on image resolution prevented us from sharing those maps in this case study. Extension used the sample concentrations noted in Figure 7 to produce the mass application table displayed in Figure 8.
In all, solids were applied to over 220 acres, with the furthest being 8,200 feet, or over 1.5 miles, from the lagoon. The application rate of solids was not a function of the distance pumped. In fact, fields furthest from the lagoon saw solids applied at the greatest rate (28,000 gallons per acre), whereas the overall average was approximately 24,000 gallons per acre.
Table 3. Nutrients of multiple samples taken on same land application day, June 2, 2021.
| Nutrient | 8:00 AM | 11:00 AM | 2:00 PM | Average | Standard deviation | Percent variance | |
|---|---|---|---|---|---|---|---|
| Nitrogen (N) | g/L | 1.3 | 1.3 | 1.3 | 1.3 | 0 | 0 |
| lb/1000 gal | 11 | 11 | 11 | 11 | 0 | 0 | |
| Ammonium (NH4+-N) | g/L | 0.31 | 0.3 | 0.29 | 0.3 | 0.01 | 3.3 |
| lb/1000 gal | 2.6 | 2.5 | 2.3 | 2.5 | 0.15 | 6.2 | |
| Phosphorus (P) | g- P2O5/L | 0.92 | 0.91 | 0.92 | 0.92 | 0.006 | 0.63 |
| Lb-P2O5/1000 gal | 7.7 | 7.7 | 7.7 | 7.7 | 0 | 0 | |
| g-P/L | 0.4 | 0.39 | 0.4 | 0.39 | 0.003 | 0.63 | |
| lb-P/1000 gal | 3.3 | 3.3 | 3.3 | 3.3 | 0 | 0 | |
| Potassium (K) | g-K2O/L | 0.58 | 0.55 | 0.72 | 0.62 | 0.091 | 15 |
| lb K2O/1000 gal | 4.9 | 4.6 | 6 | 5.2 | 0.74 | 14 | |
| g-K/L | 0.48 | 0.46 | 0.6 | 0.51 | 0.08 | 15 | |
| lb-K/1000 gal | 4.1 | 3.8 | 5 | 4.3 | 0.62 | 15 | |
| Moisture | % | 94 | 95 | 94 | 94 | 0.58 | 0.61 |
| pH | 7.8 | 7.8 | 7.6 | 7.7 | 0.12 | 1.5 | |
Construction of a pull-plug sedimentation basin for solids separation
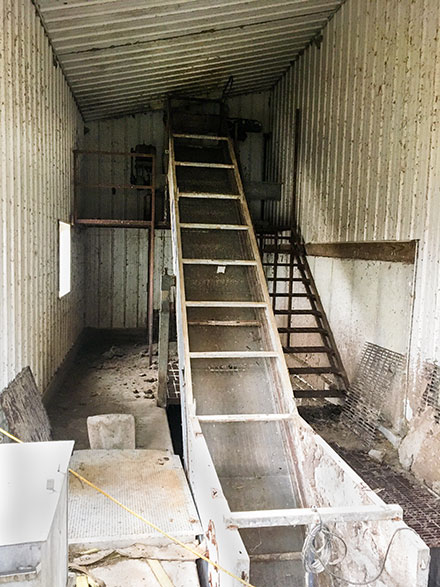
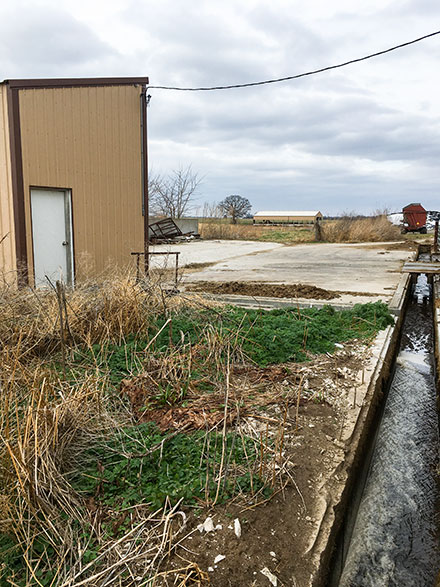
The manure flush system at FM Dairy had been discharging directly into the lagoon for a few years prior to the clean-out. The Dairy operated an inclined conveyor manure separator with a PVC paddle for manure separation. The separator system was installed in a small enclosure (Figure 9) with an auger that conveyed solids to a drying pad for drying and storage. The manure separation was halted when the unit fell into disrepair, and the lagoon has since been receiving most of the manure solids and woodchips from the freestall barn.
The additional solids load on the lagoon caused it to lose capacity more quickly than it was designed for. Farm management evaluated several liquid/solids separation options, including a new elevated screen, a weeping wall, and Pull-Plug Sedimentation Basin (PPSB).
The Dairy evaluated the potential technologies based on historical experience and first-person interviews. Replacing the slope screen was ruled out because of cost (both capital and O&M) and historical difficulties with degradation due to sand and grit in the flush water. The weeping wall was more thoroughly reviewed but ultimately not chosen due to concerns of clogging of the wall and associated maintenance as conveyed by a dairy farmer who has operated a weeping wall for some time. The PPSB was selected after reviewing cost and visiting with a farmer who operated a PPSB and was satisfied with the overall operation and performance (Canter et al., 2020).
The Dairy worked with USDA NRCS to develop layout plans for the site. The collection gutter for flush water and the slope screen building were demolished, and the site was reconfigured, as seen in Figure 10.
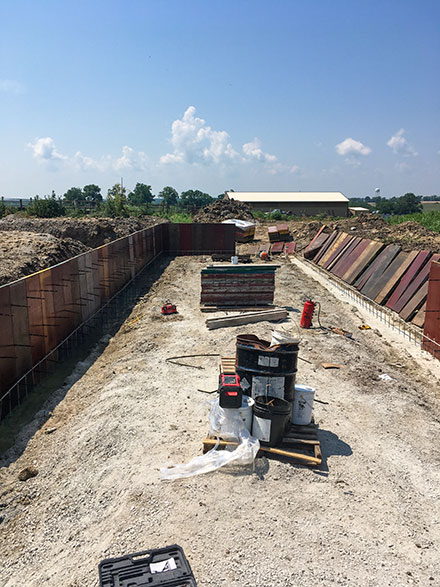
Construction began by grinding down the existing drying pad, filling in the flush collection trough, and completing the earthwork for the PPSB (Figure 10). One of the most considerable challenges of installing the PPSB was managing the hydraulic grade line of the flush water from the end of the freestall to the lagoon. Great care was taken to eliminate pooling as much as possible, hence the need to grind down the existing concrete drying pad.
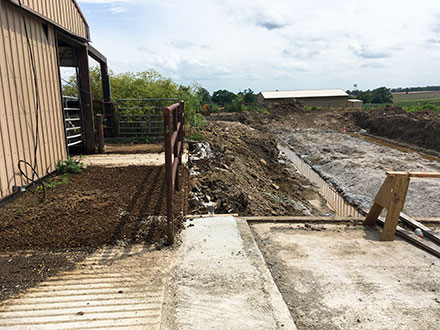
Figure 11 shows the freestall barn to the left. The edge of the freestall flush is in the foreground. The flush alley from the holding pen and milking parlor can be seen in the background on the left. This PPSB was designed to allow flush water from the pen and parlor to cascade over the vertical wall near the maintenance ramp, although it is recommended that all flush water enter the PPSB by flowing down the maintenance ramp. Existing grade limitations made this design exception necessary. The old flush collection trough can be seen filled in with white concrete in the foreground and demolished in the background just past the red iron fence. The drying pad in the foreground on the right has been ground down to allow flush water to be funneled down the maintenance ramp to the PPSB, which is in the background on the right. The drainpipe for the PPSB can be seen in the far-right background as a white PVC pipe with red marking. The footings for the PPSB were poured and wall forms set once the site dried, as seen in Figure 12.
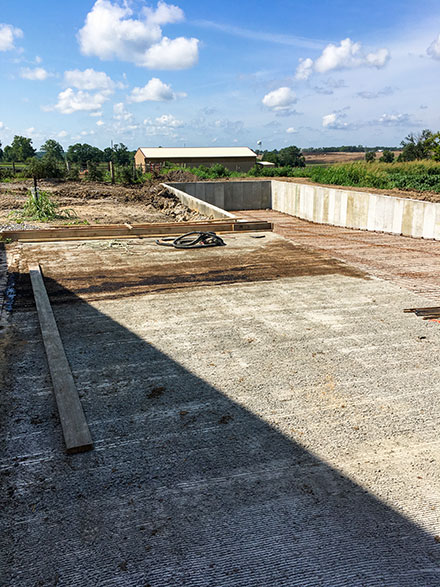
The top photo in Figure 12 shows the PPSB further along in construction with a new upper pad poured and grooved, PPSB walls set, and the rebar reinforcement for the floor in place. The upper pad had been grooved to provide better traction in wet and especially icy conditions. A 6-inch form for a curb can be seen in the background on the left side. This curb helps direct the flush water to the PPSB. The grade of the maintenance ramp on the bottom side of Figure 12 is made evident by the increasing height of the wall from the foreground to the background. The 8-inch PVC slip joint for the discharge pipe can be seen in the back-right corner of the PPSB. The PPSB was put into operation as soon as the floor was dry. The operators of FM Dairy had been scraping manure and keeping most of their herd in pasture during the four weeks of PPSB construction, which represented greater labor on their part.
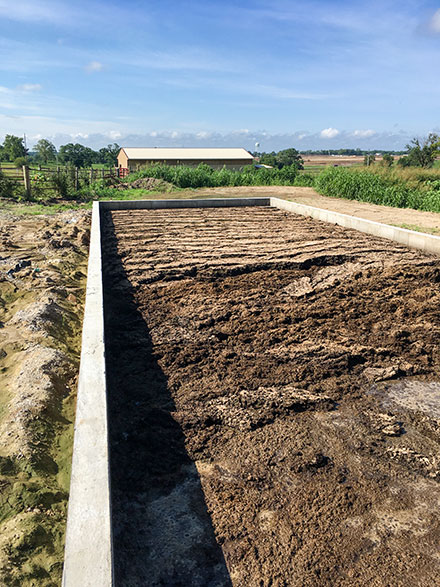
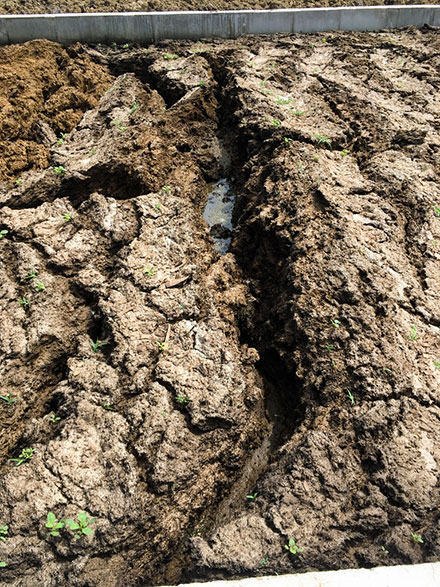
The fiber bedding of cedar shavings at FM Dairy quickly forms a dense mat in the PPSB, Figure 13. The dense mat results in standing water on the maintenance ramp, which was not seen at other installations that utilized sand bedding with a sand lane prior to the PPSB. This would seem to indicate that consideration should be taken for bedding type and pre-treatment even if fiber bedding is used.
The flush water from the pen and parlor keeps the elevated pad relatively clean. There is some build-up of manure in the section before PPSB that results from a non-flushed section between the freestall alley and the pen/parlor alley. There is an obvious difference between the older mat in the background and the newer mat in the foreground, Figure 13. The older mat is dryer and displays evidence of significant upheaval and compaction/expansion, as evidenced by large cracks. The physical characteristics of the mat suggest a high hydraulic loading rate on the system. Mats from other installations did not exhibit the same degree of undulation. A comparison can be made between FM Dairy and BR Dairy (see MU Extension publication EQ302, Considerations of Pull-Plug Sedimentation Basin for Dairy Manure Management), which had a relatively smooth mat across its surface. Table 4 shows the hydraulic load comparison between the two PPSBs.
Table 4. Comparison of hydraulic loading between FM dairy and BR dairy.
| Dairy | Surface area loading (gallons per square foot) |
Linear loading (gallons per foot) |
Weir loading (gallons per foot) |
|---|---|---|---|
| BR dairy | 3.4 | 350 | 3,300 |
| FM dairy | 12.0 | 1,200 | 13,000 |
Conclusion
Manure management is a burden for all animal feeding operations, which can potentially become a significant threat to the profitability and management of farms if not proactively managed. Sludge surveys of the lagoon prior to solids pumping can help reduce costly budget overruns by providing the owner and the contractor with an estimate of the volume of slurry and amount of solids and nutrients that must be removed from the lagoon. Owners would be well-advised to survey their lagoon yearly to track solid inventory and plan ahead for the amount of land needed for solids application. Proper solids removal from the lagoon, particularly if regular and effective solids removal has been neglected, requires specialized equipment above and beyond that which is required to reduce liquid supernatant on an annual or semiannual basis. Planning ahead will help the overall operation and avoid unnecessary expenses. There can be significant variability of nutrient concentration and resulting mass applied. Testing for nutrient concentrations in the lagoon, whether supernatant or sludge, or both, can be misleading due to variance in concentrations due to moisture content as the applicators dilute and concentrate the solids during the land application process. Daily sampling during land application could help but may not be practical due to the analysis time generally required by labs (5–10 business days). Bench-scale analyzers by companies such as Hach can return values within an hour but require the use of chemical reagents. Sensors and probes are available that return instantaneous values and have been used in municipal and industrial wastewater treatment for over a decade. Companies such as John Deere have integrated these types of sensors into land application equipment, combining them with their GPS and flow connection system to give a complete and accurate summary of nutrient application.
Simple, non-mechanical technologies are available for even small to midsize dairy farms to reduce the cost of lagoon maintenance by preventing the bulk of non-degradable solids from entering the lagoon. Implementation of a coarse solids separation system such as the PPSB could significantly reduce the long-term cost of manure management by allowing the operator to use more common equipment (e.g., a loader and spreader) to remove solids from the manure management system.
References
Canter, T., Lim, T.-T., Chockley, T. 2020. Considerations of Pull-Plug Sedimentation Basin for Dairy Manure Management. University of Missouri Extension. Retrieved Sept. 25, 2021.
Sharara, M. 2020. Sludge Survey Methods for Anaerobic Lagoons. Retrieved March 10,2022.
Reviewed by
Joseph Heywood Harrison, Professor, Nutrient Management Specialist, Washington State University
Gilbert Miito, Ph.D. Candidate, Washington State University