Many small dairy farms have limited practical and easy-to-operate options for manure management. A flush system for manure removal is attractive due to reduced chore time and increased barn cleanliness. However, flush systems require greater attention to onsite water management that result from having to store water with high nutrient and solids concentrations.
There are several different types of lagoons commonly employed for agricultural use. Lagoons designed for treatment and solids reduction via digestion can be aerobic or facultative/anaerobic. Anaerobic treatment lagoons can be ideal for many agricultural applications when it comes to water and manure management. The lagoon, typically 8–15 feet deep, provides some digestion of manure solids while serving as a holding basin when land application is not possible due to frozen ground or saturated soils. Storage lagoons are another type that aren’t designed for the purpose of solids reduction but, rather, for holding water or a water and solids slurry in order to better manage the on-farm water inventory. A portion of lagoon volume is designated for holding solids, regardless of the purpose or type of the lagoon. Solids removal prior to a lagoon may help increase lagoon capacity and reduce, if not eliminate, the need for costly lagoon dredging.
The pull-plug sedimentation basin (PPSB) is a passive solids removal system that can reduce the operational time and cost of the overall manure management system by acting as both a sedimentation basin and pre-lagoon solids filter system. Larger, denser particles (e.g., gravel, grit, and sand) accumulate on the basin floor, while buoyant particles (e.g., undigested fiber, waste forage, bedding, etc.) form a floating mat on the surface. The mat acts as a natural filter and allows the PPSB to retain up to 90% of the solids from the waste stream.
The PPSB is installed between the flushed freestall barn and the lagoon, as seen in Figure 1. Figure 1 shows one of several possible arrangements of a PPSB relative to the overall facility. Various configurations are discussed in the Design Considerations section. A sand settling lane can be integrated into the design between the freestall barn and the PPSB if needed.
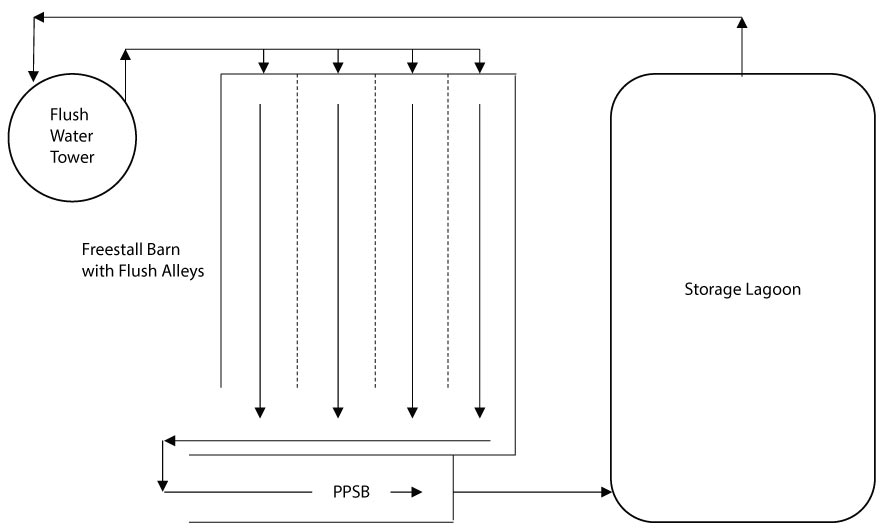
Figure 1. Placement of a PPSB within the flush system on a dairy farm (drawing not to scale).
Advantages of a pull-plug sedimentation basin
- May reduce lagoon volume, resulting in lower lagoon capital cost.
- Provides dewatering of fibrous material, possibly easing transport and reducing land application cost.
- Operational cost may be reduced by extending the timeframe between, if not altogether eliminating, lagoon solids removal.
- Less prone to clogging than weeping walls/picket dams.
- Generally less costly than mechanical options, especially for small- to medium-sized operations.
Disadvantages of a pull-plug sedimentation basin
- A low fiber concentration in the flush water may negatively affect performance; feed ration and bedding material should be considered.
- Weather, especially extended cold periods, may decrease performance and cause operational issues.
- Early standpipe plug removal may result in clogging of pipes and/or lagoon solids overload.
- Basin may allow passage of buoyant/floating solids prior to mat formation.
- The technology may be size/cost-prohibitive for larger operations.
Requirements for success
- A ration consisting of at least 55 percent forage, or fiber bedding, is necessary for mat development. Coarse forage is preferred.
- Flow into the basin should be directed down the service ramp for optimal performance. Water that is allowed to cascade over the curb and into the basin creates too much turbulence for proper blanket formation and operation.
- The PPSB should be operated until the layer of settled solids (accumulates from the bottom up) contacts the layer of floating solids (accumulates from the top down). Cleaning should occur when this interface forms.
- Some operators have opted to not pull the drain plug prior to cleaning to avoid potential clogging of the pipe to the lagoon. They concluded that the additional liquid content in the accumulated solids does not significantly impact cleaning time of the PPSB.
- Run-off diverted through the PPSB will not affect performance as long as it enters at the same location as the flush water. The decision to direct run-off through the PPSB or directly to the lagoon should be based on expected solids content of the run-off and the cost of construction.
Design considerations
Critical design considerations for the PPSB include hydraulic loading, location of the pull-plug location, construction details and design of the pull-plug itself.
Loading
The orientation of the PPSB relative to water flow is very important. Flush water should enter the PPSB at the high end of the service ramp to minimize the turbulence created in the basin during the flush cycle. Figure 2 shows two potential orientations of the PPSB for water loading.
The PPSB can be orientated parallel or perpendicular to the flush water flow, as seen in Figure 2. Site restrictions and relative cost will dictate the best option. Flush water that is loaded parallel to the flush flow direction (left diagram, Figure 2) will require grading to create a funnel in order to guide the water to the service ramp. A perpendicular orientation (right diagram, Figure 2) will require the curb height to be sufficient to prevent the flush water from cascading over the side of the PPSB.
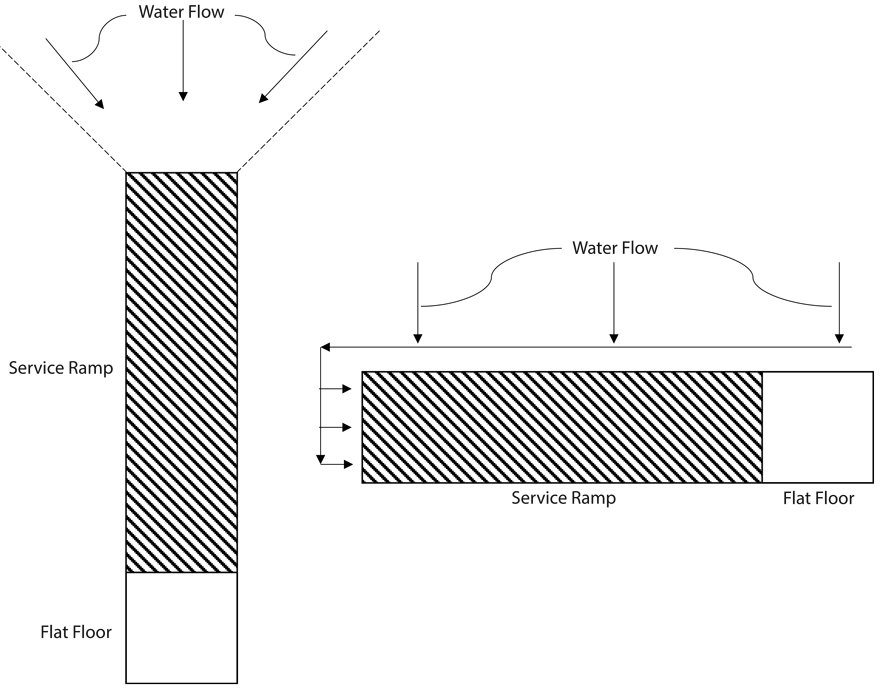
Figure 2. Flow loading and orientation of PPSB to achieve desired flow down the service ramp.
Pull-plug location
The location of the pull-plug within the PPSB is very important. It should be located as far from the entrance ramp as possible. For example, the perpendicular orientation (right diagram, Figure 2) is likely to see the highest amount of turbulence on the side of the PPSB closest to the flush curb (unless measures are taken to distribute the water along the service ramp). Therefore, the pull-plug should be located in the far corner on the opposite side of the freestalls being flushed.
Locate and orient the PPSB so the pull-plug is close to the lagoon for more flexibility in maintaining an ideal grade between the PPSB and the lagoon. Drainpipes with low slopes or long lengths are more prone to plugging, freezing, and breakage. The potential operational costs of these factors may outweigh the capital cost associated with selecting another orientations and pull-plug placements.
PPSB construction
Concrete is the preferred construction material for a PPSB. Advantages of concrete include durability, all-weather use, resiliency, and geometric options. Proper cleaning of the basin necessitates vertical wall construction, eliminating the use of earthen walls that require a side slope for structural integrity. A clay or earthen floor is technically feasible, but highly discouraged due to the potential for damage by machinery when solids are removed.
The concrete entry ramp into the PPSB should have a maximum slope of 12-to-1 (or 5 degrees), as seen in the profile view of Figure 3, to minimize wheel slippage and the potential for equipment overturns. A 12-to-1 slope was chosen because it was the steepest slope possible (minimizes construction cost) that would allow for sufficient traction when hauling solids from the basin (i.e., safety/operability).
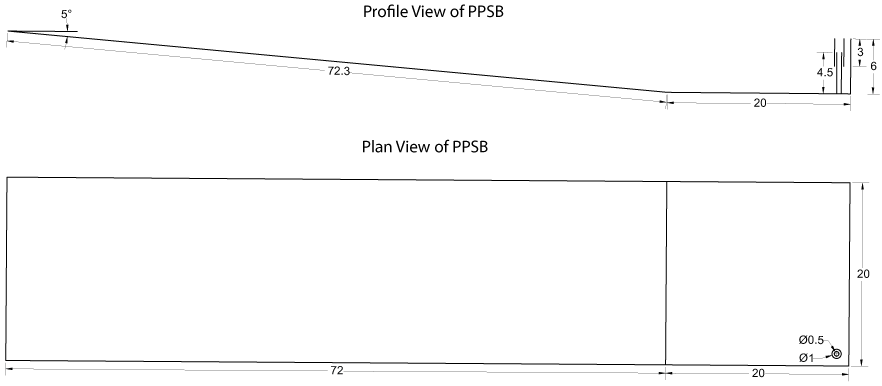
Figure 3. Profile and plan views of typical PPSB (dimensions in feet).
The example provided in the profile view of Figure 3 is of a typical PPSB design that serves a herd of about 150 milking cows with a single-flush volume of about 7,000 gallons, but also represents the smallest recommended size of the system. (Note: This size system can be used for smaller herds, but the size may need to be increased for larger herds or fiber bedding.) A minimum operational depth of 4.5 feet is needed allow solids to settle.
Figure 3 also shows a plan view of a typical PPSB. The maintenance ramp has a horizontal length of 72 feet. The flat floor dimensions of 20 feet by 20 feet are recommended for equipment maneuverability when cleaning the basin. Either dimension (length or width) can be adjusted to increase capacity, with the decision generally based on overall cost. Flush water is dispersed along the width of the maintenance ramp and down into the basin. Water is decanted out of the basin through the pull-plug that is located as far from the influent location as possible.
Construction materials and specifications for the PPSB can be likened to those of picket dam/weeping wall construction. Both the ramp and the floor should be placed on a gravel base on top of uncut earth or compacted fill to prevent settling. The service ramp and flat floor slab should have at least 3,500 psi compressive strength and a minimum thickness of 5 inches with number 3 rebar running both ways at 18 inches off-center, supported so they will be in the center of the poured slab. The entry ramp should be grooved to aid in traction during basin cleaning. Cut small channels or grooves (¾-inch by ¾-inch; 6 inches off-center) into the concrete before it sets up, with the grooves angled such that water drains down-slope.
Concrete walls should be designed to handle internal and external loads including (a) mechanical forces from loaders pushing manure against them to (b) hydraulic pressure of saturated soil pushing on them from the outside. A detailed wall design should be completed prior to construction that includes a load analysis, selection of adequate concrete, and reinforcing to withstand the loads. A typical 6-foot free-standing wall that is 8 inches thick will have, as an example; 36-inch by 36-inch, number 7 “L” bars at 12 inches off-center to tie the wall to the slab, 60-inch number 5 vertical bars at 12 inches off-center, and number 5 horizontal bars at 15 inches off-center
Pull-plug discharge pipe design
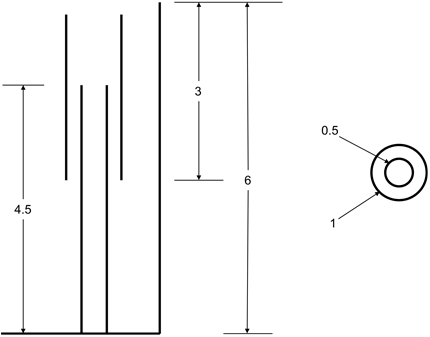 Figure 4. Profile and plan views of a pull-plug. Dimensions given in feet.
The pull-plug typically consists of a 6-inch diameter PVC pipe, fitted into a floor slip-joint that has a height of approximately 4.5 feet. The top of the pull-plug pipe is protected from debris by a 12-inch diameter pipe that encircles the pull-plug and extends approximately 1.5 feet above and below the top of the pull-plug. The outer pipe can be mounted to the inner pipe by using 1-inch galvanized steel strapping such that the outer pipe “hangs” from the inner pipe. A nylon or polypropylene retrieval rope, not less than ½-inch in diameter, should be attached to the top of the inner pipe. Removal will be easier if the retrieval rope is made to run through both sides of the pipe, so that pulling on the rope will pull the pipe directly upward. Detail of the pull-plug is shown in Figure 4.
Management of a PPSB
Relatively little maintenance has been reported for the PPSB. The pull-plug is the only moving part and may need to be replaced if damaged during cleaning or, if PVC/plastic, due to photodegradation. Occasional clogging of the discharge pipe has been reported on some systems when the pipe is pulled for cleaning, and those operators have continued to successfully operate the system without ever pulling the plug. Removing solids from the basin is the most significant maintenance requirement.
Solids removal from the PPSB should occur when the settled solids layer (accumulates from the bottom up) meets the buoyant solids layer (accumulates from the top down). The solids mat in the PPSB will begin to remain above the normal operational level between flushes once these two layers contact one another. The mat may reach the top of the PPSB, perhaps even protruding several inches above the concrete walls, when the floating and settled solids layers have fully come in contact with one another. It may be possible for operation to continue for several days once this defining event has occurred.
One way to judge the condition of the PPSB is to dig through the mat with a shovel or spade in an area near or over the flat floor. The operator should be able to see the interface and judge its existence by noting the depth to, and presence of, a liquid layer. The difference in density and thickness of the middle liquid layer versus the bottom settled solids layer will be evident. Additionally, the elevation of wetted mat relative to the top of the basin wall can serve as an indicator of how much freeboard is available once the bottom/top interface has formed.
The pull-plug should be removed from the PPSB no less than 30 minutes after the morning flush is complete. Operators have reported various results on basin draining. Some have reported water draining in an hour while others haven’t seen much difference over the course of a day. It’s likely that bedding type, ration content, and the volume of flush water applied to the system can effect compaction of the solids and the speed at which the basin drains. Residual slurry, if present, has been reported to be concentrated near the entrance of the maintenance ramp and may have to be removed prior to stackable solids. Solids can be composted or land applied as per the manure management plan once removed from the PPSB. The pull-plug, if removed, is reinserted once the basin is cleared of solids. Ideal design requires the PPSB to be cleaned every three to four months.
Formation and integrity of the floating mat is critical to the overall performance of the PPSB. The mat can take several days, if not a week or more, to form upon initial startup and after basin cleanings. Operators may wish to adjust rations by increasing rough forage two to three days prior to basin cleaning to provide a greater substrate to increase mat formation. Hay, grass, or even residual mat from the last cleaning may be spread across the top of the PPSB, prior to or after the first flush, to help encourage new mat formation.
Freezing conditions can negatively affect the integrity of the floating mat if bridging conditions are not addressed. Ice formation on the service ramp can bridge the mat and the concrete ramp, allowing flush water to flow over the frozen, solid mat rather than through/under the mat. The resulting weight of ponded water on the mat can cause the basin to “turn over” — fully mixing the contents. Although it is likely the mat will become reestablished after a few days of normal operation, proactive removal of any ice along the service ramp should help to avoid system upsets.
Design approach and modeling
- Key basin dimensions are as follow:
- The minimum depth of the PPSB is 6 feet to prevent solids carryover, but may be made deeper to accommodate higher flow rates or increase storage capacity.
- Typical width is 20 feet. (This dimension is variable to address total solids storage needs; width and length can be increased to accommodate larger herds and/or longer storage period).
- Flat floor length is typically 20 feet.
- Length of the maintenance ramp varies to accommodate design depth.
- The maximum slope of the maintenance ramp is 12-to-1.
- The operational hydraulic surface area is 1,480 square feet based on a normal operating depth of 4.5 feet.
- Overall volume is based on two factors: (1) minimum size needed for functionality as discussed above and (2) the required solids storage capacity.
- Key characteristics and design of the pull-plug discharge pipe:
- The pipe must be sized to handle the expected flow rate and hydraulic losses between the PPSB and the lagoon but is typically no less than 6 inches in diameter to minimize plugging.
- The pipe must be seated in a slip joint in the floor of the PPSB. A perforated baffle must be placed around the top of the drainpipe to prevent undesirable material from entering the pipe.
- The pipe should terminate approximately 1.5 feet below the top of the wall.
- Examples of hydraulic loading calculations, based on empirical data, are as follow:
- The hydraulic surface area loading is 4.7 gallons per square foot per flush, assuming a liquid volume from a single flush event of approximately 7,000 gallons and an operational surface area of 1,480 square feet. (Note: 7,000 gallons is typical of a single flush from a 10,000-gallon tank, which are often fuel tanks that are repurposed as elevated flushing tanks).
- The 20-foot-wide maintenance ramp results in a linear hydraulic loading of 350 gallons per foot per flush.
- The circumference of the 6-inch drainpipe is 19 inches, resulting in a weir loading rate of 4,430 gallons per foot per flush.
Case study installation: BR Dairy
The case study of this PPSB installation includes a general overview, information on the sand lane and PPSB, as well as a performance evaluation.
Overall system
BR Dairy is a Missouri Century Farm in Cole County. They decided to make the switch from a slurry scrape freestall to a flush freestall in 2019 to reduce hauling time/expense and equipment maintenance and keep their alleys cleaner. BR Dairy considered a weeping wall for solids retention but, after extensive research and site visits, they opted for the PPSB because of concerns over blinding (plugging) of the weeping wall.
USDA NCRS worked with BR Dairy to design the system prior to engaging with a consulting engineer for final approval. The NRCS Animal Waste Management software (AWM) was used to estimate manure generation. The design was based on a herd size of 120 dairy cows that average 75 pounds of milk per day at an average weight of 1,350 pounds. AWM returned a manure generation volume of 1.7 cubic feet per day per animal unit.
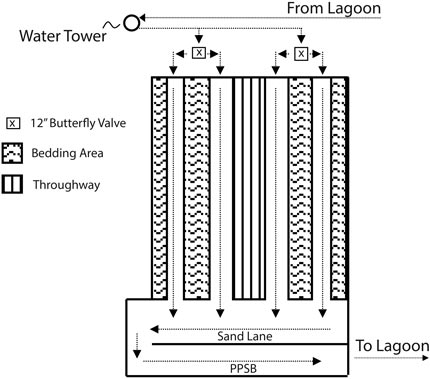 Figure 5. Plan view of BR Dairy freestall barn and closed-loop manure flushing system.
The system at BR Dairy now consists of a 128 foot-wide by 144 foot-long freestall barn, a passive sand-settling lane, the PPSB, and storage lagoon. The dairy is located on a hilltop with little topsoil above bedrock. The location and geology of the site contributed to the most difficult aspects of the design and construction of the system. Figure 5 provides a plan view of the integrated freestall barn, sand settling lane, PPSB, and lagoon.
The barn is separated into two sections by a 21.3 foot-wide feeding throughway in the center. Each side features three rows of sand-bedded freestalls and two flush lanes. The flush lanes are 14.6 feet and 12 feet-wide, for a total width of 26.6 feet per side. The flush lane slope was 2.6 percent as measured but calculated to be 2.1 percent based on elevations and dimensions provided by the design engineer. The sand lane slopes at a 0.4 percent grade until it reaches the end of the wall that separates it from the PPSB. The slope around the corner to the PPSB is 0.6 percent.
Flushing operation
Each side of the freestall is flushed independently using 7,000 gallons (about 3,500 gallons per lane) of recycled lagoon water when the cows have been moved to the milking center. Flushes are manually activated by opening 12-inch butterfly valves (one per lane). The water is pumped from the lagoon to a 10,000-gallon storage tower adjacent to the freestall barn using a 2 hp submerged pump that is suspended from floats just below the lagoon surface. It takes approximately one hour for the pump to recharge the tower so the operators can flush the other side of the barn. The barn is flushed twice a day (morning and evening), resulting in an overall water usage of 28,000 gallons per day.
It takes approximately 22 seconds for the flush water to traverse the 144-foot lane length from the 12-inch butterfly valve to the end of the barn (i.e., the beginning of the sand lane). The depth of the flush was measured to be greater than 3 inches for approximately 10 seconds and reached a maximum depth of 4 inches. Manning’s equation for open channels is adequate for calculating velocity in flush alleys.
The calculated velocities for the 14.6-foot and 12-foot flush alleys are 4.7 feet per second and 4.6 feet per second, respectively, for a 10-second flush at a flow height of 3 inches. Both alleys reach velocities of essentially 5.6 feet per second at a flush depth of 4 inches. The flushing system cleans the front (upslope) portions of the alleys well (Figure 6a). However, owners have reported some residual bedding sand in the alleys after flushing, generally from the midpoint to the downslope end of the alley (Figure 6b). Based on the calculations above, it seems likely that the recommended velocity of 5 feet per second at a duration of 10 seconds for alleys less than 150 feet with grades less than 3 percent is either inadequate or not quite achieved.
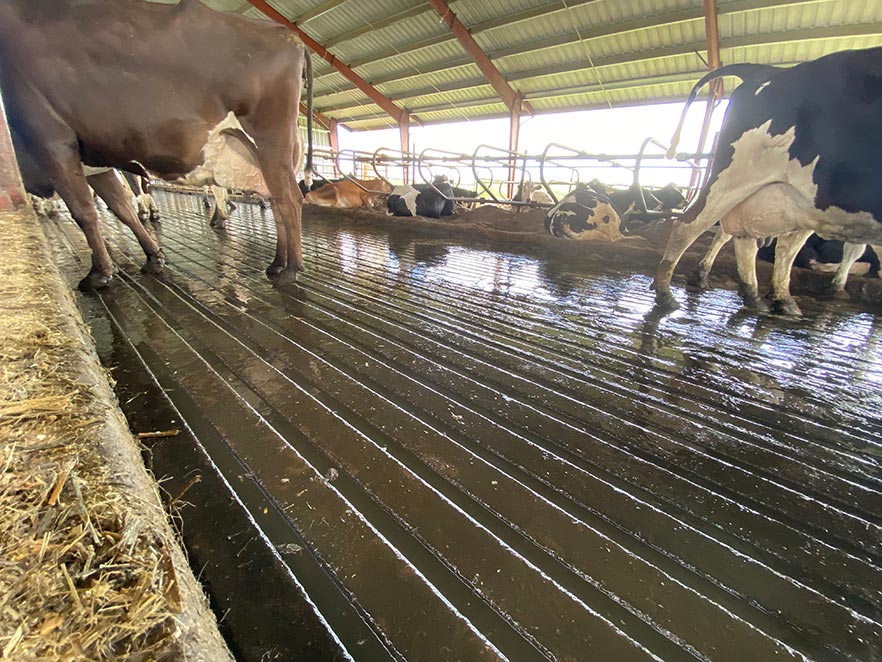
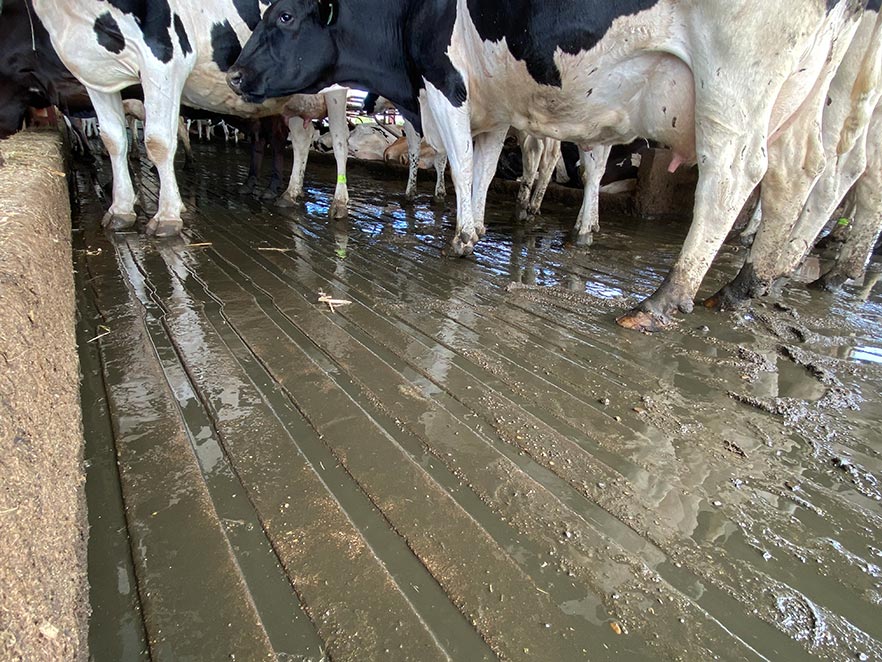
Figure 6a and 6b. Upslope (top) and downslope (bottom) of flush alley.
Sand lane
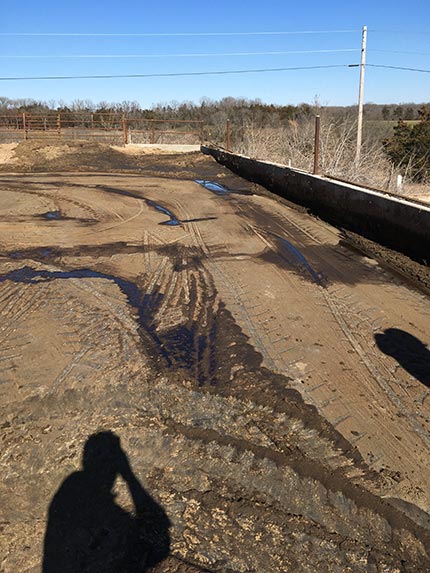 Figure 7a. Upslope view of sand lane.
The sand lane is 20-feet wide with a 0.4 percent slope to allow the heavier sand particles to settle while keeping manure slurry in suspension (velocity approximately 1.2 feet per second). Figure 7a shows an image of the sand lane from the downslope end. The sand lane provides a means of retaining the heavier particles prior to the PPSB. BR Dairy allows the reclaimed sand to dry prior to reuse. The sand lane designed for BR Dairy seems to retain most of the sand prior to the PPSB service ramp. The operator believed that 60 to 70 percent of sand is retained in the sand lane when the sand is removed from the lane once per week.
PPSB
The flush water makes a 180 degree (hairpin) turn at the downstream end of the sand lane and spreads across the width of the PPSB as it flows into the PPSB. The brown pole on the curb to the right in Figure 7a marks the approximate end of the PPSB, which is on the other side of the stem wall. Figure 7b displays an image of the PPSB ramp and adjoining sand lane near the hairpin turn. It should be noted that the photos in Figures 7a and 7b were taken during a cleanout operation of the PPSB. Figure 7c shows the sand lane and PPSB while in operation.
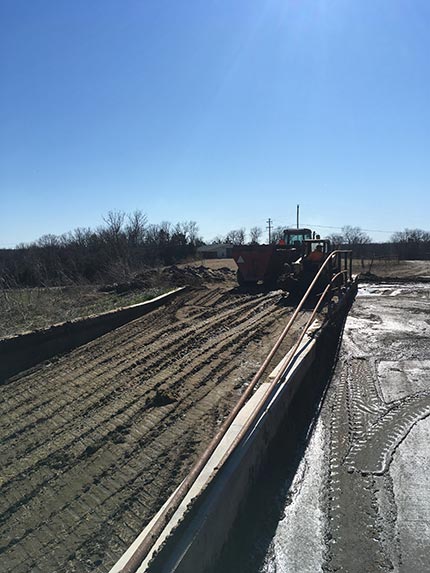 Figure 7b. PPSB ramp and adjoining sand lane.
The PPSB for this application has overall top dimensions of 20 feet by 92 feet. Of the 92-foot length, 20 feet is flat floor at the end of the service ramp. The ramp has a 12-to-1 grade, resulting in a length of 72 feet for the 6-foot depth of this basin. The overall basin volume is 6,720 cubic feet, or 50,269 gallons. A 4.5-foot operational depth results in a normal operational volume of 5,168 cubic feet, or 38,659 gallons. The operators noted that the mat can rise over the sidewall by 1–2 feet before the basin needs to be cleaned.
Although referred to as a sedimentation basin, the PPSB also acts as a filter during operation. Fibrous material from the manure slurry (or bedding, if applicable) collects on the surface of the water in the PPSB and congeals to form a semi-solid mat. It is important that the incoming flow is allowed to spread out across the 20’ width to disturb the mat as little as possible. The manure-laden water flows down the access ramp and under the mat. Over time, the height of the mat rises to the level of the orifices in the discharge pipe (Figures 8a and b). It is at this point that filtration begins to occur. As water flows into the basin it tries to raise the mat, but the weight of the mat causes water to flow up through the mat and into the collection pipe. Operation continues in this manner until the mat rises above the basin wall. Figure 8c (following page) shows development of the mat during operation and Figure 8d shows the filtering action and discharge of the PPSB through the pull-plug.
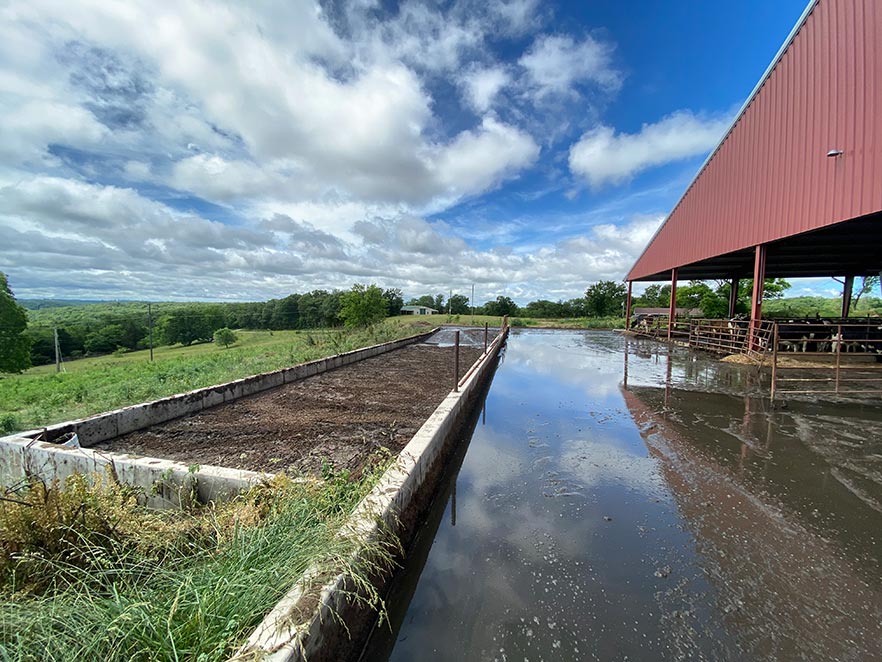
Figure 7c. PPSB and sand lane in operation.
NCRS generally recommends the discharge pipe (Figure 8b) be pulled from the slip joint prior to cleaning the basin so that the water will completely drain and minimize the moisture content of the solids in the basin. However, the operator at BR Dairy was discouraged by the recommended procedure when plugging occurred in the pipe between the PPSB and lagoon during the first cleaning attempt. Now the operator carefully monitors the bottom/top layer interface and cleans the basin without removing the discharge pipe. He simply waits for all the fluid to drain through the discharge pipe and begins transferring the solids out of the PPSB. This revised cleaning procedure results in solids that, even though heavier due to a higher moisture content, are still stackable. It takes the operator approximately 33 loads using a Gehl 312 spreader (300-bushel rating; 7–8 tons per load) and Gehl 6635 skid steer loader. The solids are land applied between one and two miles from the site. The entire cleaning procedure takes a single operator ten hours to complete.
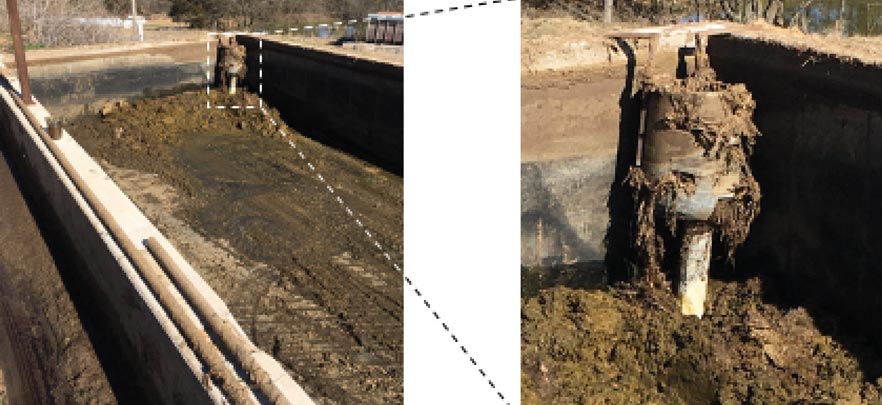
Figure 8a and 8b. PPSB with liquid discharge pipe (left) and discharge pipe (right).
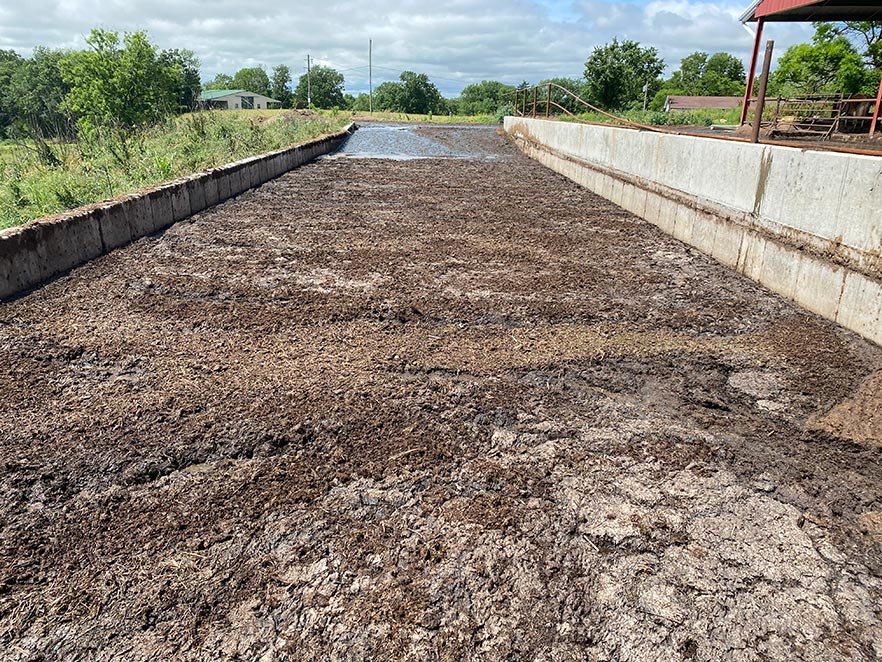
Figure 8c. Mat development on the PPSB.
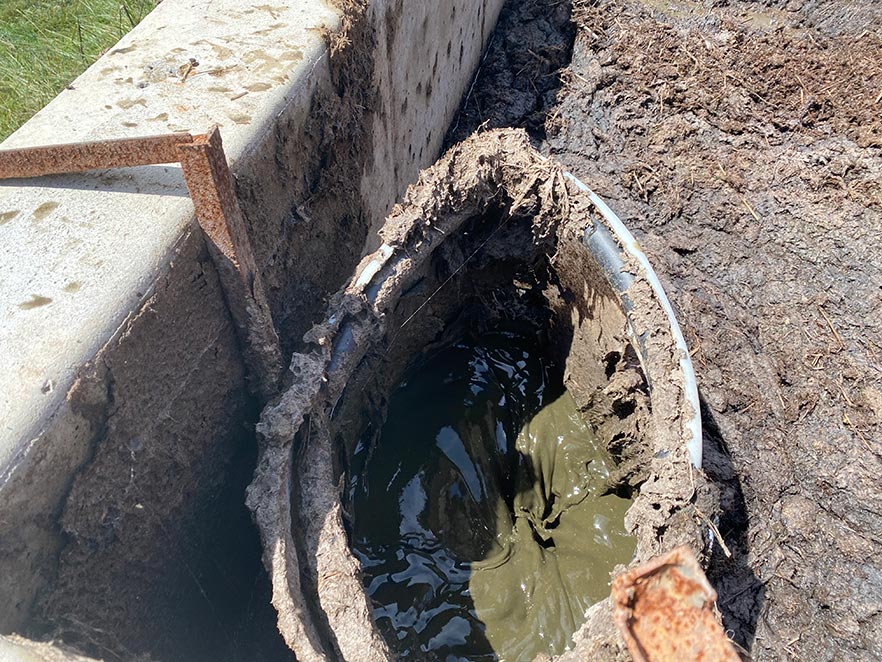
Figure 8d. Water discharging from the PPSB.
Performance evaluation
A series of discrete grab samples were taken in June to evaluate the performance of PPSB. Samples were stored in 500 mL Nalgene bottles. Analysis was completed by the Soils Lab at the University of Missouri and the results are displayed in Table 1. Figure 9 shows the sampling locations superimposed on a sketch of the freestall barn, sand lane, and PPSB at BR Dairy.
Table 1. Grab sample analysis representative materials in flushing system.
| Date | Material sampled (location legend numbering in Figure 9) | Total nitrogen (mg/L) | Ammonia-nitrogen (mg/L) | Total phosphorous (mg/L) | Potassium (mg/L) | Moisture (%) | pH |
|---|---|---|---|---|---|---|---|
| 6/4/20 | Flush water at alley mid-length (1) | 1,962 | 997 | 352 | 1,685 | 96.2 | 7.8 |
| 6/4/20 | PPSB effluent (2) | 2,088 | 847 | 363 | 1,677 | 95.0 | 7.6 |
| 6/30/20 | Sand lane effluent (3) | 3,084 | 612 | 1,336 | 2,053 | 71.4 | 7.6 |
| 6/30/20 | Settled solids at bottom of PPSB (4) | 2,565 | 495 | 775 | 1,128 | 67.6 | 7.5 |
| 6/30/20 | Flush effluent from freestall barn (5) | 1,342 | 509 | 498 | 1,894 | 94.3 | 7.6 |
| 6/30/20 | Mat at top of PPSB (6) | 6,433 | 84.5 | 2,610 | 2,143 | 42.3 | 7.9 |
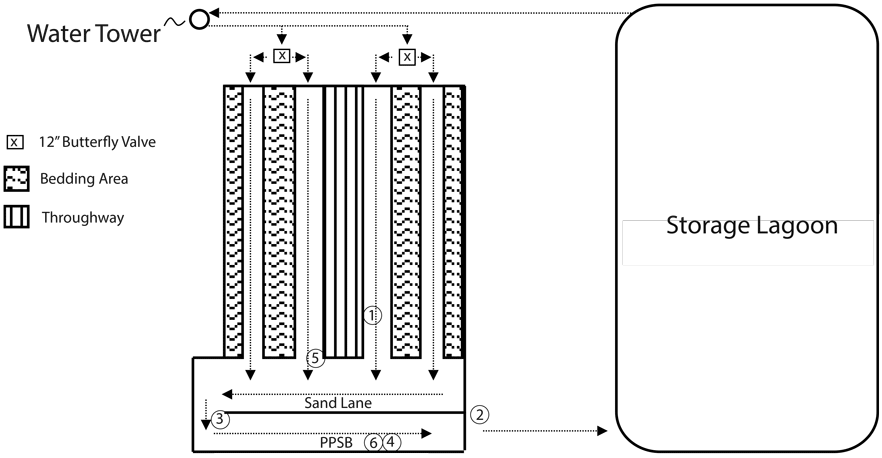
Figure 9. Illustration showing sample locations in flush water handling system.
The first set of samples, taken June 4, attempted to characterize overall treatment of the flush effluent by the sand lane and PPSB at BR Dairy. The sample collected from the flush alley (1) was taken toward the end of the flush cycle and may not have been representative of the solids and nutrient load contained within the entire flush volume. The PPSB effluent sample (2) was taken from the discharge pipe of the PPSB. Note that the PPSB effluent represents the middle layer in the PPSB that is slowly reduced in volume as solids accumulate. The effluent concentrations shown in Table 1 should be representative of the overall operational period since these materials are expected to remain relatively consistent throughout the service life of the PPSB (i.e., between cleanings), with the exception of the initial time period when the floating mat is forming (approximately 1–3 days after cleaning of the PPSB).
The sand lane effluent sample (3) was taken at the entrance of the PPSB where both sand and organic solids are present, and the flush discharge sample (5) was taken as the end of the flushing lane as indicated in Figure 8. It should be noted that the operator flushed the system outside of normal flushing time so that samples 1, 3, and 5 could be collected. Samples taken between normal flushing cycles could return results that underestimate the solids and nutrient concentrations normally in the flush water and, therefore, underestimate the mass load on the PPSB.
Samples of the settled solids (bottom, Loc. 4) and mat (top, Loc. 6) of the PPSB are useful in evaluating the solids and nutrient retained in the settling basin. The floating materials at the top and the sediment at the bottom had a higher nutrient and solids content than the effluent, confirming significant solids and nutrient retention by the PPSB. The operator at BR Dairy noted that, upon cleanout, there was no liquid middle layer; the top layer and the bottom layer comprises 2 feet and 4 feet, respectively, out of the overall 6-foot basin depth. The total mass of nutrients retained can then be derived by assuming that the depth ratio and nutrient concentrations are consistent throughout the PPSB. Table 2 displays the mass of nutrients retained by the PPSB.
Table 2. Estimated mass of nutrients retained by the PPSB per clean-out.
| PPSB | Volume (cubic feet) | Total nitrogen (lb) | Ammonia nitrogen (lb) | Total phosphorous (lb) | Total potassium (lb) |
|---|---|---|---|---|---|
| PPBS top | 3,200 | 1,282 | 17 | 229 | 427 |
| PPBS bottom | 3,520 | 562 | 108 | 75 | 247 |
The values shown in Table 2 are estimated for one clean-out period. There are typically three to four clean-out periods per year, depending on herd size and other factors. Also, it should be noted that the values for the sediment collected from the PPSB bottom may have been diluted during sample retrieval. That is, the sample from the bottom had to be pulled through the middle liquid layer, which, at the time of sampling, was about 18 inches deep. Follow-up sampling just before or during clean-out is necessary for a more accurate determination.
About 6,700 cubic feet of solids (including the floating mat and the bottom sediment) is prevented from entering the lagoon every three to four months. The recovered solids were dry enough to be stackable, making them ready to handle using a skid-steer loader and a solid manure spreader. Moisture content of the PPSB solids and floating mat were about 68 percent and 42 percent, respectively.
While the solids from the PPSB serve as a practical soil amendment for BR Dairy, the cost savings represented from having to use special equipment to agitate and pump the solids out of the lagoon at a later date, and the resulting flexibility in lagoon operation and water balancing is more valuable to their operation.
Assuming 3.5 clean-outs of the PPSB per year: Approximately 23,450 cubic feet (6,700 cubic feet of solids at 3.5 clean-outs per year) of non-degradable or slowly degradable solids are prevented from entering the lagoon each year, along with 6,454 pounds of nitrogen (438 pounds as ammonia-nitrogen) and 1,063 pounds of phosphorous (column summation from Table 2 multiplied by 3.5). The American Society of Biological and Agricultural Engineers (ASABE) lists lactating cow nitrogen and phosphorous generation rates of 0.99 pounds per day per lactating cow and 0.17 pounds per day per lactating cow, respectively. With a current population of 140 lactating cows and 3.5 clean-outs per year, we can estimate the total nitrogen and phosphorous generated to be 50,589 pounds-nitrogen and 8,687 pounds-phosphorous (0.99 or 0.17 × 140 × 365). Therefore, the PPSB removed an estimated 13 percent total nitrogen and 12 percent total phosphorous. It should be noted that gaseous emission of ammonia is not considered in these calculations and the retention of nitrogen in the basin may increase volatilization potential.
Operational insight
The PPSB at BR Dairy has a design solids storage capacity of three to four months based on receiving manure from approximately 120 lactating cows. The current inventory on the farm is slightly higher than 120, perhaps closer to 140, but the system has met the design timeframe between cleanings.
The basin was in the process of being cleaned during our initial visit on March 6, 2020 (Figures 6a and 6b). There were two insights gained from conversation surrounding cleaning; effects of (a) pulling the pipe during cleaning and (b) ice formation on the service ramp.
Insight 1: The pipe from the PPSB to the lagoon became plugged with debris the first time the pull-plug pipe was removed to clean the basin. The operators left pipe in place during cleanings thereafter. Their experience suggests the time it takes to clear the discharge pipe is greater than the additional burden of higher solids moisture.
Insight 2: Some ice formation was seen in the sand lane, which didn’t prevent operation of the flush system but did hinder animal movement in and out of the freestall barn. Ice formation on the PPSB mat, as well as between the service ramp and the PPSB mat, was more problematic. The ice bridge from the ramp to the mat allowed flush water to travel across the mat. This, combined with the weight of the ice on the mat, caused the mat to collapse into the basin and mix with bottom layers. The operator thought the mat would have reformed over several days if they had allowed operation to continue, but they opted to clean it out because the PPSB was near its storage capacity.
Conclusion
The owners are satisfied with the performance of the PPSB. They wanted a low-maintenance, low-technology solution that would allow them to efficiently manage manure solids within a flush system. The exact cost is unclear because there were several items tied in with the construction, but the owner’s best estimate is $60,000 for the sand lane and PPSB.
The primary benefit of the PPSB is a reduction in time spent agitating, pumping and managing solids inventory in the lagoon. Fewer solids in the lagoon decreases time spent repairing or unclogging pumps. Lastly, solids management helps with reliable water balance on the farm. Far less capacity in the lagoon is used for solids treatment and storage, so there is more room to store water and longer intervals between land applications.
Approximately 23,450 cubic feet of non-degradable or slowly degradable solids are prevented from entering the lagoon each year, along with 6,454 pounds of nitrogen (438 pounds as ammonia-nitrogen) and 1,063 pounds of phosphorous. These represents of 13 percent and 12 percent of manure-based nitrogen and phosphorous, respectively, being retained in the PPSB.