Crop insurance offers farmers a way to manage risk associated with agricultural commodity production and prices. Crop insurance can decrease the production risk associated with adverse weather conditions, fire and pests, and the price risk associated with fluctuating commodity markets.
Crop insurance basics
The Risk Management Agency (RMA) of the U.S. Department of Agriculture (USDA) administers the Federal Crop Insurance Corporation and other programs to support U.S. agriculture. Policies are available through the RMA for more than 100 crops, although not all of those crops are insurable in all states. Across the U.S., 17 private companies sell and service all federal crop insurance products. RMA develops and approves the premium rates, administers subsidies, approves and supports products, and reinsures these private companies. In 2022, more than 1.1 million policies were sold in the U.S., protecting 366 million acres. Of those policies, more than 86,000 were sold in Missouri, covering over 9 million acres of cropland. About 90% of Missouri row crop acreage in 2022 was insured with RMA crop insurance plans.
Crop insurance plans
There are four general types of crop insurance available to Missouri corn and soybean farmers in particular:
- Revenue protection (RP)
- Revenue protection with harvest price exclusion (RP-HPE)
- Yield protection (YP)
- Area risk protection insurance (ARPI)
Insurance policies are also available for other major crops, but what crops are covered varies by county. Contact your local crop insurance agent for details. Following are brief descriptions of the crop insurance products available for Missouri row crop producers. Further information is available online from the RMA (see resources).
Revenue protection
Revenue protection (RP) plans protect against revenue loss due to yield reductions, price fluctuations or both. The farmer selects the amount of average yield to insure, between 50 and 85 percent. The coverage price is based on the greater of the new crop projected price during February (December futures contract for corn, and November futures contract for soybeans) or the harvest price (during October). If the farmer’s actual revenue (based on actual yield times harvest price) is less than the insurance policy revenue guarantee, an indemnity is paid for the difference.
Revenue protection with harvest price exclusion
Revenue protection policies with harvest price exclusion (RP-HPE) are essentially the same as RP policies, except that with RP-HPE policies, farmers do not have the opportunity to improve their revenue guarantee if prices improve at harvest.
Yield protection
Yield protection (YP) plans protect against production loss. The farmer selects the amount of average yield to insure, between 50 and 85 percent. The farmer also selects the portion of the projected price to insure, between 55 and 100 percent of the crop price established by the average new crop future prices during the month of February (December contract for corn, and November contract for soybeans). If the harvest is less than the yield insured, the farmer is paid an indemnity based on the difference. Indemnities are calculated by multiplying this yield difference by the insured percentage of the established price selected when crop insurance was purchased.
Area risk protection insurance
Area risk protection insurance (ARPI) plans protect against widespread loss of revenue or yield in a county. Farmers select policies that cover 70 to 90 percent, in 5 percent increments, of the county’s yield and can cover 80 to 120 percent of the price. ARPI provides farmers with the convenience of one policy for their operation, and often requires less paperwork and has lower premiums than individual farm-level insurance. However, it is recommended that farmers use this plan only if their yields move in the same direction as their county’s averages. In 2013, ARPI policies replaced the group risk plan (GRP) and group risk income protection plan (GRIP). Currently available ARPI policies include area revenue (with or without harvest price exclusion) and area yield.
Unit structure
Crop insurance plans can allow a farm to be insured in a variety of ways, depending on the needs of the operation. A farm can be set up in multiple units, each with separate crop insurance policies, or as an entire unit. The unit classifications selected affect the premium rates, and any subsequent indemnities, under the respective policies. Characteristics of each unit classification are as follows.
Enterprise units
Enterprise units combine all acres of the same crop a producer owns, cash rents or share crops in the same county into one insurable unit. For example, corn and soybean acres in one county would result in two separate enterprise units.
Basic units
Basic units combine all acres a producer owns or cash rents in the same county into one insurable unit for each crop. A crop that is share rented among different landlords, tenants or sharecroppers would result in separate basic units for each arrangement.
Optional units
Optional units can further divide a farming operation into more units than the basic unit classification. Farms can be organized as separate insurable units based on different sections, section equivalents or USDA Farm Service Agency (FSA) farm numbers (in the absence of sections or section equivalents). Additionally, if certain farming practices, such as irrigation or organic production, are used, then separate units can be established for each parcel of land.
Whole-farm units
Whole-farm units combine all the acres a producer farms in the same county into one insurable unit whether or not multiple crops are planted.
Premiums
The cost of crop insurance policies varies by crop, location, plan, coverage level and unit classification. Crop insurance agents are the best source of specific information about local farms, and can be located online through the USDA-RMA Crop Insurance Agent Locator (see Resources). Additionally, the University of Illinois has developed an online Crop Insurance Premium Calculator that shows general premium ranges for Missouri producers by typical county yields, coverage level and plan (see Resources).
Crop insurance policies are subsidized by the federal government to make them less expensive for farmers. The subsidy offsets a portion of the cost associated with the premium. As coverage levels increase in crop insurance policies, the percentage of government subsidy decreases. Insurance premiums for all U.S. crops insured in 2022 collectively exceeded $18 billion, 11.5 billion of which was paid by the federal government and $6.5 billion was paid by the insured farmers.
History of Missouri crop insurance
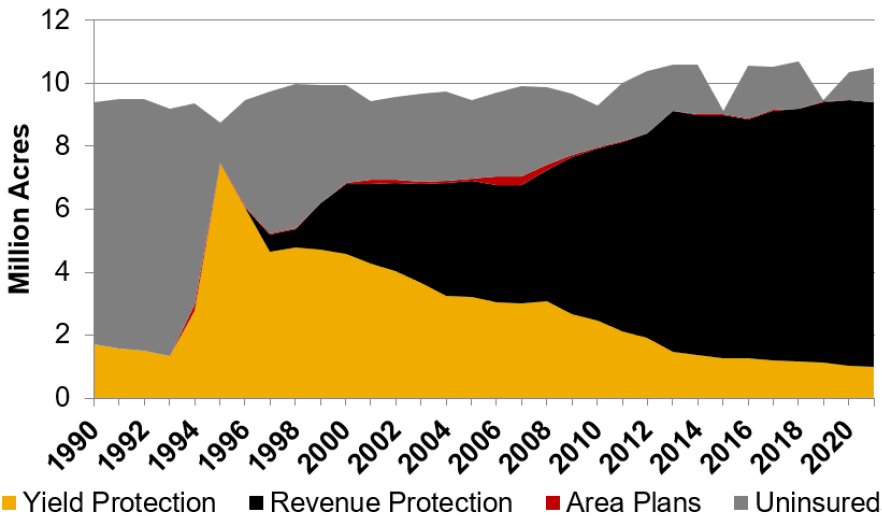
The following figures and table show historical crop insurance data for Missouri’s principal row crops — corn, cotton, rice, soybeans and wheat. Of the major policy types, revenue protection has been the most popular coverage for over a decade (Figure 1). Use of yield protection policies has trended downward until it represents about 10% of planted row crop acres in Missouri. Few Missouri acres are covered by area risk protection insurance (ARPI), formerly known as GRP and GRIP.


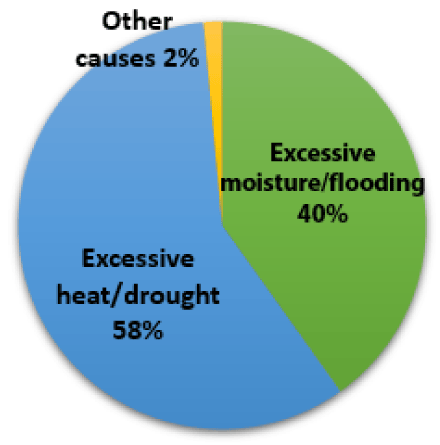
The use of insurance products varies by crop. From 2017 to 2021, the most widely insured crops were cotton, corn and soybean, with over 80 percent of planted acreage of each crop insured (Table 1). The type of insurance purchased for each row crops varies. Cotton and rice producers use nearly equal amounts of revenue and yield protection plans. Corn, soybean and wheat producers primarily use revenue protection plans. Crop loss can be due to a number of perils, including price declines, insects, plant diseases, tornadoes, wildlife, wind and fire. From 2011 to 2022, the major causes of Missouri row crop loss have been excessive heat and drought and excessive moisture and flooding (Figure 2). In 2021, Missouri farmers received more than $225 million in indemnity payments.
Table 1. Percentage of Missouri crop acres enrolled in crop insurance, 2017 to 2021.
| Corn | Cotton | Rice | Soybeans | Wheat | |
|---|---|---|---|---|---|
| Revenue protection | 89.0% | 43.0% | 44.0% | 80.0% | 58.0% |
| Yield protection | 7.0% | 47.0% | 48.0% | 9.0% | 15.0% |
| Area risk protection | 0.1% | 0.0% | 0.0% | 0.1% | 0.2% |
| Uninsured | 4.0% | 9.0% | 8.0% | 10.0% | 27.0% |
| Total | 100.0% | 100.0% | 100.0% | 100.0% | 100.0% |
Summary
Crop insurance offers producers a means to manage risks. Table 2 shows the four general types of crop insurance available to farmers for major crops. There is no single correct amount or type of coverage; the amount and type of coverage necessary varies greatly based on each producer’s needs. In addition, unit classification is an important consideration in choosing a crop insurance policy. Producers must assess their current situation and make decisions based on their individual needs. Subsidies provided by the federal government help offset a portion of the crop insurance premiums, but producers still incur a cost, which increases as coverage level increases. Contact a local crop insurance agent for more information about crop insurance policy premiums and insurance needs.
Table 2. Summary of crop insurance plans for Missouri spring-planted row crops.
| Characteristic | Revenue protection | Revenue protection with harvest price exclusion | Yield protection | Area risk protection insurance |
|---|---|---|---|---|
| Insures against | Individual revenue risk | Individual production risk | County-level revenue or county-level yield risk | |
| Yield coverage | 50% to 85% of actual production history yield | 50% to 85% of actual production history yield | 70% to 90% of county yield | |
| Price coverage | Higher of new crop futures price in February (base price) or October (harvest price) | New crop futures contract price in February (base price) | 55% to 100% of new crop futures contract price in February (base price) | 80% to 120% of maximum coverage level |
| Results on which indemnity is based | Actual yield and futures prices in October | Actual yield | Estimated county revenue and/or yield | |
| Insurable units | Basic, optional, enterprise and whole farm units | Basic, optional and enterprise units | Enterprise units | |
| Major Missouri crops covered | Corn, cotton, grain sorghum, rice, soybean, wheat | Corn, cotton, grain sorghum, oats, rice, soybeans, wheat | Corn, cotton, grain sorghum, soybeans, wheat | |
| Past policies with similar coverage | Crop revenue coverage; income protection; revenue assurance; actual revenue history | Actual production history | Group risk plan; group risk income protection | |
Resources
- Risk Management Agency (RMA) policies
- RMA Crop Insurance Agent Locator
- University of Illinois, Crop Insurance Premium Calculator