Chapter 4 of the Missouri Master Gardener Core Manual
Soil as a medium for plant growth can be described as a complex natural material derived from weathering of rocks and decomposition of organic materials, which provide nutrients, moisture and anchorage for plants.
Soil is a mixture of minerals, organic matter (humus), air and water. An ideal soil for plant growth is about 50 percent solids consisting of minerals and organic material (Figure 1). The organic portion consists of residues from plants, animals and other living organisms. Under optimum conditions for plant growth, about half of the space between soil particles — pore space — is filled with water, and the remainder with air. Soil compaction reduces pore space and the amount of air and water the soil can hold, thereby restricting root growth and the ability of plants to take up nutrients from the soil.
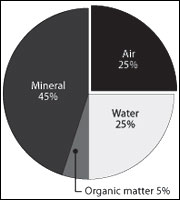 Figure 1
Volumetric content of four principal soil components for an ideal soil at ideal moisture content for plant growth.
Physical properties
Soil color
The color of soil has little effect on plant growth but is an indicator of soil properties that do affect plant development. Color is an indicator of organic matter content, drainage and aeration.
- Black
High in organic matter (4 percent or more). - Brown
Good organic matter content and well drained. - Red
Low in organic matter, well drained. Red color is due to the presence of iron (often ferric oxide, Fe2O3). - Gray
Low in organic matter, poorly drained. Gray color is due to an excess of water and poor aeration. Gray color is due to the presence of iron (often ferrous oxide, FeO). - Yellow
Low in organic matter, well drained. - Mottling effects in subsoil
Iindicates both well and poorly drained conditions during the year due to fluctuations in water table.
Soil structure
Soil structure refers to the arrangement of soil particles into aggregates. Any physical disturbance influences soil structure. The addition of calcium (Ca), magnesium (Mg) or organic matter improves the structure of soil by enhancing aggregation, the ability of soil particles to hold together as a coherent mixture. Organic matter acts as a bonding agent in holding soil particles together to form aggregates. Excessive sodium (Na) levels in soils cause dispersion of soil particles that can result in poor soil structure. Development of desirable soil structure increases porosity (the amount of pore space in the soil), reduces erodibility and improves water-holding capacity, root penetration and ease of tillage.
Soil texture
Soil texture refers to the percentage of sand (2.0 to 0.05 mm), silt (0.05 to 0.002 mm) and clay particles (less than 0.002 mm) that make up the mineral portion of the soil (Figure 2). Loam is a variable mix of these three textural classes.
- Sand adds porosity. Silt adds body to the soil. Clay adds chemical and physical properties that affect the ability of the soil to take up nutrients through adsorption to soil particles.
- Soil texture affects the following soil characteristics:
- Water-holding capacity
- Nutrient-holding capacity
- Erodibility
- Workability
- Root penetration
- Porosity
- Soil texture affects soil fertility and nutrient management:
- Most sulfur deficiencies occur in sandy soils.
- Nitrogen is easily leached from sandy soils. Loss of soil nitrogen (denitrification) is more common on heavy, clay soils.
- Potassium can leach from sandy soils but is immobile in medium- to fine-textured soils.
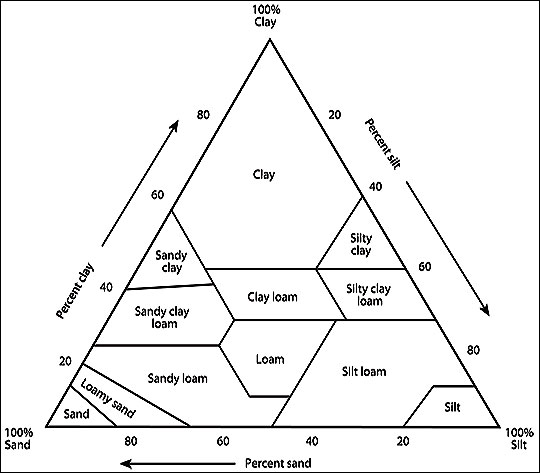
Figure 2
The soil textural triangle shows the percentage of sand, silt and clay in each of the textural classes. Soil texture can be measured accurately in a laboratory. Soil texture can also be estimated in the field by a hand-feel method (see Table 1).
Table 1. Soil texture as defined by soil texture class and estimated by a hand-feel method.
| Soil textural group | Soil textural class | Feel |
|---|---|---|
| Coarse to very coarse (more than 70 percent sand) | Sand, loamy sand | Feels gritty, does not ribbon or leave smear on hand. |
| Moderately coarse | Sandy loam | Feels gritty, leaves smear on hand, does not ribbon, breaks into small pieces. |
| Medium | Silt, loam, silt loam | Feels smooth and flourlike, does not ribbon, breaks into pieces about 1/2 inch long or less. |
| Moderately fine | Sandy clay loam, clay loam, silty clay loam | Forms ribbon that breaks into pieces about 3/4 inch long, sandy clay loam will feel gritty. |
| Fine (more than 40 percent clay) | Sandy clay, silty clay, clay | Forms long, pliable ribbon more than 2 inches long; sandy clay will feel gritty. |
Soil organic matter
Soil organic matter, or humus, is the partially decomposed residue of plants, animals and other organisms. Organic matter refers to all organic material in the soil, including fresh crop residues.
Organic matter improves soil structure by acting as a bonding agent that holds soil particles together in aggregates. Without organic matter, aggregates are less stable and can be easily broken apart. Good soil structure promotes water movement and root penetration while reducing soil crusting, clod formation and erosion.
Organic matter provides plant nutrients, mainly nitrogen and sulfur and smaller amounts of phosphorus. About 20 pounds of nitrogen are released by decomposition of every 1 percent of organic matter in the soil. Organic matter is a primary reservoir for available forms of micronutrients (mainly zinc and boron).
Soil organic matter also improves the cation exchange capacity of the soil, its ability to hold positively charged molecules, or ions, of mineral nutrients.
Soil organisms
Soil organisms vary in size from microscopic bacteria, fungi and algae to those visible to the naked eye, such as earthworms and insects. They perform both beneficial and detrimental functions in the soil.
Microbes decompose organic matter and release nutrients for plant uptake. Bacteria called rhizobia are responsible for fixing atmospheric nitrogen as plant-available forms in root nodules on legumes. Some fungi and nematodes are responsible for plant diseases, and many soil insects damage crops.
Fertilizer has positive effects on soil microorganisms by providing more nutrients and increased crop residues. Application of anhydrous ammonia will temporarily reduce populations of microorganisms in the zone of application.
Chemical properties
Soil pH
Soil pH is a relative measure of the hydrogen ion concentration (H+) in the soil. The pH value can vary from a minimum value of 0 to a maximum value of 14.
- Acidic
pH less than 7 - Neutral
pH = 7 - Alkaline
pH greater than 7
Soil pH affects the availability of nutrients to plants (Figure 3). In acid soils (pH is low) calcium and magnesium become more available to plants, whereas the micronutrients iron, aluminum and manganese become soluble and can reach levels toxic to plants. These micronutrients also can react with phosphorus to form compounds that are insoluble and not available to plants. In alkaline soils (pH is high), several soil micronutrients, including zinc, copper and cobalt, become less available to plants. Also at high pH, phosphorus precipitates (becomes insoluble) with the higher levels of calcium in the soil and therefore becomes less available to plants.
Soil pH affects the population and activity of microorganisms. The activity of nitrogen-fixing bacteria associated with legumes is impaired in acid soils, resulting in less nitrogen fixation.
Several natural processes cause most soils to become more acidic over time:
- Soils formed from acidic rock parent materials like sandstone or shale will be more acidic than those formed from limestone.
- The higher the rainfall, the more leaching of alkaline elements such as calcium and magnesium, leaving acidic elements such as hydrogen, manganese and aluminum. Acid rain can also acidify the soil.
- Nitrogen from fertilizer (ammonium sulfate), decomposing organic matter, and manure as well as nitrogen fixation by legume roots all increase soil acidity.
- Crop removal of nutrients such as calcium and magnesium causes acidity to develop. This effect is more pronounced with legumes than with nonlegumes.
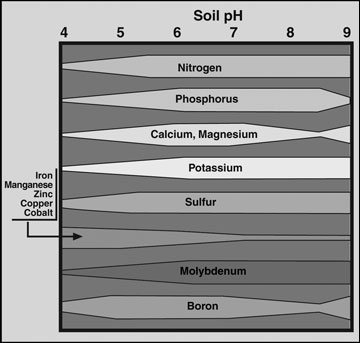 Figure 3
Soil pH affects nutrient availability to plants. The width of the band indicates the relative availability of each plant nutrient at various pH levels.
Cation exchange capacity
Cation exchange capacity (CEC) is a measure of the total amount of exchangeable cations (positively charged ions) a soil can adsorb. Nutrient cations in the soil include positively charged ions such as calcium (Ca+2), magnesium (Mg+2), potassium (K+), sodium (Na+) and hydrogen (H+). In soil tests, CEC is reported in milliequivalents (meq) per 100 grams of soil. The exchangeable cations in the soil are in equilibrium with those in the soil solution (water in the soil). As plants remove nutrients (cations) from the soil solution, they are replenished from the adsorbed cations, which are then available for plant uptake (Figure 4).
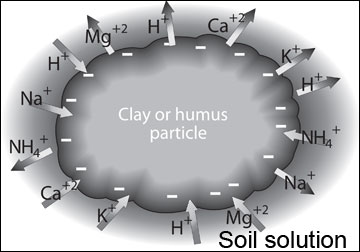 Figure 4
Exchangeable nutrient cations adsorbed on soil particles exist in equilibrium with cations in the soil solution. Cations from the particles replenish those taken up from the soil solution by plants.
- The higher the CEC, the more cations a soil can retain.
- Soils differ in CEC depending on clay and organic matter content. CEC of clay varies from 4 to 100 meq per 100 g. Humus has an average CEC of 200 meq per 100 g.
- Soil texture affects CEC. The more clay, the higher the CEC (Table 2).
- Soils with low CEC (1 to 10) have high sand content and low water-holding capacity. They require less lime to correct a given pH, and leaching of nitrogen and potassium is more likely.
- Soils with high CEC (15 to 40) have high clay or humus content and high water-holding capacity. They require more lime to correct a given pH and have a greater capacity to hold nutrients.
Table 2. The higher the clay content of the soil, the greater its cation exchange capacity (CEC).
| Soil | CEC (meq/100 g) |
|---|---|
| Sand | 2 to 5 |
| Sandy loam | 5 to 12 |
| Loams | 10 to 18 |
| Silt and silt clay loams | 15 to 30 |
| Clay and clay loams | 25 to 40 |
Anion retention in soils
Anions are negatively charged ions. They are retained by positively charged surfaces in the soil, but only in negligible amounts. Negatively charged ions, such as nitrate and phosphate anions, are repelled by clay/humus particles, which are also negatively charged. For this reason, anions are susceptible to leaching losses in soil solutions.
- Anions such as nitrate (NO3-), sulfate (SO4-) and chloride (Cl-) are highly soluble and move with water.
- The phosphate anion (PO3-) does not move freely in soils largely because it forms relatively insoluble compounds with iron and aluminum in acid soils (low pH) and with calcium in alkaline soils (high pH).
Plant nutrition
Seventeen elements are considered essential nutrients for plant growth, and 14 of these elements come from the soil (Table 3). If there is a deficiency of any essential element, plants cannot complete their vegetative or reproductive cycles. Some of these nutrients combine to form compounds that make up cells and enzymes. Other nutrients are necessary for certain chemical processes to occur.
Table 3. Seventeen essential plant nutrients derived from air, water and soil.
| Plant nutrient | Source | ||
|---|---|---|---|
| Air | Water | Soil | |
| Carbon | X | ||
| Oxygen | X | X | |
| Hydrogen | X | ||
| Primary nutrients | |||
| Nitrogen | X | ||
| Phosphorus | X | ||
| Potassium | X | ||
| Secondary nutrients | |||
| Calcium | X | ||
| Magnesium | X | ||
| Sulfur | X | ||
| Micronutrients | |||
| Boron
|
X | ||
| Chlorine | X | ||
| Copper | X | ||
| Iron | X | ||
| Manganese | X | ||
| Molybdenum | X | ||
| Nickel | X | ||
| Zinc | X | ||
Concept of most limiting nutrient
Just as the capacity of a wooden bucket to hold water is determined by the height of the short stave, crop yields are restricted by the soil nutrient in shortest supply (Figure 5). Increasing the height of the nitrogen (N) stave in the bucket does not increase the bucket’s capacity. In Figure 4, unless sulfur fertility is improved, the value of other fertilizer nutrients is reduced. Soil testing discovers the limiting nutrients (short staves) and maximizes fertilizer returns.
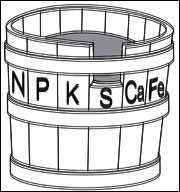 Figure 5
The most limiting nutrient in a soil determines the growth and reproduction of plants.
Essential plant nutrients from the soil
Nitrogen
Nitrogen is a building block of plant proteins. It is an integral part of chlorophyll and is a component of amino acids, nucleic acids and coenzymes.
Most nitrogen in the soil in tied up in organic matter. It is taken up by plants as nitrate (NO3-) and ammonium (NH4+) ions from inorganic nitrate and ammonium compounds. These compounds can enter the soil as a result of bacterial action (nitrogen fixation), application of inorganic nitrogen fertilizer, or conversion of organic matter into ammonium and nitrate compounds.
Not all nitrates in the soil are taken up by plants. Nitrates can be leached beyond the root zone in sandy soils or converted to nitrogen gas in wet, flooded soils. Nitrogen fixation by soil microbes immobilizes nitrogen, making in available for later use by plants.
A soil test is the best way to determine how much nitrogen fertilizer should be added to your soil. Application rates for specific crops are based on typical yield goals, the organic matter content of the soil, the previous crop produced on that soil, and the amount of manure used.
Phosphorus
Plants use phosphorus to form the nucleic acids DNA and RNA and to store and transfer energy. Phosphorus promotes early plant growth and root formation through its role in the division and organization of cells. Phosphorus is essential to flowering and fruiting and to the transfer of hereditary traits.
Phosphorus is adsorbed by plants as H2PO4-, HPO4-2 or PO-3, depending upon soil pH. The mobility of phosphorus in soil is low, and deficiencies are common in cool, wet soils.
Phosphorus should be applied to fields and gardens before planting and should be incorporated into the soil. This is especially important for perennial crops. Application rates should be based on soil testing.
Potassium
Potassium is necessary to plants for translocation of sugars and for starch formation. It is important for efficient use of water through its role in opening and closing small apertures (stomata) on the surface of leaves. Phosphorus increases plant resistance to diseases and assists in enzyme activation and photosynthesis. It also increases the size and quality of fruits and improves winter hardiness.
Plants take up potassium in the form of potassium ions (K+). It is relatively immobile in soils but can leach in sandy soils. Potassium fertilizer should be incorporated into the soil at planting or before. Application rates should be based on a soil test.
Calcium
Calcium provides a building block (calcium pectate) for cell walls and membranes and must be present for the formation of new cells. It is a constituent of important plant carbohydrates, such as starch and cellulose. Calcium promotes plant vigor and rigidity and is important to proper root and stem growth.
Plants adsorb calcium in the form of the calcium ion (Ca+2). Calcium needs can be only determined by soil test. In most cases calcium requirements are met by liming the soil. Potatoes are an exception; use gypsum (calcium sulfate) on potatoes to avoid scab disease if calcium is needed. Gypsum provides calcium to the soil but does not raise the pH level of the soil. Keeping pH low helps prevent growth of the bacteria that cause scab disease.
Magnesium
Magnesium is a component of the chlorophyll molecule and is therefore essential for photosynthesis. Magnesium serves as an activator for many plant enzymes required for sugar metabolism and movement and for growth processes. Plants take up magnesium as the Mg+2 ion.
Sulfur
Sulfur is a constituent of three amino acids (cystine, methionine and cysteine) that play an essential role in protein synthesis. Sulfur is present in oil compounds responsible for characteristic odors of plants such as garlic and onion. It is also essential for nodule formation on legumes.
Plants take up sulfur in the form of sulfate (SO4-2) ions. Sulfur can also be adsorbed from the air through leaves in areas where the atmosphere has been enriched with sulfur compounds from industrial wastes. Sulfur is susceptible to leaching, and sulfur deficiencies can occur in sandy soils low in organic matter. Sulfur needs can be only determined by a soil test.
Zinc
Zinc is an essential component of several enzymes in plants. It controls the synthesis of indoleacetic acid, an important plant growth regulator, and it is involved in the production of chlorophyll and protein. Zinc is taken up by plants as the zinc ion (Zn+2).
Zinc deficiencies are more likely to occur in sandy soils that are low in organic matter. High soil pH, as in high-lime soils, the solubility of zinc decreases and it becomes less available. Zinc and phosphorus have antagonistic effects in the soil. Therefore zinc also becomes available in soils that are high in phosphorus. Wet and cold soil conditions can cause zinc deficiency because of slow root growth and slow release of zinc from organic matter.
Iron
Iron is taken up by plants as ferrous ion (Fe+2). Iron is required for the formation of chlorophyll in plant cells. It serves as an activator for biochemical processes such as respiration, photosynthesis and symbiotic nitrogen fixation. Turf, ornamentals and certain trees are especially susceptible to iron deficiency, although in general, lack of iron in the soil is not a problem. Symptoms of iron deficiency can occur on soils with pH greater than 7.0. Specific needs for iron can be determined by soil test, tissue test and visual symptoms.
Manganese
Manganese serves as an activator for enzymes in plant growth processes, and it assists iron in chlorophyll formation. Plants obtain this nutrient from the soil in the form of manganous ion (Mn+2).
Manganese deficiency in soils is not common but can occur in sandy soils with a pH of 8. Soil pH is a good indicator of manganese availability, which can increase to toxic levels in highly acidic soils (pH less than 4.5). Crops most responsive to manganese are onions, beans, potato, spinach, tomato, peas, raspberries, strawberries, apples and grapes.
Copper
Copper is an activator of several enzymes in plants. It may play a role in production of vitamin A. Deficiency interferes with protein synthesis.
Copper deficiencies are not common in soils. Plants take up copper from the soil in the form of cuprous (Cu+) or cupric (Cu+2) ions. Crops most responsive to copper are carrots, lettuce, onions and spinach.
Boron
Boron regulates the metabolism of carbohydrates in plants. It is essential for the process by which meristem cells (cells that divide) differentiate to form specific tissues. With boron deficiency, plant cells may continue to divide, but structural components are not differentiated.
Boron is taken up by plants as the borate ion (BO3-). Plants differ in their boron needs. Plants with high boron requirements are cauliflower, broccoli, turnip, brussels sprouts, apples, celery and alfalfa. Boron can be limiting on sandy soils low in organic matter. Do not overapply, because boron toxicity can occur ( e.g., beans). Soil testing for boron can predict fertilizer requirement.
Molybdenum
Molybdenum is taken up by plants as molybdate ions (MoO4-). Molybdenum is an essential micronutrient that enables plants to make use of nitrogen. Without molybdenum, plants cannot transform nitrate nitrogen to amino acids and legumes cannot fix atmospheric nitrogen.
Molybdenum deficiency can occur in acidic, sandy soils. Liming the soil to pH 6 will correct the problem. Soil applications, foliar applications or coating seed with molybdenum are also effective. Cauliflower is the main vegetable crop sensitive to low levels of molybdenum in the soil.
Chlorine
Chlorine is required in photosynthetic reactions. Deficiency of chlorine in soils is rare because of its universal presence in nature. Plants take up chlorine as chloride ion (Cl-).
Nickel
Nickel is taken up by plants as Ni+2. Nickel is a component of the enzyme urease, which is needed to prevent toxic accumulations of urea, a product of nitrogen metabolism in plants. Nickel is thought to participate in nitrogen metabolism of legumes during the reproductive phase of growth. It is also essential for seed development. High levels of nickel in the soil can induce zinc or iron deficiency by competition between these elements in plant uptake.
Soil testing for healthier lawns and gardens
The soil test is an excellent gauge of soil fertility. It is an inexpensive way to maintain good plant health and maximum productivity without polluting the environment by overapplication of nutrients.
Soil fertility fluctuates throughout the growing season each year. The quantity and availability of mineral nutrients are altered by the addition of fertilizers, manure, compost, mulch, lime or sulfur and by leaching. Furthermore, large quantities of mineral nutrients are removed from soils as a result of plant growth and development and the harvesting of crops. A soil test will determine the current fertility status. It also provides the information needed to maintain optimum fertility year after year.
Some plants grow well over a wide range of soil pH, while others grow best within a narrow range of pH. Most turf grasses, flowers, ornamental shrubs, vegetables and fruits grow best in slightly acid soils (pH 6.1 to 6.9). Plants such as rhododendron, azalea, pieris, mountain laurel and blueberries require a more acidic soil to grow well. A soil test is the only precise way to determine whether the soil is acidic, neutral or alkaline.
A soil test takes the guesswork out of fertilization and is extremely cost effective. It not only eliminates the expense of unnecessary fertilizers but also eliminates overuse of fertilizers and helps to protect the environment.
When is the best time for a soil test?
Soil samples can be taken in the spring or fall for established sites. For new sites, soil samples can be taken anytime when the soil is workable. Most people conduct their soil tests in the spring. However, fall is a preferred time to take soil tests if one suspects a soil pH problem and wants to avoid the spring rush. Fall soil testing will allow you ample time to apply lime to raise the soil pH. Sulfur should be applied in the spring if the soil pH needs to be lowered.
How to take a soil sample?
Most errors in soil testing occur when the sample is taken. Potential sources of errors include the following:
- Too few cores per sample
- Failure to properly divide the area to be sampled
- Failure to cover the whole area
- Contaminated sample
Taking a representative sample is important in soil testing. Use a trowel, spade and sampling tube/core samplers.
- For garden and lawn establishment or renovation, take a 6-inch sample.
- For established lawns, take a 3- to 4-inch sample after removing thatch.
- Sample from five or more scattered/random spots in the test area.
What soil sampling tools do I need?
A soil sample is best taken with a soil probe or an auger. Samples should be collected in a clean plastic pail or box. These tools help ensure an equal amount of soil to a definite depth at the sampling site. However, a spade, knife, or trowel can also be used to take thin slices or sections of soil.
Push the tip of a spade deep into the soil and then cut a 1/2-inch to 1-inch slice of soil from the back of the hole. Be sure the slice goes 6 inches deep and is fairly even in width and thickness. Place this sample in the pail. Repeat five or six times at different spots over your garden. Thoroughly mix the soil slices in the pail. After mixing thoroughly, take out about 1-1/2 cup of soil and mail or, preferably, take it to your University Extension center. You can also mail or deliver it to the MU Soil and Plant Testing Laboratory in Columbia or at the Delta Research Center in Portageville. It is important that you fill out the soil sample information form (Figure 5) completely and submit it with your sample. By indicating on the form the crops you wish to grow, you can get specific recommendations.
How often should I test my soil?
Soil should be tested every two to three years. In sandy soils, where rainfall and irrigation rates are high, samples should be taken annually.
What tests should be run?
In general a regular fertility test is sufficient. This includes measurement of pH, neutralizable acidity (NA), phosphorus, potassium, calcium, magnesium, organic matter (OM) and cation exchange capacity (CEC).
What do the test result numbers mean?
Some labs report soil test values as amounts of available plant nutrients, and others report extractable nutrients that will become available to the plants (Figure 6). Fertilizer rates are given in pounds of actual nutrient (as distinct from pounds of fertilizer) to be applied per 1,000 square feet.
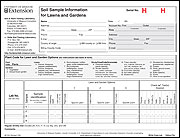 MP555, Soil Sample Information for Lawn and Garden form, for MU soil testing laboratories is available online and at MU Extension centers.
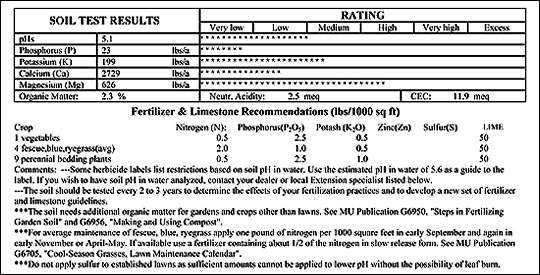
Figure 6. A soil test report from the University of Missouri Soil and Plant Testing Laboratory shows the results of soil analysis and recommends fertilizer and limestone needs to improve plant health and productivity.
Apply fertilizers as recommended by soil test
All fertilizer recommendations given in a soil test report are based on the amount of nutrient (N, P2O5, K2O) to apply for a given area. Lawn and garden recommendations are given in pounds (lb) per 1,000 square feet (sq ft). From the given recommendations it is necessary to select an appropriate fertilizer grade and determine how much of this fertilizer to apply to the garden area. Numbers on fertilizer bags indicate the exact percentages of nutrients by weight: 100 lb of 5-10-10 fertilizer contains 5 lb of nitrogen (N), 10 lb of phosphate (P2O5), and 10 lb of potash (K2O). Because it is difficult to achieve the exact amount of all recommended nutrients from the garden fertilizer blends available in the market, it is important to match the nitrogen requirement.
Example
A soil test recommendation for your vegetable garden calls for 2 lb of N/1,000 sq ft, 0 lb of P2O5 /1,000 sq ft and 1 lb of K2O. The garden is 40 ft by 10 ft.
- Step 1
Calculate the area to be fertilized. Multiplying length by width, the area of the garden is 40 x 10 = 400 sq ft. - Step 2:
Select the fertilizer to be used. Match the ratio of nutrients recommended to the fertilizer grades available. The N-P-K nutrient ratio based on the soil test is 2-0-1. Ideally, a fertilizer such as 10-0-5 or 20-0-10 or 30-0-15 should be selected. At the local garden store, fertilizer bags marked 20-10-10, 27-3-3 and 25-0-12 are available. The one marked 25-0-12 best matches the ratio of 2-0-1 recommended by soil test. - Step 3
Determine the fertilizer amount to apply: Divide the recommended amount of nutrient by the percentage of the nutrient (on a decimal basis) in the fertilizer.- First calculate the fertilizer recommendation for the garden area:
2 lb of N / 1,000 sq ft x 400 sq ft area = 0.8 lb of N per 400 sq ft garden. 100 lb of the 25-0-12 garden fertilizer blend will have 25 lb of N and 12 lb of K2O. - To provide 0.8 lb of N for the 400 sq ft garden you would require:
100 lb for fertilizer blend / 25 lb of N x 0.8 lb of N = 3.2 lb of the fertilizer blend required to provide the N requirement of the garden. Since the fertilizer blend ratio is almost the same as the recommended ratio, it will provide the required amount of K (1.6 lb of K2O) to the garden.
- First calculate the fertilizer recommendation for the garden area:
Note
The weight of 2 cups of dry fertilizer is about 1 pound. Therefore, to meet the garden fertilizer recommendation, you will need about 6 cups of the fertilizer blend (25-0-12) material for the 400 sq ft area.
Recommended application rate for various granular fertilizers to apply 1 pound of nitrogen.
| Application rate | |||
|---|---|---|---|
| Per 1,000 square feet | Per 10 square feet | ||
| Source | Pounds | Cups | Tablespoons |
| 10-10-10 | 10 | 20 | 4 |
| 8-8-8 | 12.5 | 25 | 5 |
| 12-4-8 | 8 | 16 | 3 |
| 16-4-8 | 6 | 12 | 2 |
| 20-10-10 | 5 | 10 | 2 |
| 12-6-6 | 8 | 16 | 3 |
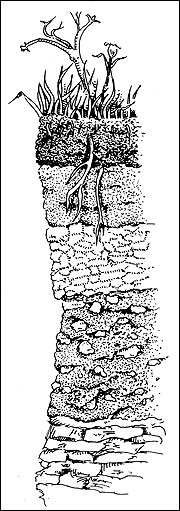 Manjula V. Nathan
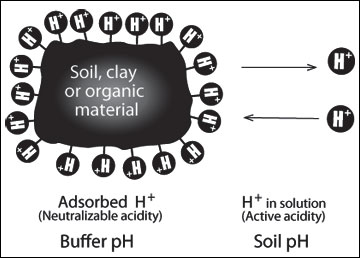 To determine how much lime your soil needs to correct soil acidity, it is important to test for buffer pH, which indicates neutralizable acidity.