Recording observational data on a log sheet is one of the easiest and most cost-effective methods for gathering information on the composition of a deer herd (Figure 1). The only tools required are a pencil, paper and binoculars; and the process can be as simple as recording the number and sex of deer seen and the length of time spent hunting.
When collected and analyzed appropriately, observational data can be extremely useful in determining several important deer herd population characteristics: relative deer abundance, fawn recruitment, age structure and sex ratio. Observational data cannot be used to determine actual deer abundance, but it can be used to determine population trends over time.
Consistency is extremely important when collecting observational data. To allow for among-year comparisons, data must be collected in the same manner and during the same time period each year.
Some hunters in hunting clubs or cooperatives may be reluctant to report accurate observations in a camp log book because they don’t want to reveal the locations of bucks. A simple solution is for each hunter to have an individual log book that is submitted after the hunting season. Individual landowners and members of wildlife management cooperatives should keep observational records for their individual properties and submit those data after the hunting season or during a predefined observation period.
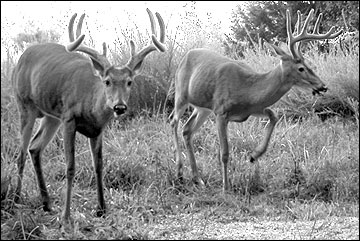
 Figure 1. To determine the composition of the deer herd on your property, count and accurately classify every deer seen during each outing.
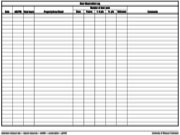
 Figure 2. Sample deer observation log PDF
Methods for counting deer
Count every deer observed during each outing, even if a particular deer was seen during a previous trip. Deer commonly use the same area and are often counted multiple times, which is fine. The purpose is not to count every deer on a property but to determine the relative abundance of deer and proportions of bucks, does and fawns in the herd.
Unless a deer can be positively identified as a buck, doe or fawn, record it as unknown. Do not guess on the classification of a deer. Recording deer you are uncertain of can lead to inaccurate conclusions. Having a smaller number of known deer is better than introducing uncertainty into the data with misidentification.
Observational data to record
Date
Record the date of the observation to ensure that similar observational periods can be compared between years.
Time of day
Divide the day into two observational periods: AM and PM. Record observations occurring before noon as AM and after noon as PM.
Total hours
Record the total number of hours spent observing, rounded to the nearest 15 minutes. Accurately recording the amount of time spent observing or hunting is important for calculating the frequency of deer sightings.
Property/Area/Stand
Note where on the property the observation took place. How this is noted can be adjusted based on the needs of the individual or group. If members of a hunting group or cooperative are reluctant to identify specific locations of deer sightings, divide the property under management into large areas and take observations on a larger scale. Observations from within a predefined region of larger properties can be important in determining if areas have differing deer densities or if hunting pressure is affecting deer movement.
Does
Record the number of does observed that are at least 1-1/2 years old.
Fawns
Record the number of male and female fawns observed.
Bucks, 1 to 6 points
Record the number of bucks with one to six antler points (longer than one inch) and note which would be protected under antler point restrictions.
Bucks, 7 or more points
Record the number of bucks with seven or more (7+) antler points.
Unknown
Record the number of deer observed that could not be definitively identified as a buck, doe or fawn. Remember the importance of not guessing. It is far better to mark a deer as unknown than to miss-classify an animal.
Comments
Record additional information that is not included in one of the predefined columns. Comments may include size of bucks observed or observation of a mature buck that doesn’t qualify for harvest under antler restrictions. Also, record behavior interactions such as bucks chasing does, feeding times and weather conditions.
Calculating population indices using observational data
Using the recorded observational data, you can calculate the following population indices, which provide important information about the condition and population structure of your deer herd:
- Relative abundance
- Sex ratio
- Fawn recruitment
- Age structure
These indices are described below along with examples of how to calculate them. The examples are based on the following sample observational data:
- Total observation hours: 56
- Total deer observations: 93
- Bucks with 1 to 6 points: 8
- Bucks with 7+ points: 4
- Total adult bucks (1-1/2+ years old): 12
- Total adult does (1-1/2+ years old): 38
- Total fawns: 41
- Total unknown: 2
Relative abundance
The actual abundance, or total number, of deer in an area cannot be calculated from observational data, but relative trends of deer abundance can be estimated. The rate at which deer are sighted — the number of deer seen per observation hour — is a starting point for future comparisons of total abundance. Relative abundance can be used to determine your deer management goals and to evaluate the effectiveness of your management efforts.
For example, if the management goal for your property is to increase the number of legal bucks with 7+ points, then success can be measured by comparing the change in sighting rates of bucks with 7+ points over time. Using the sample data above, the sighting rate of 7+ point bucks is 4 observations divided by 56 observation hours, or 0.07 bucks with 7 or more points sighted per hour. The total deer-sighting rate is 93 deer divided by 56 observation hours, or 1.67 deer per hour.
Sex ratio
The sex ratio of a deer population is simply the ratio of does to bucks. More specifically, the adult (1-1/2+ years old) sex ratio is the ratio of adult does to adult bucks.
The adult sex ratio is most frequently used in determining the success of deer management decisions because the total sex ratio includes fawns. It is a better measure of management success because it is indicative of the number of adult bucks in the population. However, observational data can be biased towards does and young bucks because mature bucks tend to be more nocturnal and are thus less likely to be observed. One way to correct for this is to compare the number of mature bucks observed using infrared cameras to the number observed by hunters. If they differ, camera observations should be considered more accurate.
Using the sample data, the estimated adult sex ratio is 38 adult doe observations divided by 12 adult buck observations, or about 3 does to 1 buck in the population.
Fawn recruitment (fawns per doe)
The fawn-to-doe ratio is simply the average number of fawns per adult doe. Observational data collected in late summer or early fall gives a good estimate of fawn recruitment, which is the number of fawns that survived long enough to be recruited into the fall population.
Fawn recruitment is an indicator of herd health. Under good nutritional conditions, adult does will produce twins and sometimes triplets. High quality habitats commonly have more than one fawn recruited per adult doe. However, as the nutritional condition declines in an area, so does the fawn-to-doe ratio.
Fawn recruitment is reported as the number of fawns per doe. To calculate fawn recruitment, divide the number of fawns observed by the number of does observed. Using the sample data, 41 fawns observed divided by 38 adult does results in fawn recruitment of 1.1 fawns per doe.
Age structure
Age structure data can be collected from aging harvested deer and, in most cases, observational and harvest data provide similar trends for does. However, if selective buck harvest is employed, determination of buck age structure from harvest data may be biased. In that case, observational data can provide a clearer picture of age structure.
Areas with antler point restrictions will have biased estimates of age structure if estimated from harvest data alone. With some basic training, observers can learn to classify bucks and does into fawn, yearling and adult (2-1/2+ years old) age classes. More experienced observers may be able to further age adult bucks as 2-1/2 years old or 3-1/2+ years old.
Using observational data
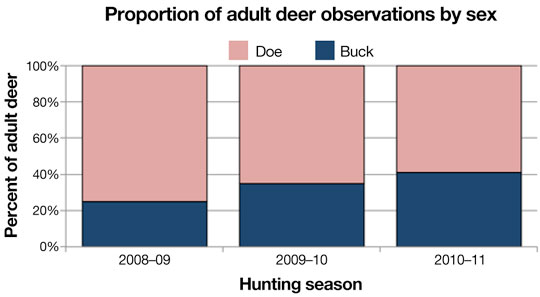
Collecting observational data over a period of years can help your quality deer management (QDM) efforts be successful. Figure 3 provides an example of how observational data can be used. In this case, the QDM goal was to achieve a more balanced sex ratio of the deer herd by increasing the number of antlerless deer harvested. The sex of each deer observed on the property was recorded for three years to monitor the progress of the management efforts. As a result, the sex ratio of the deer herd improved over the three years. The buck proportion of the herd increased from 25 percent of the population during the 2008–09 hunting season to 41 percent of the population by 2010–11 hunting season.
 Figure 3. The data collected on deer observations suggest that management efforts on this property are balancing the herd’s sex ratio.
Conclusion
Sound deer management promotes a well-balanced, healthy deer herd. Setting appropriate harvest recommendations on your property or management area requires a measure of deer density, sex ratio, fawn recruitment and age structure. You can easily collect this information by recording deer sightings and other observations on your property.