Land application rates for manure historically have been structured around protecting groundwater resources from overapplication of nitrogen in manure. However, high levels of phosphorus accumulation in some fields receiving manure and the decline in water quality in some Missouri lakes and streams have led to questions about this nitrogen-based strategy.
Confined livestock operations are a major source of income for Missouri farmers. Livestock accounts for about 50 percent of farm cash receipts, with a value near $2.5 billion annually. Continued success of this industry requires managing manure in a way that protects water resources.
This guide defines the unique aspects of managing manure as a phosphorus fertilizer source and provides practical information about management strategies to reduce phosphorus losses from your farm.
Managing manure as a fertilizer
Manure contains nitrogen (N), phosphorus (P) and potassium (K) that can be used to fertilize crops. There is limited research on whether the phosphorus and potassium content of manure is as effective as that in commercial fertilizer. Manure phosphorus is thought to be 80 to 100 percent as effective as that in commercial fertilizer; manure potassium, 100 percent as effective.
Producers who apply manure at a uniform rate can safely subtract the phosphorus and potassium content of the applied manure from the fertilizer needs of the field. The effectiveness of manure phosphorus and potassium as a fertilizer is typically unaffected by placement. The availability of phosphorus and potassium in surface-applied manure is equivalent to that in injected or incorporated manure.
In contrast, the availability of nitrogen in manure is strongly affected by placement in the soil. Nitrogen availability in injected swine lagoon effluent can approach 90 percent, whereas availability can be less than 60 percent if the same manure is surface applied.
P2O5 versus P
Phosphorus soil test recommendations and phosphorus fertilizer sales are reported as P2O5 (phosphate). Manure testing results can be on a P (phosphorus) or P2O5 basis. Plant content is usually reported on a P basis. Converting from one to the other is simple:
P = P2O5 x 0.44
P2O5 = P x 2.29
Double check the form of your fertilizer recommendation and manure testing result to be sure they match before calculating application rates.
Similarly, potassium can be reported as K (potassium) or K2O (potash). Conversion factors are
K = K2O x 0.83
K2O = K x 1.20
Manure is an unbalanced fertilizer
Farmers purchasing commercial fertilizer can have the product custom blended to match the exact needs of their crop. Commercial fertilizer applications based on results of soil testing are unlikely to raise soil test phosphorus and potassium to excessive levels.
In contrast, the nutrient ratios of manure are fixed. If manure is applied to meet the crop need for one nutrient (e.g., N), a fixed amount of all the other nutrients is applied as well (e.g., P and K). These nutrients come with the manure whether they are needed or not.
Manure applications typically exceed the annual capacity of the crop to remove phosphorus when application rates are based on crop nitrogen need. If you apply 100 pounds of nitrogen as poultry litter, you will also apply 100 pounds of P2O5, a nitrogen-to-phosphate ratio (N:P2O5) of 1 (Table 1). Annual phosphorus removal capacity of Missouri crops ranges between 5 and 60 pounds P2O5 per acre (Table 2).
Manure nitrogen-to-phosphate ratios are typically less than crop needs. (Compare Tables 1 and 2.) In some cases such as pastures, the differences are dramatic. More phosphorus is applied than the crop can remove in one year with nitrogen-based manure application strategies.
Phosphorus buildup will be fastest in systems where the difference in N:P2O5 between crop and manure is greatest. That is why we see the most buildup of phosphorus on pasture systems and systems using poultry litter.
This excess phosphorus is good if the manure is applied to fields with low soil test phosphorus. It will raise the fertility of the soil, increasing the productivity of the field. (See box below Table 2.) Applying additional phosphorus to soils that test very high or excessively high provides no agronomic value to the crop and may constitute a phosphorus pollutant source that may be transported to surface water and groundwater.
Table 1
Estimated P2O5 application with 100 pounds of total nitrogen applied from selected manure sources and their nitrogen-to-phosphate ratio.
| Source | Total N | P2O5 | N:P2O5 |
|---|---|---|---|
| Swine lagoon | 100 pounds | 36 | 2.7 |
| Swine slurry | 100 pounds | 60 | 1.7 |
| Dairy lagoon | 100 pounds | 80 | 1.2 |
| Dairy slurry | 100 pounds | 50 | 2 |
| Poultry litter | 100 pounds | 100 | 1 |
Note
The ratio of nitrogen to phosphate on an available nitrogen basis would be lower than appears here. Manure characteristics can vary dramatically. Test your manure to determine the true application rates.
Table 2
Estimated annual fertilizer maintenance need for N and P2O5 and the maintenance N:P2O5 of selected crops based on MU recommendations.
| Crop | N | P2O5 | N:P2O5 |
|---|---|---|---|
| Corn 135 bushels per acre | 160 | 60 | 2.7 |
| Soybean 35 bushels per acre | 130 | 25 | 5.2 |
| Alfalfa hay 4 tons per acre | 200 | 40 | 5 |
| Fescue hay 3 tons per acre | 120 | 27 | 4.4 |
| Pasture 180 cow day | 108 | 5.5 | 20 |
Note
The nitrogen-to-phosphate ratio is based on the annual nitrogen fertilizer need (or removal capacity for legumes) and the annual phosphorus removal capacity.
Soil test phosphorus: What is it?
Soil testing is a way to identify fields where crops will respond to additional nutrients. The MU Soil and Plant Testing Laboratory uses the Bray-I extraction procedure for phosphorus. Results are reported as pounds of phosphorus per acre.
Soil test results are an index of plant-available phosphorus in the top 6 inches of soil. Research has established a correlation between soil test phosphorus and the probability that a soil will respond to additions of fertilizer phosphorus (Figure 1).
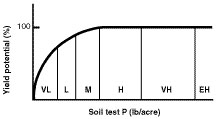 Figure 1
Relationship between soil test phosphorus and yield. Letters refer to soil test level (VL = very low, L = low, M = medium, H = high, VH = very high and EH = extremely high). Scale on the x-axis will differ for different crops, extraction procedures and soil sampling depths.
Other soil test laboratories may use different extracts or sample to different depths. Other common extractants for calcareous soils in addition to Bray-I are Mehlich-III and Olson's P.
It is not appropriate to make direct comparisons of soil test phosphorus determined by different extraction methods. In other words, phosphorus availability is not equivalent in two soils, one with a Bray-I value of 80 pounds P per acre and the second with a Melich-III value of 80 pounds P per acre. Similarly, you cannot substitute soil test values from 3-inch samples for 6-inch samples.
All extraction and sampling systems should similarly identify fields testing low, medium, high or excessive. They will use different criteria to establish these limits.
Other laboratories may report results as parts per million phosphorus (ppm P). Soil test phosphorus from 6-inch samples reported as ppm can be converted to pounds per acre by multiplying by 2.
Soil test phosphorus is not a measure of the phosphorus content of the soil. Soil tests extract only a small fraction of the total phosphorus content. Consequently, it may require 4 to 10 pounds of phosphorus fertilizer to raise soil test phosphorus 1 pound per acre.
Nutrients affect water quality
Nitrogen, phosphorus and potassium, as essential macronutrients, are required for growth by all animals and plants. Lack of these nutrients can restrict growth.
Nutrient levels in surface water often restrict the growth of aquatic species. In freshwaters such as lakes and streams, phosphorus is typically the nutrient limiting growth, though occasionally nitrogen is the most limiting nutrient. Potassium is not a limiting nutrient in water, so water quality concerns focus on nitrogen and phosphorus.
Increasing the amount of nutrients entering a stream or lake will increase the growth of aquatic plants and other organisms. Although these nutrients are necessary, excessive levels overstimulate the lake or stream, reducing the quality of the water. Excessive amounts of nutrients lead to increased algae growth, reduced water clarity, increased water treatment costs, altered fisheries and fish kills, and in the most extremely degraded water, growth of cyanobacteria (blue-green algae) capable of producing human and animal toxins.
The progressive deterioration of water quality from overstimulation by nutrients is called eutrophication.
How is manure phosphorus lost from agricultural fields?
Fields with high losses of phosphorus have both a high source potential and a mechanism to transport that phosphorus to bodies of water (Figure 2). Both of these conditions are most likely to be met in surface water runoff. Phosphorus can travel to surface water attached to particles of soil or manure eroded by water (Figure 3). Phosphorous can also dissolve into runoff water as it passes over the surface of the field.
The ability of soil particles to adsorb soluble phosphorus limits the movement of phosphorus through soil. Soil particles strip soluble phosphorus from the water as it leaches through the soil profile. Concentration of phosphorus in soil leachate can be 10 percent of typical surface runoff concentrations.
Most Missouri soils have a tremendous capacity to adsorb phosphorus, particularly the highly weathered soils in the Ozark region.
Special situations can allow higher concentrations of phosphorus into groundwater. Cracking soils or areas with karst topography create channels in the soil that allow surface water to travel directly to groundwater. The capacity of soil to adsorb phosphorus can be overwhelmed on sandy soils or when the water table is close to the soil surface. Table 3 summarizes management strategies to reduce phosphorus losses on fields with high source or transport potential.
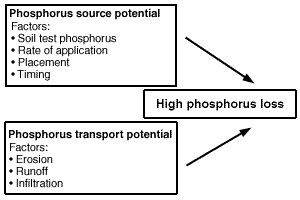 Figure 2
Vulnerability of a field for phosphorus loss requires both a source of phosphorus and a mechanism for transporting phosphorus to the water body. Table 3 suggests ways to manage these factors to reduce phosphorus losses.
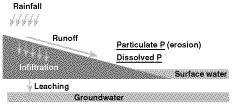 Figure 3
Potential pathways for phosphorus loss from agricultural fields.
Table 3
Management strategies for reducing loss of manure phosphorus.
| Concern | Management | Comments |
|---|---|---|
| High source potential | Select crops with a high P requirement to increase P removal. | Pastures have little P removal capability. |
| Rotate fields receiving manure. | Increases crop removal of P. | |
| Do not apply P fertilizer on high P testing soils. | Crop response to fertilizer P is highly unlikely on these soils. | |
| Maintain ground cover to reduce erosion and runoff. | Use minimum tillage methods on row crops or grow forages. | |
| Incorporate manure. | Inject or incorporate along the contour to minimize erosion. | |
| High transport potential | Do not apply to frozen or snow-covered soils.* | Reduces potential for flash losses of soluble P. |
| Do not apply when rainfall is imminent. | Prevents flash losses of soluble P. | |
| Maintain ground cover to reduce erosion and runoff. | Forages are most effective at reducing runoff and erosion. | |
| Inject manure. | Inject along the contour to minimize erosion and increase infiltration. | |
| Avoid application on fields with high slope. | Sloping fields have higher runoff potential; DNR requirement on slopes greater than 10 percent. | |
| Maintain buffers and riparian strips.* | Reduces sediment transport; do not apply any source of P to buffer or riparian areas. |
* Requirement of Missouri Department of Natural Resources (DNR)
Phosphorus losses in runoff
Phosphorus losses from agricultural fields can be divided into three categories:
- Flash losses of soluble phosphorus soon after application of fertilizer or manure
- Slow leak losses of soluble phosphorus
- Erosion events
Flash losses of soluble phosphorus
Manure, like fertilizer, has a vastly higher concentration of soluble phosphorus than soil does. If a rainfall runoff occurs soon after a surface application, the concentration of soluble phosphorus in the runoff can be more than 100 times higher than normal in the runoff.
Over time, highly soluble manure and fertilizer phosphorus on the soil surface will react with the soil, reducing soluble phosphorus in runoff back to initial levels. Normal levels return over the course of a month in warm soils, longer in cold soils. Manure and fertilizer application is not recommended on frozen or snow-covered soils because phosphorus never has a chance to react with the soil before runoff occurs.
Research from Arkansas on poultry litter and swine manure applied to pastures shows that soluble phosphorus concentrations increase in direct proportion to increasing application rate in these flash phosphorus loss events.
Flash losses of soluble phosphorus have high concentrations of phosphorus in a form that is readily available to aquatic organisms. These events occur only if rainfall runoff occurs soon after a surface phosphorus application or when phosphorus is surface applied to frozen or snow-covered fields. However, one ill-timed application can contribute more phosphorus to surface water than is lost by all other processes over the course of a year or more.
To minimize flash losses of soluble phosphorus:
- Apply phosphorus sources below the soil surface in a manner that does not increase soil erosion.
- Surface-apply phosphorus sources during periods of the year when runoff is unlikely.
- Surface-apply phosphorus sources only on fields with a low potential for runoff.
- Do not surface-apply phosphorus sources to frozen or snow-covered soils.
- Maintain low-phosphorus buffer strips around water resources.
- Add alum or a similar treatment to manure to reduce the availability of phosphorus.
Slow leak losses of soluble phosphorus
All soils naturally release some soluble phosphorus into surface runoff. The concentration of soluble phosphorus in runoff is affected by the soil test phosphorus level of the soil.
Soil tests for phosphorus were developed to help estimate phosphorus fertilizer requirements for crops. Research on soils from other states indicates that soils near optimum soil test levels for growing crops typically support soluble phosphorus concentrations of 0.5 ppm or less.
There is substantial evidence that soluble phosphorus concentration in runoff will increase linearly with increasing soil test phosphorus levels. This linear relationship changes from soil to soil. Tripling soil test phosphorus above the high soil test category may increase soluble phosphorus in runoff to 0.5-2.5 ppm.
Slow leak phosphorus losses are important because they occur in every runoff event. Because of the cumulative effect of multiple runoff events, this mechanism can be the most important source of phosphorus loss. To minimize slow leak losses:
- Apply phosphorus only to fields that have an agronomic need for phosphorus.
- Reduce the amount of annual runoff from agricultural fields through crop selection and soil conservation practices.
- Maintain buffer strips where no phosphorus is applied around water resources.
Erosion losses
When runoff water gains sufficient energy to cause soil erosion, the amount of phosphorus lost from the field increases dramatically. Controlling erosion losses by reducing or eliminating tillage on corn or wheat can reduce total phosphorus losses by 50 percent or more.
In soil, the total phosphorus is much higher than the soluble phosphorus content. Soil particles have a tremendous capacity to fix soluble phosphorus, allowing only a small proportion of the plant-available phosphorus to exist in the soluble form.
The sorting of soil particles that naturally takes place during erosion results in the soil particles with the highest phosphorus concentration being carried with runoff. Soils with higher soil test phosphorus levels will have higher phosphorus content in eroded particles. To minimize erosion losses of P:
- Adopt soil conservation practices to minimize soil erosion.
- Maintain buffer strips around water resources where no phosphorus is applied.
Animals defecating in streams
One potent symbol of the negative impact of agriculture on water quality is a picture of cattle defecating in a stream. The total phosphorus deposited by a cow is approximately 0.01 pounds phosphorus per defecation. Over 90 percent of this phosphorus will be in the feces. Studies of simulated rainfall events show that runoff from forage crops can contain 0.01 to 0.33 pounds P per acre.
Reducing phosphorus losses in watersheds
Improving water quality requires reducing the quantity of phosphorus reaching lakes and streams. Practices that reduce phosphorus losses from one field in a watershed or reduce losses of one form of phosphorus from a field may not reduce the amount of phosphorus reaching surface waters.
For example, efforts to better distribute manure phosphorus throughout a watershed may not reduce the amount of phosphorus reaching a lake or stream. Such efforts may even increase phosphorus reaching the lake or stream if phosphorus is applied on land that has higher potential for runoff.
Similarly, extensive tillage should never be used to lower soluble phosphorus losses caused by high soil test phosphorus on the soil surface. Erosion losses from tillage will be much more damaging to the water resource than high testing soil.
The phosphorus index method is the best way to select fields most suitable for manure application. Such an index should account for phosphorus source strength (factors such as soil test phosphorus and manure application rate and placement) and transport (factors such as ground cover, slope, and proximity to the stream or lake).
A phosphorus index has been developed in some watersheds. Numerical factors are applied to various source and transport factors, and the index then ranks the fields according to their potential for phosphorus loss. Research continues on successfully applying the phosphorus index approach to a broad range of watersheds with diverse cropping systems.
In the meantime, we can apply the concept of the phosphorus index to our management decisions (Table 3). On fields with high source potential, minimize runoff. On fields with high runoff potential, ensure phosphorus source levels remain low. Phosphorus loss to the watershed should decline if beneficial practices are applied to all fields receiving manure.
New management options for manure phosphorus
Low-phytate corn and phytase
Monogastric animals such as pigs and chickens are highly inefficient users of phosphorus in grain. Much of the phosphorus in corn is held in a form unavailable to the animal and is excreted in manure. Additional phosphorus must be fed to the animals to compensate for this unavailable phosphorus.
Two strategies are being tested to reduce the amount of phosphorus excreted by pigs and chickens. Varieties of "low-phytate" corn are being developed. Missouri research has shown the phosphorus in such corn is 5 to 6 times more available to the animal. Low-phytate corn can reduce excreted phosphorus by more than 35 percent by reducing the need to add supplemental phosphorus to the diet.
Pigs and chickens are also being fed the phytase enzyme to release unavailable phosphorus in the grain. Feeding phytase has been shown to reduce excreted phosphorus by 20 to 35 percent, again by lowering the total amount of phosphorus fed the animals. Phytase is being fed to chickens on the Delmarva Peninsula in the eastern United States.
Alum
Phillip Moore with the USDA Agricultural Research Service in Fayetteville, Arkansas, has developed a system for adding alum to poultry litter to reduce by 70 percent the loss of phosphorus after land application. Alum (aluminum sulfate) is incorporated into the litter between flocks after the house is decaked at the rate of 1 ton per 10,000 birds.
Benefits of the alum include reduced ammonia levels in the house, particularly during the first 3 to 4 weeks after treatment, higher nitrogen content in the litter, and reduced solubility of manure phosphorus. The soluble phosphorus in the litter is precipitated as aluminum phosphate, which is insoluble in water. An economic analysis in Arkansas shows alum to be profitable if the integrator and the grower share the purchase and application costs.
Research is being conducted on the use of alum to reduce phosphorus solubility in swine slurry.
Interpreting soil test phosphorus for environmental purposes
Phosphorus soil testing has traditionally been used for determining the potential for crop response to fertilizer phosphorus. Recent research has established a positive linear correlation between soil test phosphorus and the concentration of dissolved phosphorus in runoff water. Figure 4 summarizes the results of one such study on an Arkansas soil that also exists in Missouri.
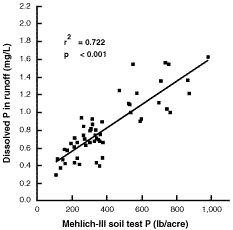 Figure 4
Relationship between Mehlich-III phosphorus in Captina surface soil (0 to 2 centimeters) and dissolved phosphorus in runoff. From Pote et al., 1996
The increase in soil test phosphorus differs for different soils; the same soil test phosphorus on different soils may support different concentrations of phosphorus in runoff. Soils with higher soil test phosphorus support higher concentrations of phosphorus in runoff. Soil-specific data are lacking for most Missouri soils.
The environmental soil test phosphorus, like agronomic soil test phosphorus, is an index procedure that extracts only a portion of the phosphorus in soil. The extraction procedure and the depth of soil sampling will dramatically effect the soil test value reported on a given soil. Caution should be used when quoting critical soil test levels; always note the extraction method and depth of soil sampling. Environmental soil test values from a Bray-I test on a 6-inch sample and a water extract on a 1-inch sample are not comparable.
Extracts being considered for environmental soil test phosphorus include water, Bray-I P, Mehlich-III P and iron-oxide strip P. Depth of soil sample is likely to be about 1 inch because the surface soil is of most importance for surface runoff, although depths ranging from 1 to 6 inches have been used.
There has been a lot of interest in establishing a maximum allowable soil test phosphorus level for agricultural fields. For such a system to work, the depth of sample and the extraction procedure must first be standardized. Then the correlation between the standard environmental soil test phosphorus and phosphorus concentration in runoff must be established for a wide range of soils.
The current state of the art is that we know high-testing soils support higher phosphorus concentrations in runoff, although the absolute levels are not known for specific soils. Soils testing "excessively high" in our agronomic soil test phosphorus procedure should be considered high phosphorus source soils and should be managed to reduce runoff potential.
Always remember that the environmental soil test phosphorus only tells half the story about phosphorus loss. Producers with soils that test high in phosphorus can limit their phosphorus contribution to the watershed through runoff reduction and control.
Conclusions
Manure is an excellent phosphorus fertilizer. Farmers who apply manure uniformly can subtract manure phosphorus from the fertilizer needs of a field.
Phosphorus is the nutrient limiting growth of aquatic organisms in most Missouri streams. Excess phosphorus in runoff into streams, wetlands, and lakes will reduce water quality.
Fields vulnerable to high phosphorus loss must have both a high source potential and a mechanism to transport that phosphorus to the water body. Minimize runoff potential on soils with high source phosphorus; minimize source phosphorus on soils with high runoff potential.
Redistribution of phosphorus in the watershed will reduce phosphorus in runoff only if fields receiving manure have lower runoff potential or are planted in crops with a higher capacity to use the manure phosphorus.
References
- Daniel, T. C., A. N. Sharpley, R. Wedepol, and J. L. Lemunyon. 1994. Minimizing surface water eutrophication from agriculture by phosphorus management. Journal of Soil and Water Conservation 49:30 to 38.
- Sharpley, A. N., et al. 1994. Managing agricultural phosphorus for protection of surface waters: Issues and options. Journal of Environmental Quality 23:437 to 451.
- Pote, D. H., T. C. Daniel, A. N. Sharpley, P. A. Moore Jr., D. R. Edwards, and D. J. Nichols. 1996. Relating extractable soil phosphorus to phosphorus losses in runoff. Soil Science Society of America Journal 60:885 to 859